| Param | Original file | Final file |
|---|---|---|
| Filename | modeM0/AS1A11_106T02_9000005344_37741cztM0_level2.evt | modeM0/AS1A11_106T02_9000005344_37741cztM0_level2_quad_clean.evt |
| Size (bytes) | 410,518,080 | 73,768,320 |
| Size | 391.5 MB | 70.4 MB |
| Events in quadrant A | 2,713,232 | 469,267 |
| Events in quadrant B | 2,977,401 | 463,751 |
| Events in quadrant C | 2,897,975 | 475,112 |
| Events in quadrant D | 3,482,910 | 453,930 |
| Mode M9 | |||
|---|---|---|---|
| Quadrant | BADHDUFLAG | Total packets | Discarded packets |
| A | 0 | 31 | 0 |
| B | 0 | 31 | 0 |
| C | 0 | 31 | 0 |
| D | 0 | 32 | 0 |
| Mode SS | |||
|---|---|---|---|
| Quadrant | BADHDUFLAG | Total packets | Discarded packets |
| A | 0 | 110 | 0 |
| B | 0 | 110 | 0 |
| C | 0 | 110 | 0 |
| D | 0 | 110 | 0 |
| Mode M0 | |||
|---|---|---|---|
| Quadrant | BADHDUFLAG | Total packets | Discarded packets |
| A | 0 | 11465 | 3 |
| B | 0 | 12433 | 2 |
| C | 0 | 11828 | 2 |
| D | 0 | 13971 | 2 |
| Quadrant | Total seconds | Saturated seconds | Saturation percentage |
|---|---|---|---|
| A | 5301 | 18 | 0.339559% |
| B | 5301 | 128 | 2.414639% |
| C | 5301 | 129 | 2.433503% |
| D | 5301 | 153 | 2.886248% |
Noise dominated data is calculated using 1-second bins in cleaned event files. If a bin has >2000 counts, and if more than 50% of those come from <1% of pixels, then it is considered to be noise-dominated and hence unusable.
| Quadrant | # 1 sec bins | Bins with >0 counts | Bins with >2000 counts | High rate bins dominated by noise | Noise dominated (total time) | Noise dominated (detector-on time) | Marked lightcurve |
|---|---|---|---|---|---|---|---|
| A | 7063 | 5300 | 5 | 5 | 0.07% | 0.09% | 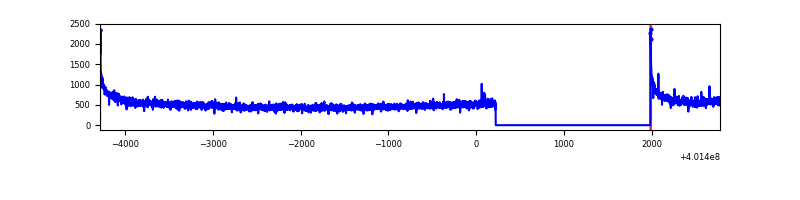 |
| B | 7064 | 5302 | 109 | 109 | 1.54% | 2.06% | 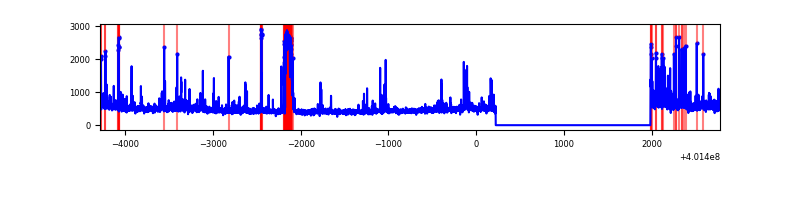 |
| C | 7063 | 5300 | 116 | 116 | 1.64% | 2.19% | 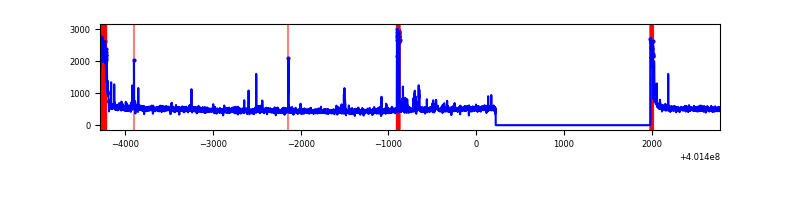 |
| D | 7063 | 5301 | 158 | 158 | 2.24% | 2.98% | 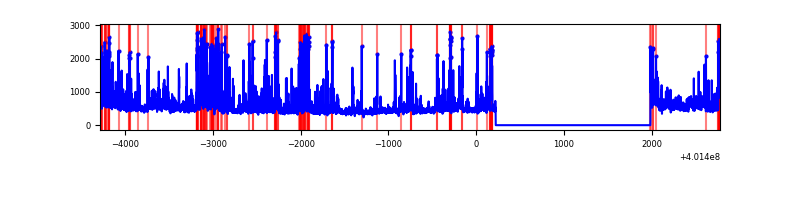 |
Top three noisy pixels from each quadrant. If the there are fewer than three noisy pixels in the level2.evt file, extra rows are filled as -1
| Pixel properties | Quadrant properties | ||||||
|---|---|---|---|---|---|---|---|
| Quadrant | DetID | PixID | Counts | Sigma | Mean | Median | Sigma |
| A | 10 | 83 | 341018 | 2829.0 | 595 | 584 | 120.3 |
| A | 15 | 222 | 23417 | 189.74 | 595 | 584 | 120.3 |
| A | 12 | 189 | 21073 | 170.26 | 595 | 584 | 120.3 |
| B | 4 | 81 | 238499 | 2115.29 | 587 | 571 | 112.5 |
| B | 5 | 255 | 187393 | 1660.93 | 587 | 571 | 112.5 |
| B | 0 | 229 | 56271 | 495.2 | 587 | 571 | 112.5 |
| C | 0 | 10 | 250697 | 1857.93 | 579 | 584 | 134.6 |
| C | 15 | 214 | 225230 | 1668.75 | 579 | 584 | 134.6 |
| C | 14 | 254 | 110275 | 814.82 | 579 | 584 | 134.6 |
| D | 2 | 249 | 674921 | 4472.83 | 575 | 564 | 150.8 |
| D | 2 | 153 | 168061 | 1110.96 | 575 | 564 | 150.8 |
| D | 13 | 249 | 158822 | 1049.68 | 575 | 564 | 150.8 |
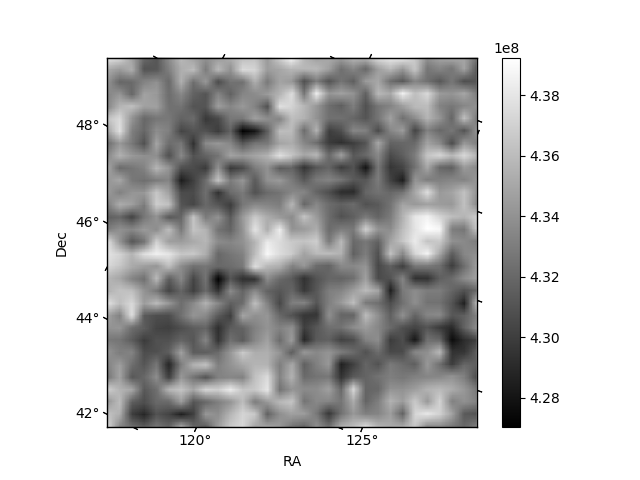
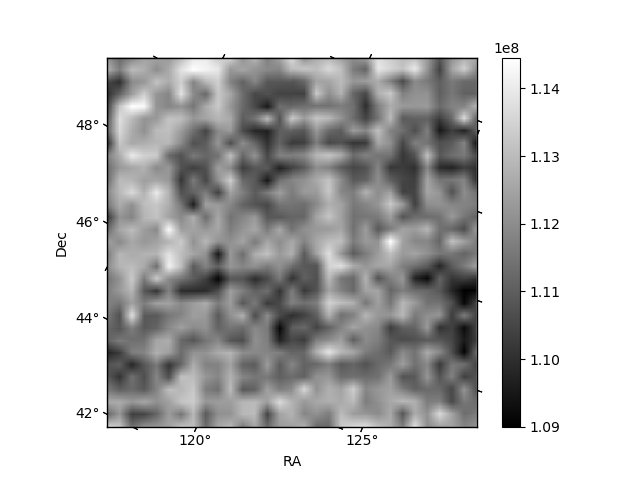
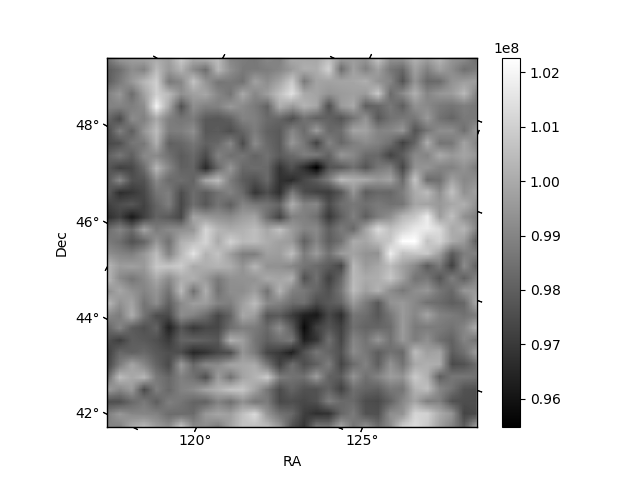
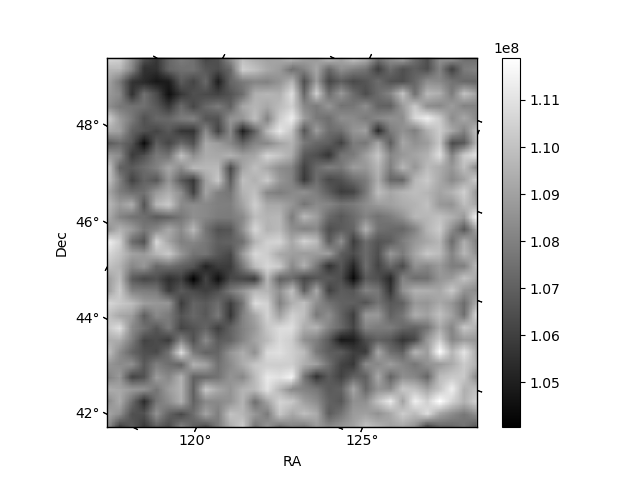
Histogram calculated using DETX and DETY for each event in the final _common_clean file
| Quadrant A | 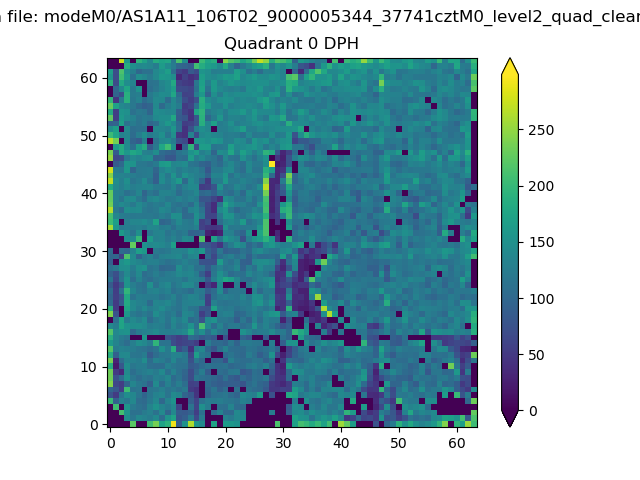 |
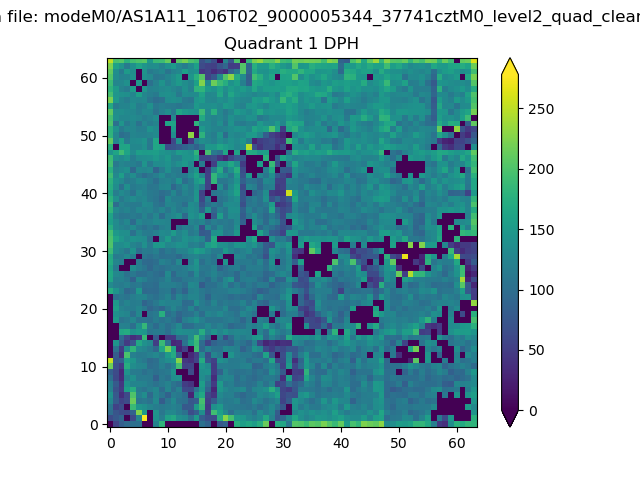 |
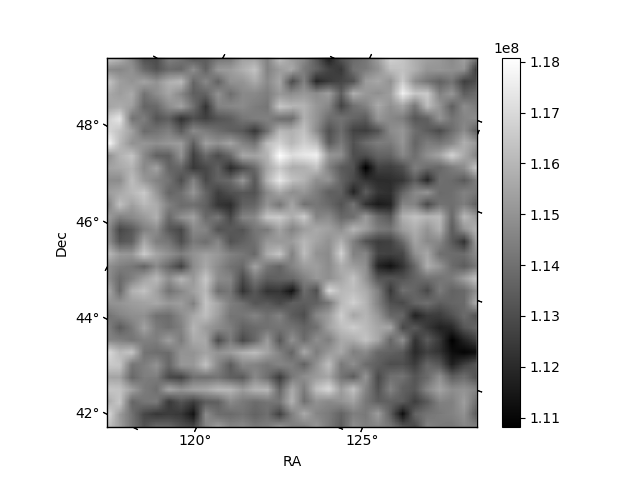
Quadrant B |
|---|---|---|---|
| Quadrant D | 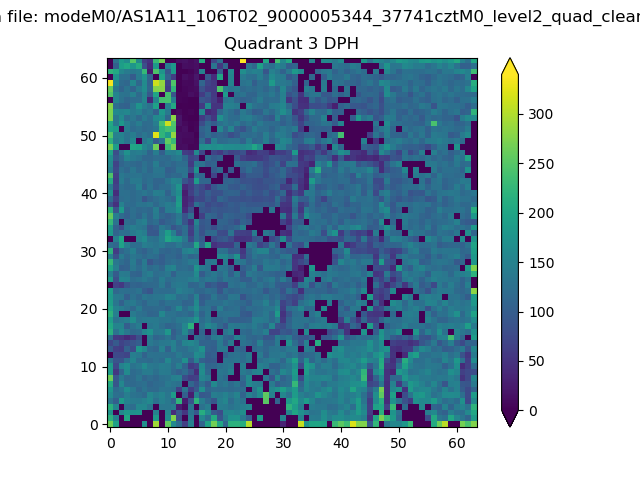 |
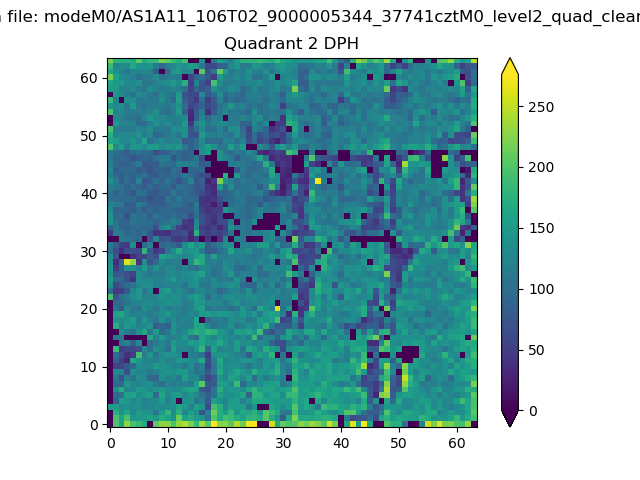 |
Quadrant C |
| Plot type | Count rate plots | Images |
|---|---|---|
| Comparison with Poisson distribution Blue bars denote a histogram of data divided into 1 sec bins. Red curve is a Poisson curve with rate = median count rate of data. |
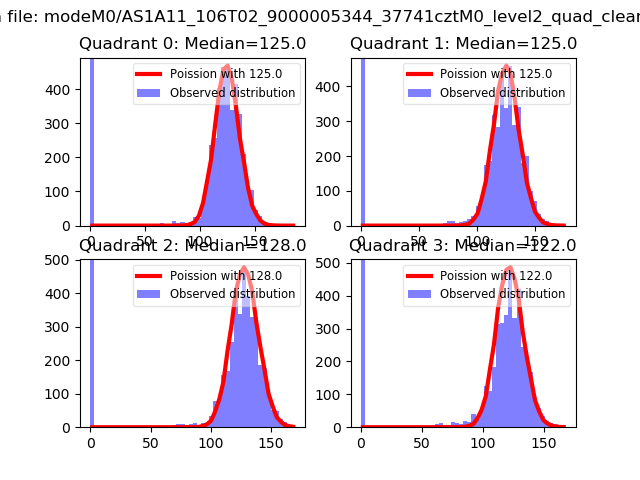 |
 |
| Quadrant-wise count rates Data is divided into 100 sec bins |
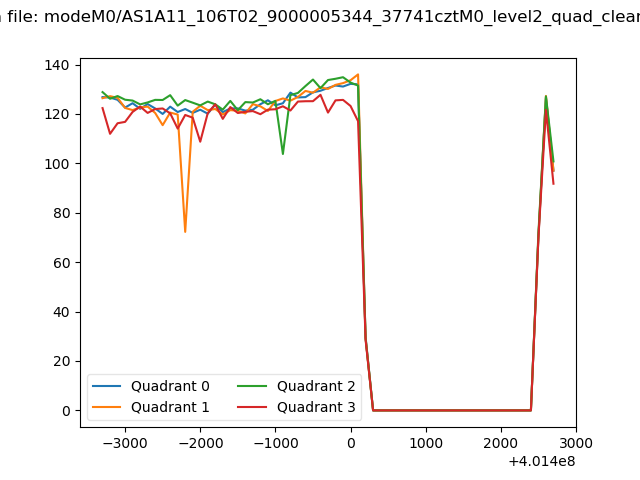 |
|
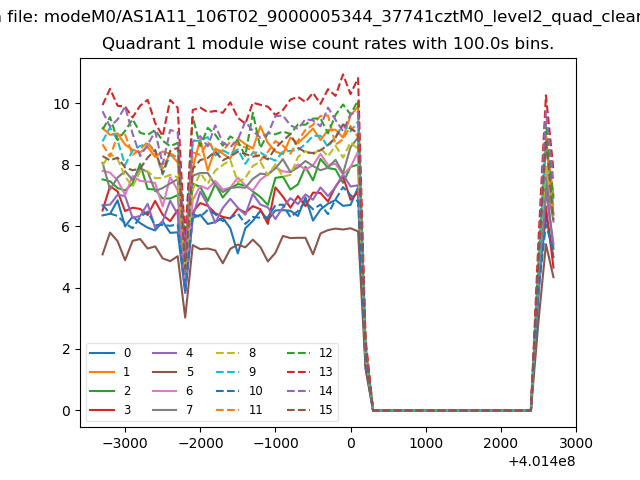
| Module-wise count rates for Quadrant A Data is divided into 100 sec bins |
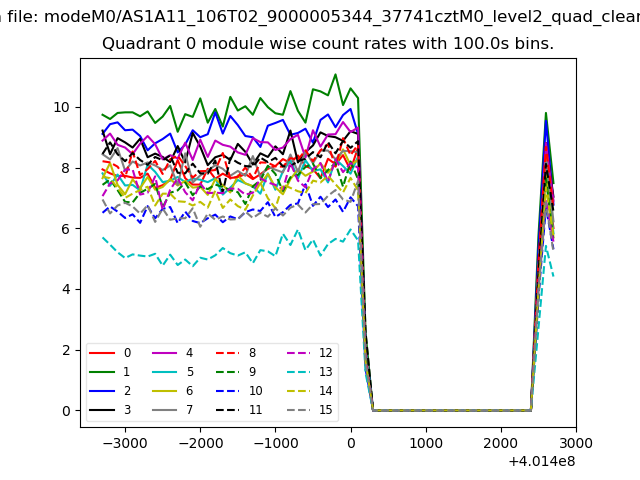 |
 |
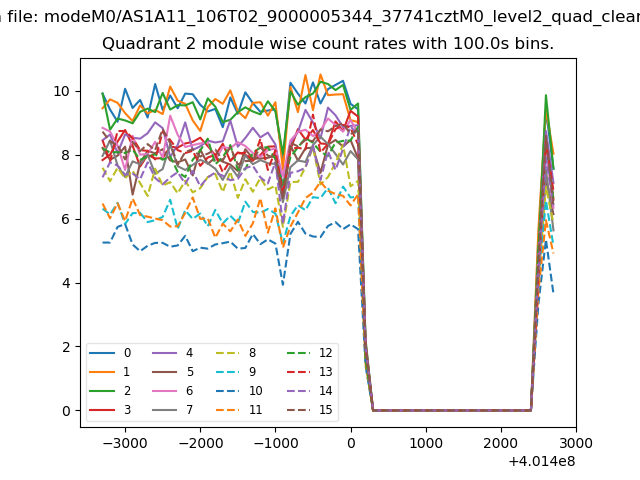
| Module-wise count rates for Quadrant B Data is divided into 100 sec bins |
 |
 |
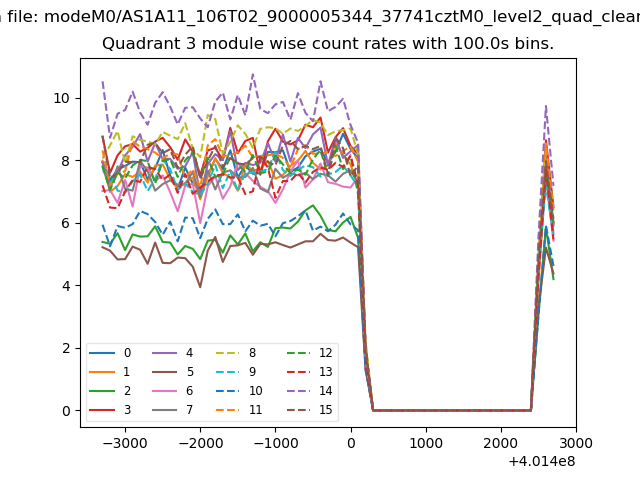
| Module-wise count rates for Quadrant C Data is divided into 100 sec bins |
 |
 |
| Module-wise count rates for Quadrant D Data is divided into 100 sec bins |
 |
 |
| Parameter | Plot |
|---|---|
| CZT HV Monitor | 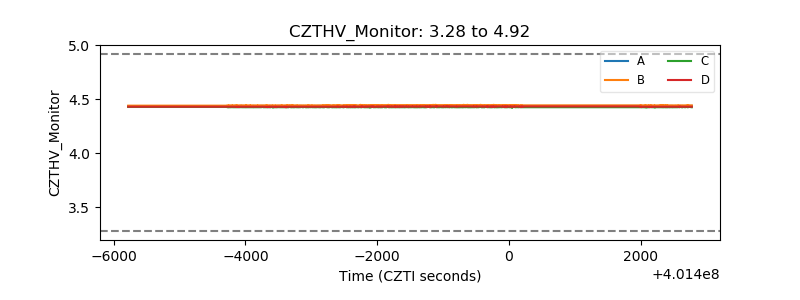 |
| D_VDD | 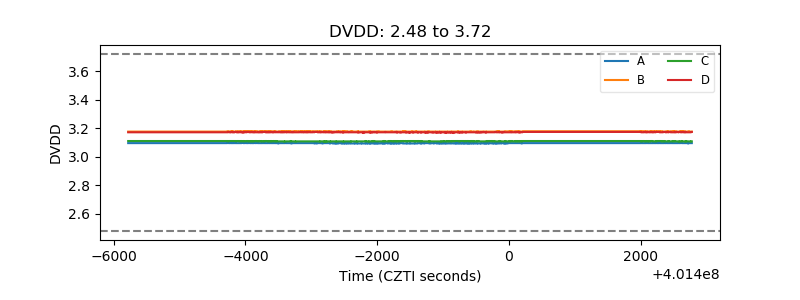 |
| Temperature 1 | 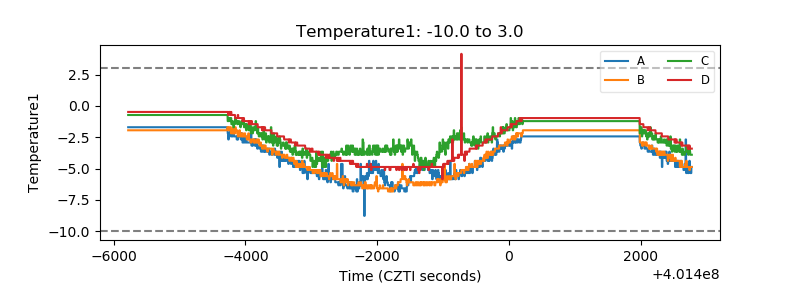 |
| Veto HV Monitor | 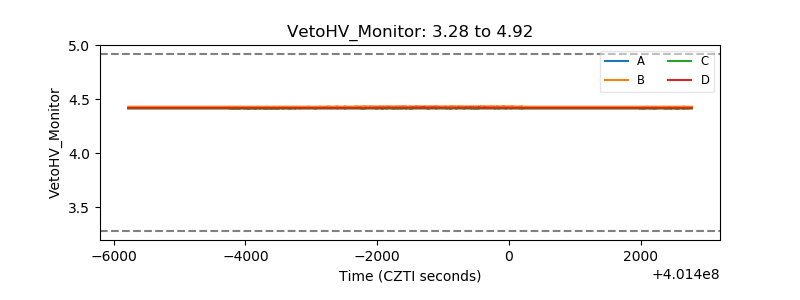 |
| Veto LLD | 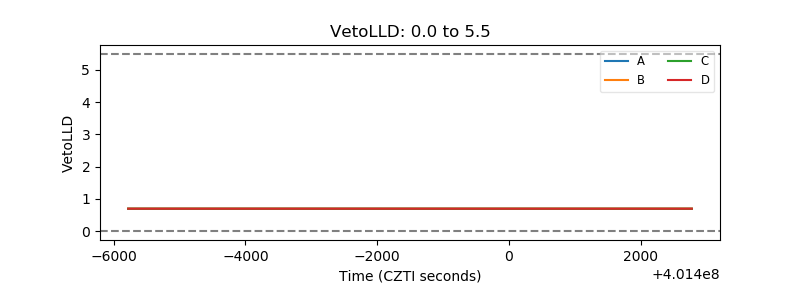 |
| Alpha Counter | 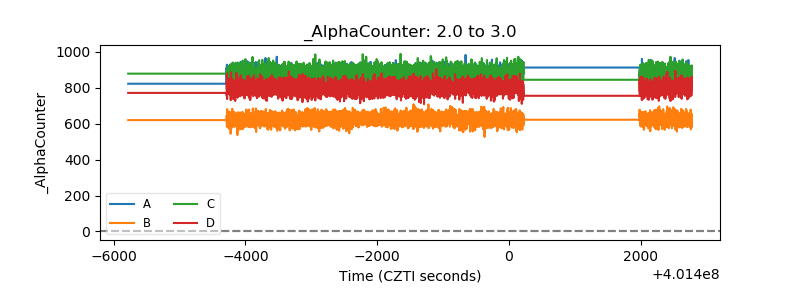 |
| _CPM_Rate | 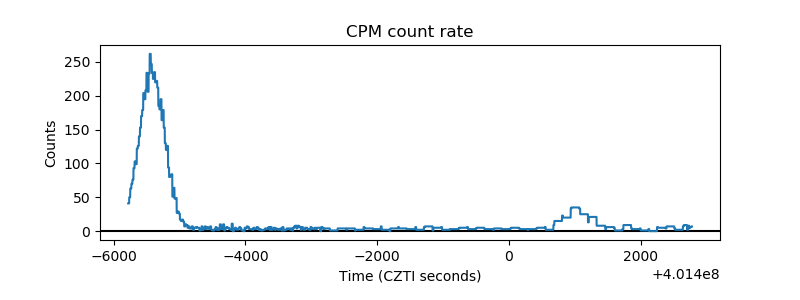 |
| CZT Counter | 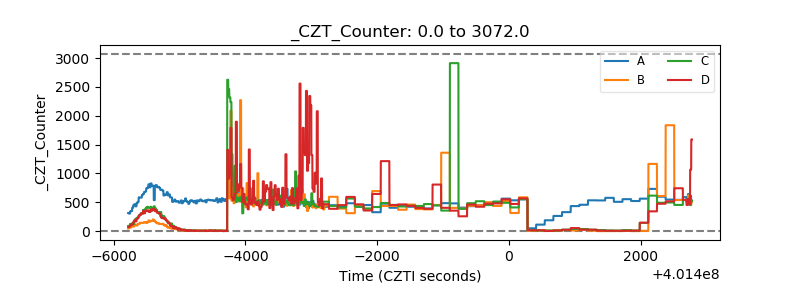 |
| +2.5 Volts monitor | 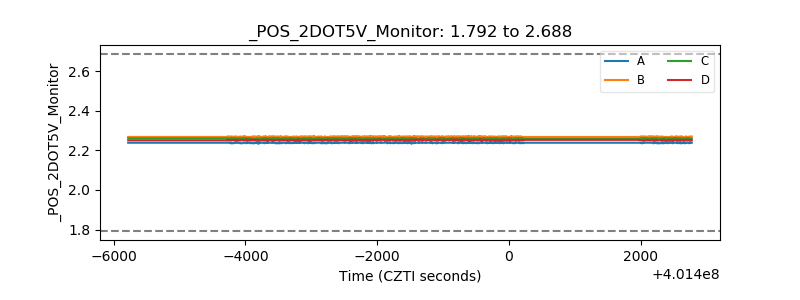 |
| +5 Volts monitor | 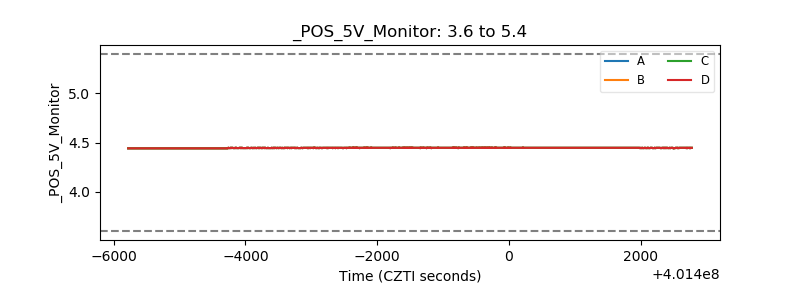 |
| _ROLL_ROT | 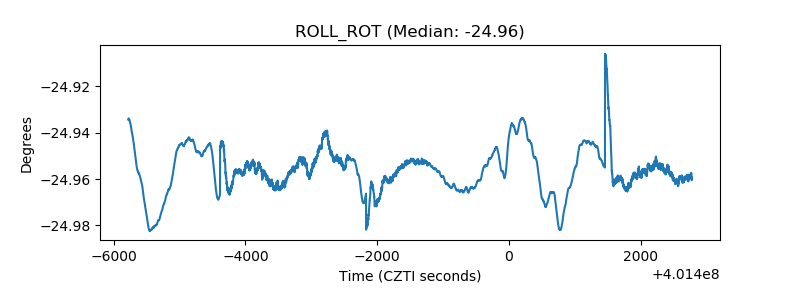 |
| _Roll_DEC | 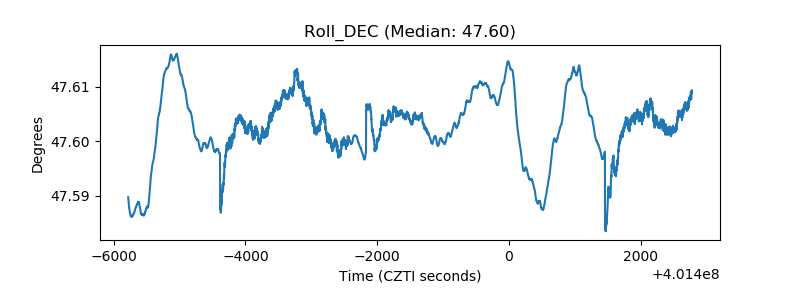 |
| _Roll_RA | 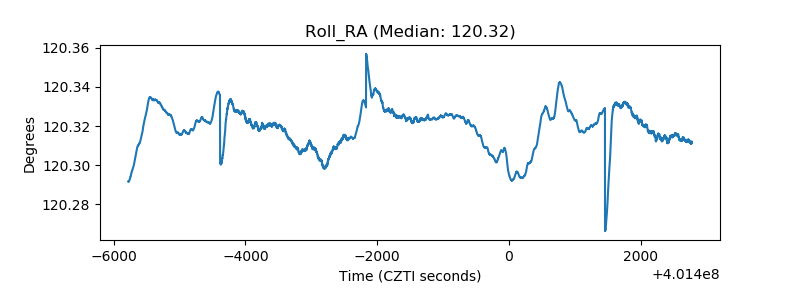 |
| Veto Counter | 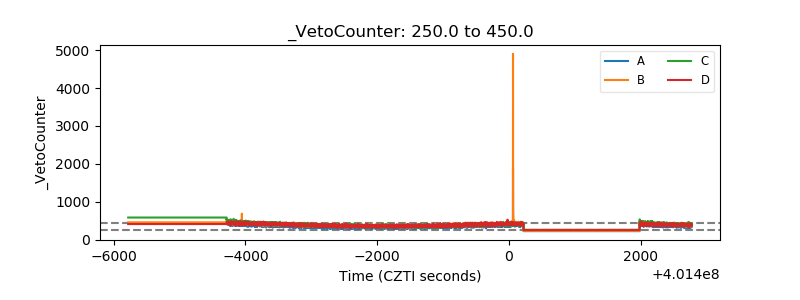 |