| Param | Original file | Final file |
|---|---|---|
| Filename | modeM0/AS1A11_106T02_9000005344_37742cztM0_level2.evt | modeM0/AS1A11_106T02_9000005344_37742cztM0_level2_quad_clean.evt |
| Size (bytes) | 406,716,480 | 88,657,920 |
| Size | 387.9 MB | 84.6 MB |
| Events in quadrant A | 2,856,351 | 572,180 |
| Events in quadrant B | 2,871,374 | 577,493 |
| Events in quadrant C | 2,829,265 | 583,569 |
| Events in quadrant D | 3,378,786 | 559,152 |
| Mode M9 | |||
|---|---|---|---|
| Quadrant | BADHDUFLAG | Total packets | Discarded packets |
| A | 0 | 31 | 0 |
| B | 0 | 31 | 0 |
| C | 0 | 31 | 0 |
| D | 0 | 31 | 0 |
| Mode SS | |||
|---|---|---|---|
| Quadrant | BADHDUFLAG | Total packets | Discarded packets |
| A | 0 | 114 | 0 |
| B | 0 | 114 | 0 |
| C | 0 | 114 | 0 |
| D | 0 | 114 | 0 |
| Mode M0 | |||
|---|---|---|---|
| Quadrant | BADHDUFLAG | Total packets | Discarded packets |
| A | 0 | 12138 | 3 |
| B | 0 | 12397 | 2 |
| C | 0 | 11909 | 2 |
| D | 0 | 13903 | 2 |
| Quadrant | Total seconds | Saturated seconds | Saturation percentage |
|---|---|---|---|
| A | 5612 | 20 | 0.356379% |
| B | 5612 | 60 | 1.069138% |
| C | 5612 | 64 | 1.140413% |
| D | 5612 | 87 | 1.550249% |
Noise dominated data is calculated using 1-second bins in cleaned event files. If a bin has >2000 counts, and if more than 50% of those come from <1% of pixels, then it is considered to be noise-dominated and hence unusable.
| Quadrant | # 1 sec bins | Bins with >0 counts | Bins with >2000 counts | High rate bins dominated by noise | Noise dominated (total time) | Noise dominated (detector-on time) | Marked lightcurve |
|---|---|---|---|---|---|---|---|
| A | 7074 | 5613 | 11 | 11 | 0.16% | 0.20% | 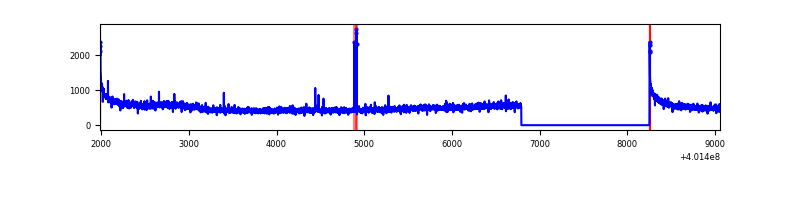 |
| B | 7074 | 5613 | 35 | 35 | 0.49% | 0.62% | 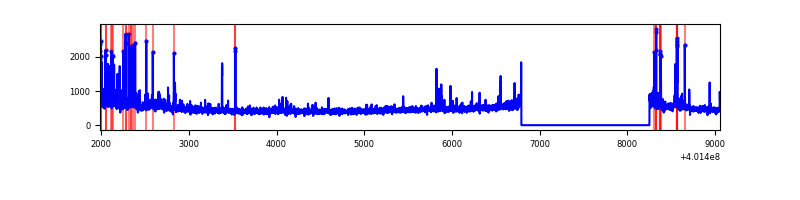 |
| C | 7074 | 5613 | 55 | 55 | 0.78% | 0.98% | 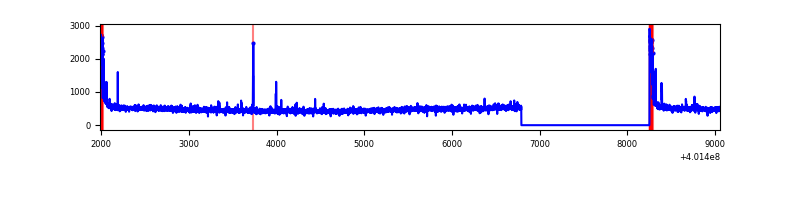 |
| D | 7074 | 5613 | 90 | 90 | 1.27% | 1.60% | 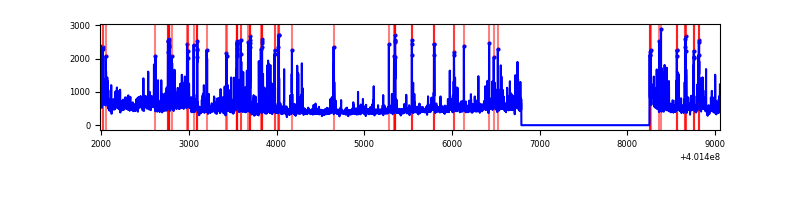 |
Top three noisy pixels from each quadrant. If the there are fewer than three noisy pixels in the level2.evt file, extra rows are filled as -1
| Pixel properties | Quadrant properties | ||||||
|---|---|---|---|---|---|---|---|
| Quadrant | DetID | PixID | Counts | Sigma | Mean | Median | Sigma |
| A | 10 | 83 | 343307 | 2691.18 | 622 | 608 | 127.3 |
| A | 15 | 222 | 61238 | 476.12 | 622 | 608 | 127.3 |
| A | 13 | 6 | 19086 | 145.11 | 622 | 608 | 127.3 |
| B | 5 | 255 | 163397 | 1361.08 | 618 | 601 | 119.6 |
| B | 0 | 189 | 71398 | 591.91 | 618 | 601 | 119.6 |
| B | 5 | 172 | 52994 | 438.04 | 618 | 601 | 119.6 |
| C | 15 | 214 | 236811 | 1661.22 | 608 | 615 | 142.2 |
| C | 0 | 10 | 172388 | 1208.12 | 608 | 615 | 142.2 |
| C | 14 | 254 | 24282 | 166.46 | 608 | 615 | 142.2 |
| D | 2 | 249 | 464527 | 3098.81 | 608 | 591 | 149.7 |
| D | 13 | 249 | 94237 | 625.5 | 608 | 591 | 149.7 |
| D | 2 | 153 | 89674 | 595.02 | 608 | 591 | 149.7 |
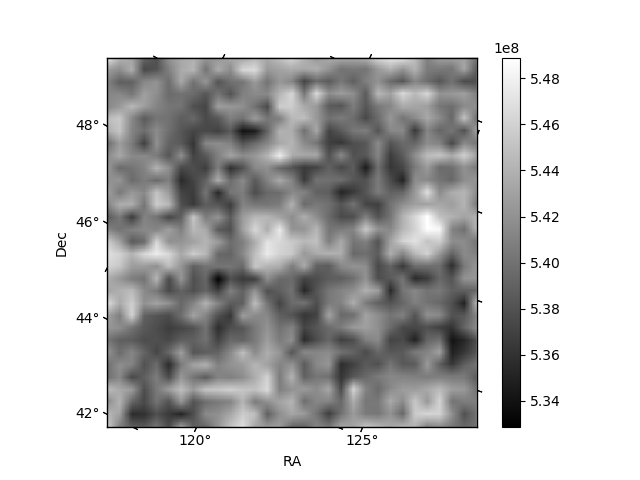
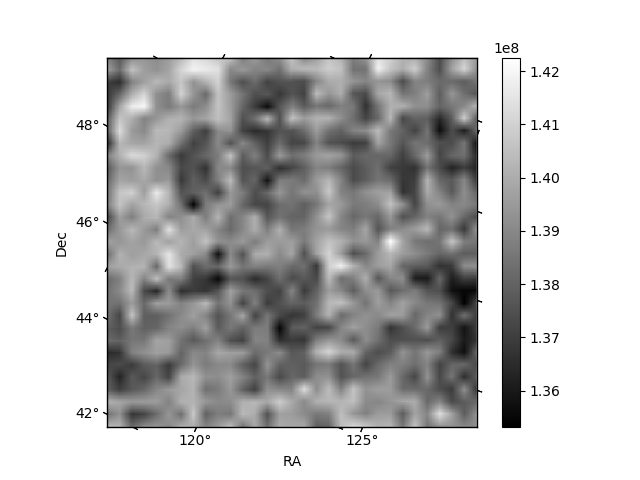
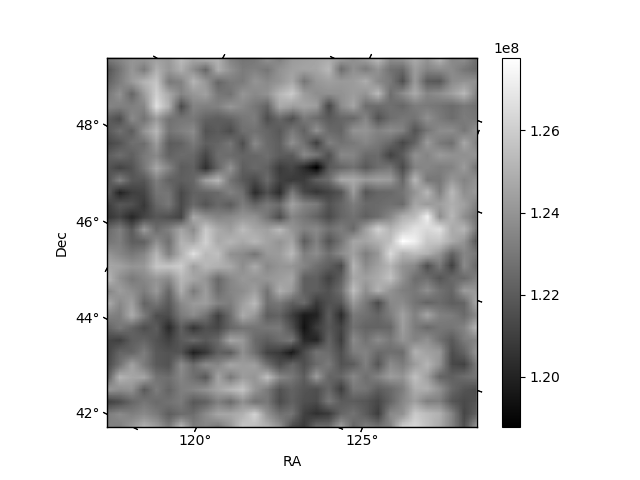
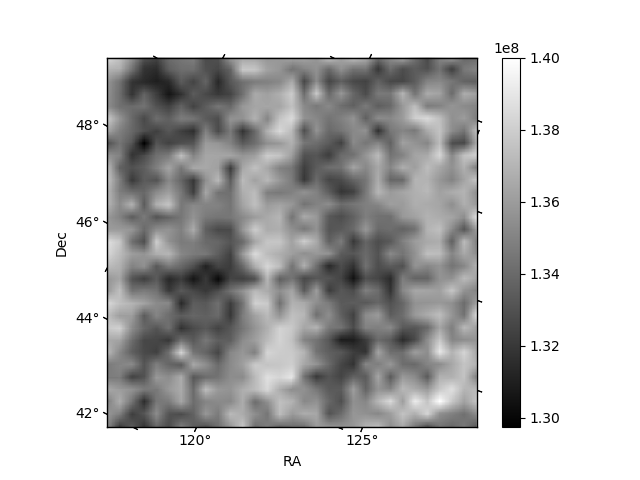
Histogram calculated using DETX and DETY for each event in the final _common_clean file
| Quadrant A | 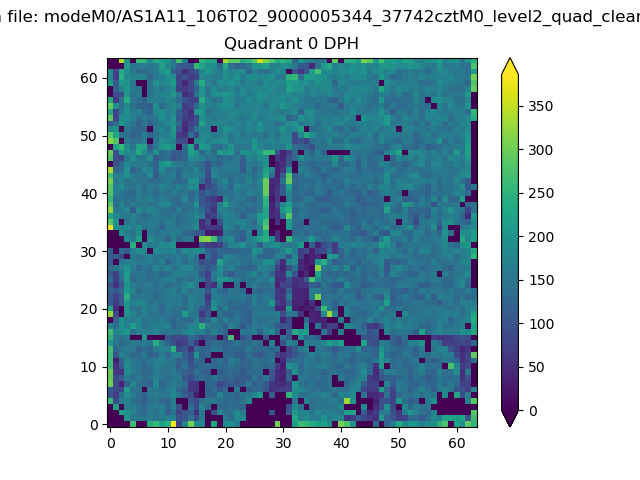 |
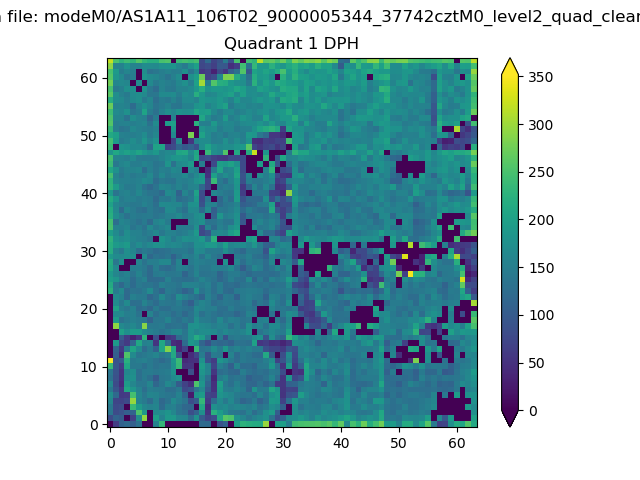 |
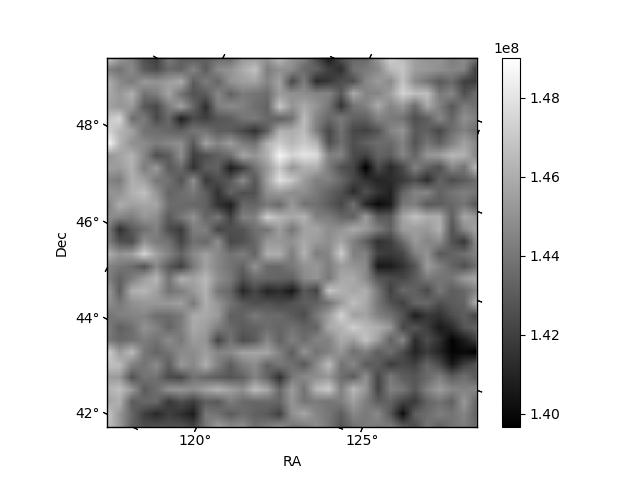
Quadrant B |
|---|---|---|---|
| Quadrant D | 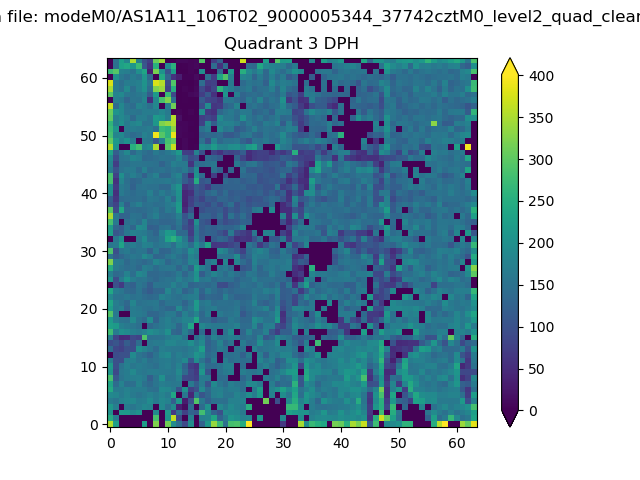 |
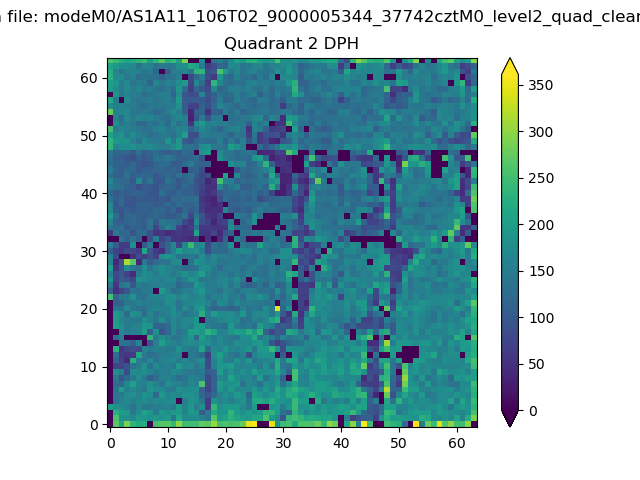 |
Quadrant C |
| Plot type | Count rate plots | Images |
|---|---|---|
| Comparison with Poisson distribution Blue bars denote a histogram of data divided into 1 sec bins. Red curve is a Poisson curve with rate = median count rate of data. |
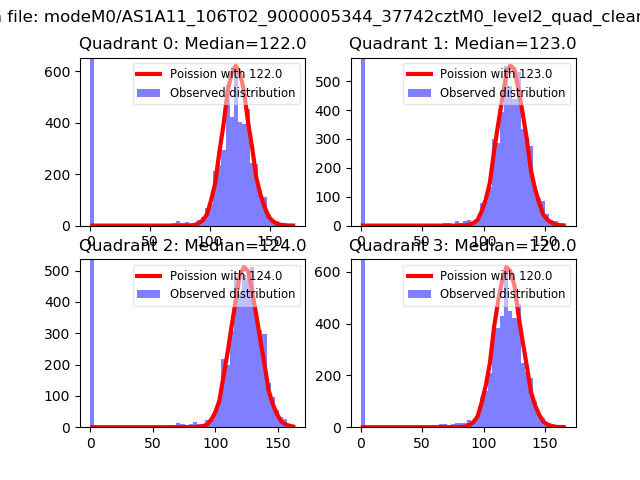 |
 |
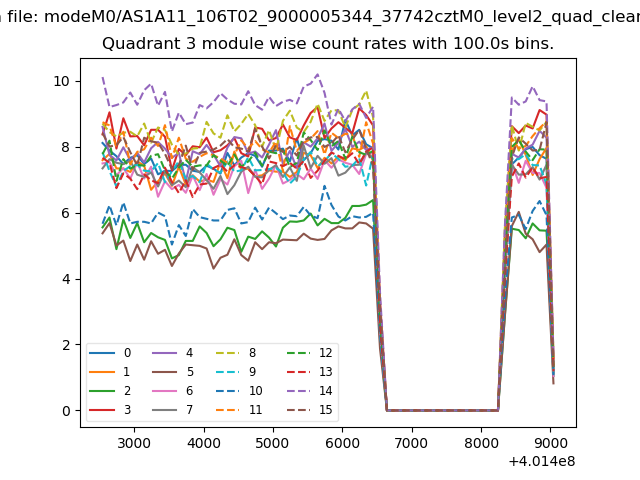
| Quadrant-wise count rates Data is divided into 100 sec bins |
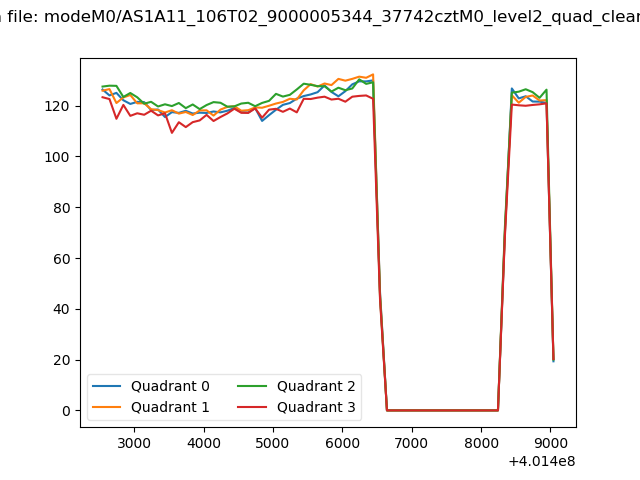 |
|
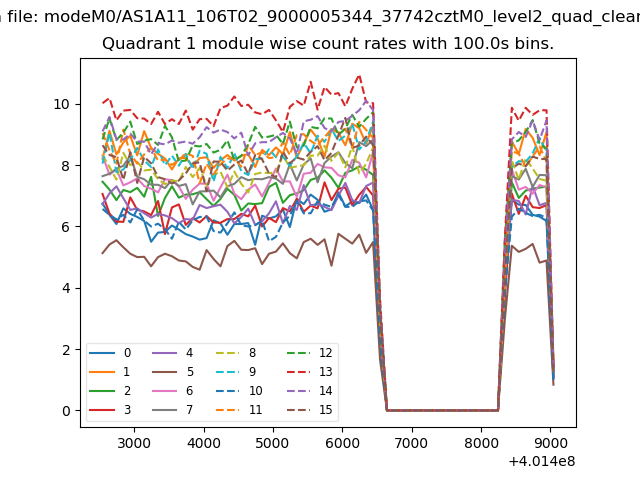
| Module-wise count rates for Quadrant A Data is divided into 100 sec bins |
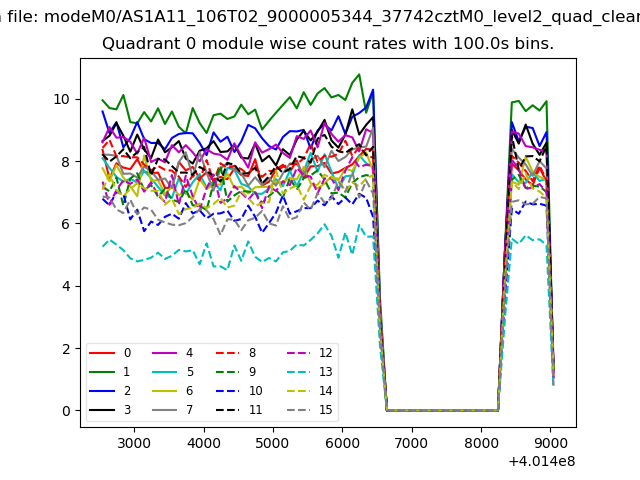 |
 |
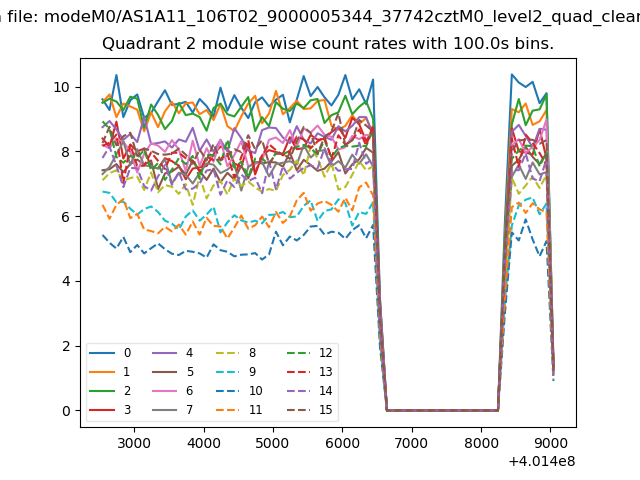
| Module-wise count rates for Quadrant B Data is divided into 100 sec bins |
 |
 |
| Module-wise count rates for Quadrant C Data is divided into 100 sec bins |
 |
 |
| Module-wise count rates for Quadrant D Data is divided into 100 sec bins |
 |
 |
| Parameter | Plot |
|---|---|
| CZT HV Monitor | 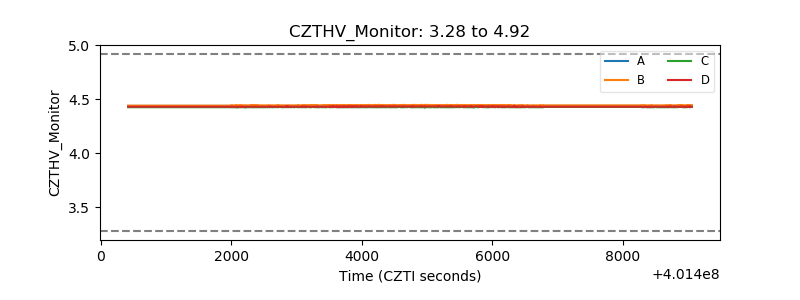 |
| D_VDD | 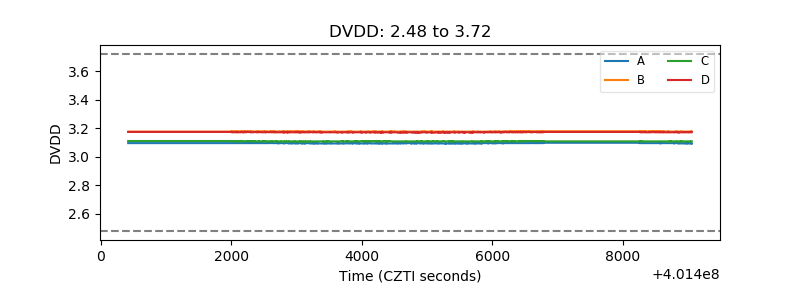 |
| Temperature 1 | 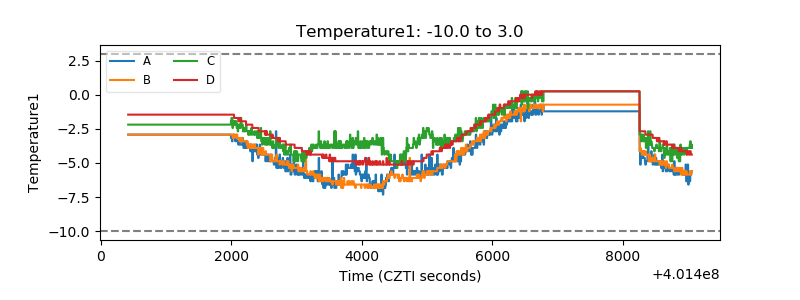 |
| Veto HV Monitor | 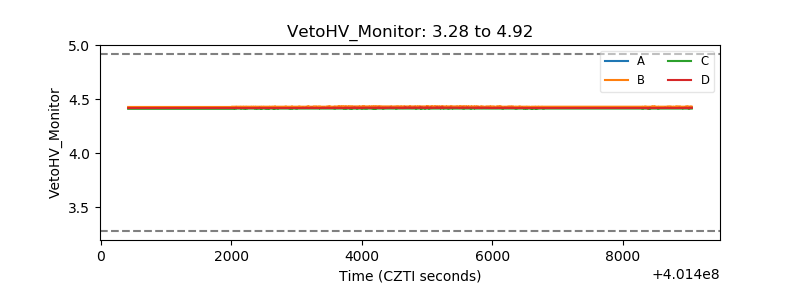 |
| Veto LLD | 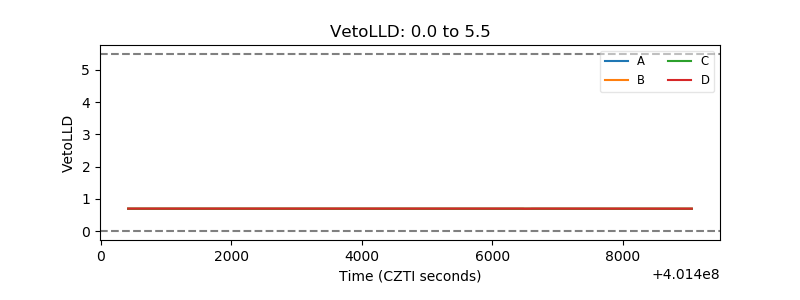 |
| Alpha Counter | 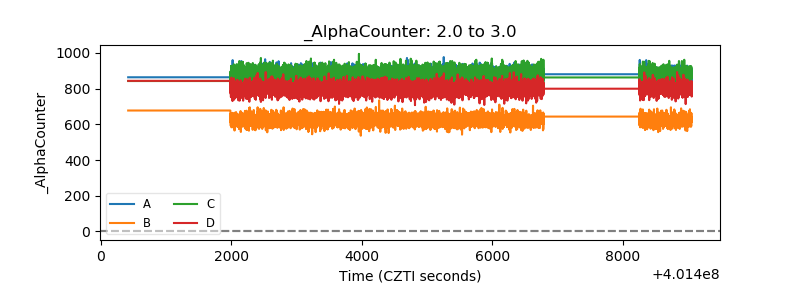 |
| _CPM_Rate | 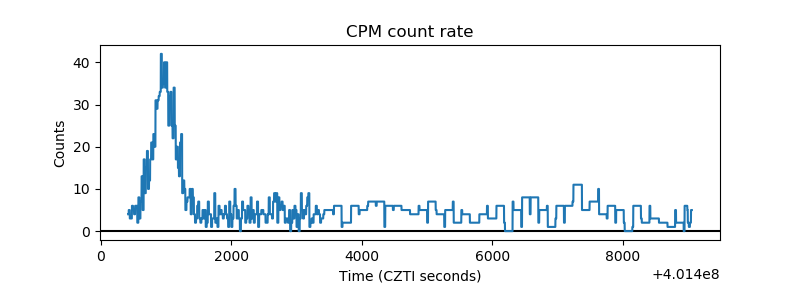 |
| CZT Counter | 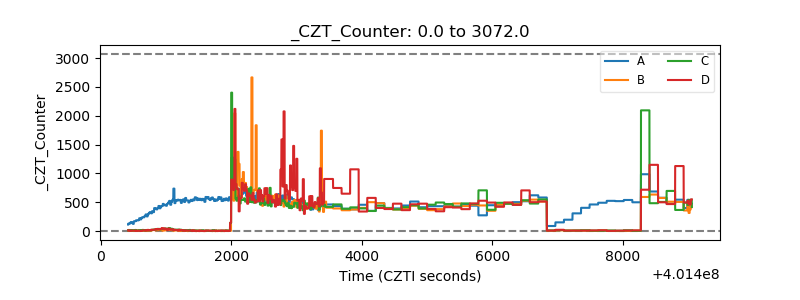 |
| +2.5 Volts monitor | 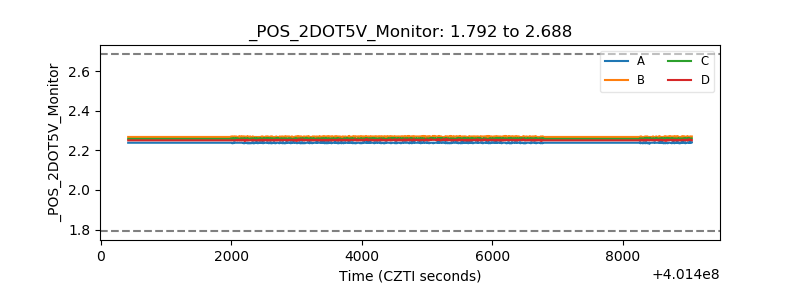 |
| +5 Volts monitor | 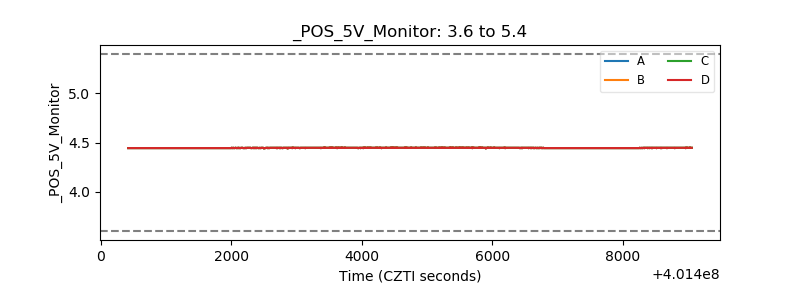 |
| _ROLL_ROT | 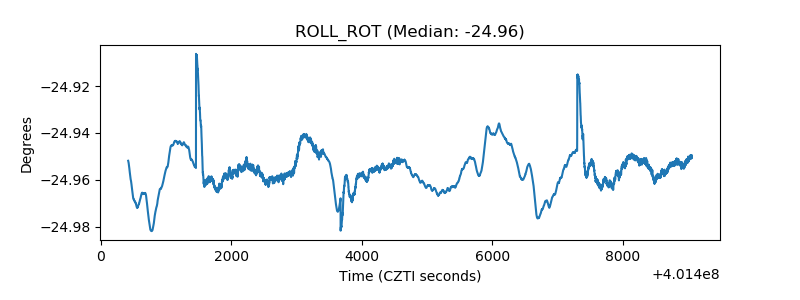 |
| _Roll_DEC | 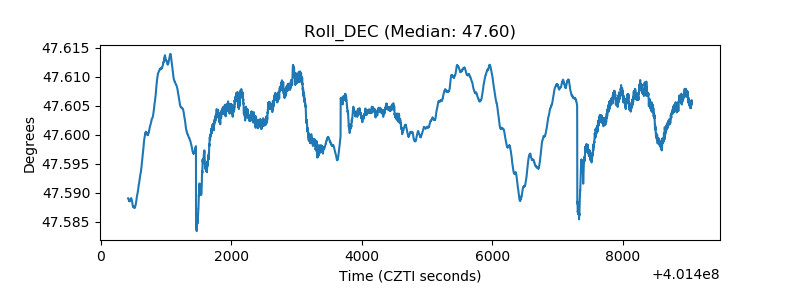 |
| _Roll_RA | 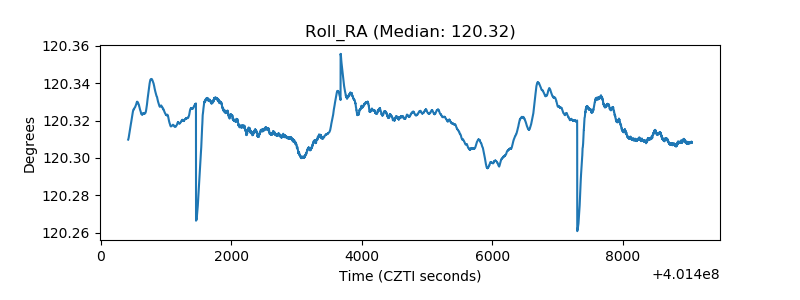 |
| Veto Counter | 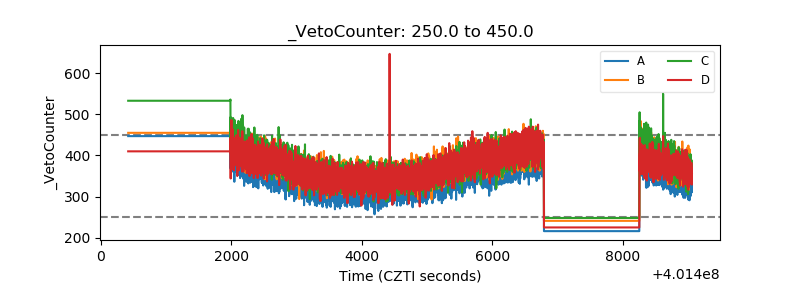 |