| Param | Original file | Final file |
|---|---|---|
| Filename | modeM0/AS1A11_106T02_9000005344_37743cztM0_level2.evt | modeM0/AS1A11_106T02_9000005344_37743cztM0_level2_quad_clean.evt |
| Size (bytes) | 458,458,560 | 95,336,640 |
| Size | 437.2 MB | 90.9 MB |
| Events in quadrant A | 3,409,727 | 610,700 |
| Events in quadrant B | 3,154,007 | 616,017 |
| Events in quadrant C | 3,083,420 | 626,118 |
| Events in quadrant D | 3,810,942 | 596,418 |
| Mode M9 | |||
|---|---|---|---|
| Quadrant | BADHDUFLAG | Total packets | Discarded packets |
| A | 0 | 29 | 0 |
| B | 0 | 29 | 0 |
| C | 0 | 29 | 0 |
| D | 0 | 29 | 0 |
| Mode SS | |||
|---|---|---|---|
| Quadrant | BADHDUFLAG | Total packets | Discarded packets |
| A | 0 | 128 | 0 |
| B | 0 | 128 | 0 |
| C | 0 | 128 | 0 |
| D | 0 | 128 | 0 |
| Mode M0 | |||
|---|---|---|---|
| Quadrant | BADHDUFLAG | Total packets | Discarded packets |
| A | 0 | 14270 | 3 |
| B | 0 | 13775 | 2 |
| C | 0 | 13126 | 2 |
| D | 0 | 15817 | 2 |
| Quadrant | Total seconds | Saturated seconds | Saturation percentage |
|---|---|---|---|
| A | 6282 | 67 | 1.066539% |
| B | 6282 | 47 | 0.748169% |
| C | 6282 | 43 | 0.684495% |
| D | 6282 | 166 | 2.642471% |
Noise dominated data is calculated using 1-second bins in cleaned event files. If a bin has >2000 counts, and if more than 50% of those come from <1% of pixels, then it is considered to be noise-dominated and hence unusable.
| Quadrant | # 1 sec bins | Bins with >0 counts | Bins with >2000 counts | High rate bins dominated by noise | Noise dominated (total time) | Noise dominated (detector-on time) | Marked lightcurve |
|---|---|---|---|---|---|---|---|
| A | 9056 | 6284 | 58 | 58 | 0.64% | 0.92% | 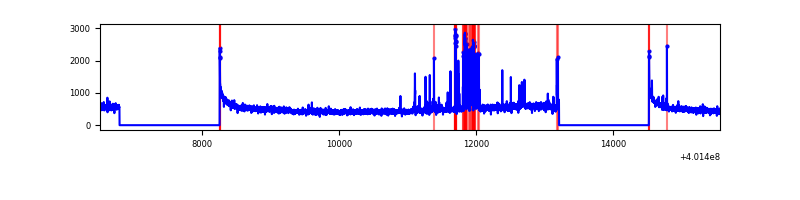 |
| B | 9056 | 6284 | 27 | 27 | 0.30% | 0.43% | 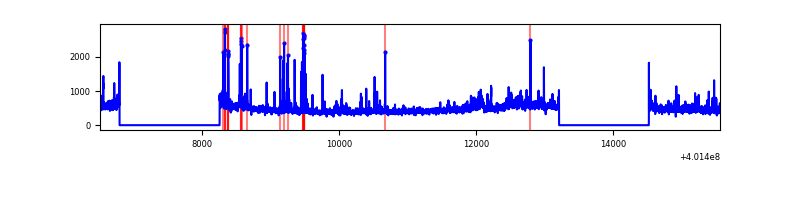 |
| C | 9056 | 6284 | 35 | 35 | 0.39% | 0.56% | 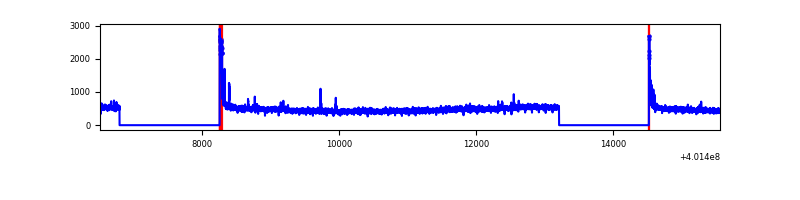 |
| D | 9056 | 6283 | 130 | 130 | 1.44% | 2.07% | 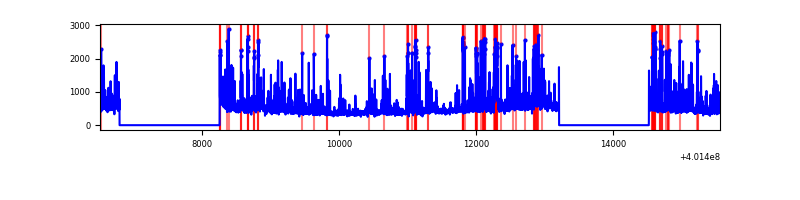 |
Top three noisy pixels from each quadrant. If the there are fewer than three noisy pixels in the level2.evt file, extra rows are filled as -1
| Pixel properties | Quadrant properties | ||||||
|---|---|---|---|---|---|---|---|
| Quadrant | DetID | PixID | Counts | Sigma | Mean | Median | Sigma |
| A | 10 | 83 | 363970 | 2564.82 | 696 | 683 | 141.6 |
| A | 7 | 16 | 296749 | 2090.24 | 696 | 683 | 141.6 |
| A | 13 | 6 | 20618 | 140.74 | 696 | 683 | 141.6 |
| B | 5 | 255 | 112697 | 839.66 | 691 | 671 | 133.4 |
| B | 0 | 189 | 102029 | 759.7 | 691 | 671 | 133.4 |
| B | 4 | 81 | 80322 | 597.0 | 691 | 671 | 133.4 |
| C | 15 | 214 | 265499 | 1659.26 | 681 | 687 | 159.6 |
| C | 0 | 10 | 133740 | 833.68 | 681 | 687 | 159.6 |
| C | 1 | 23 | 14984 | 89.58 | 681 | 687 | 159.6 |
| D | 2 | 249 | 634747 | 3856.31 | 678 | 659 | 164.4 |
| D | 2 | 153 | 177033 | 1072.65 | 678 | 659 | 164.4 |
| D | 5 | 222 | 114471 | 692.17 | 678 | 659 | 164.4 |
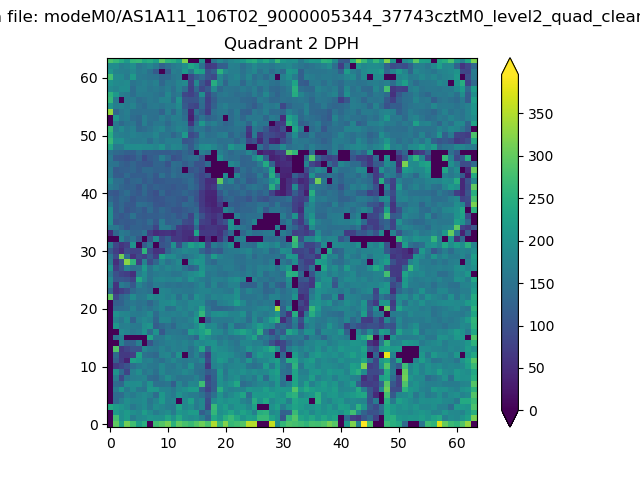
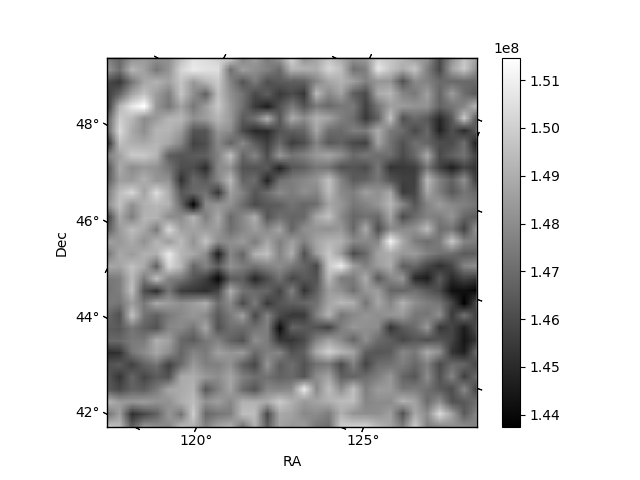
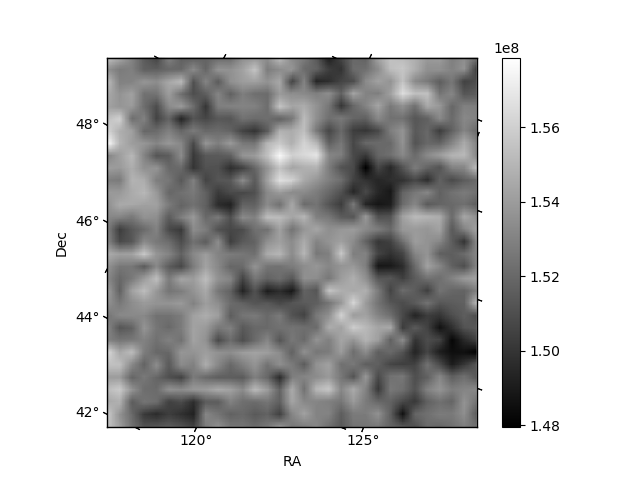
Histogram calculated using DETX and DETY for each event in the final _common_clean file
| Quadrant A | 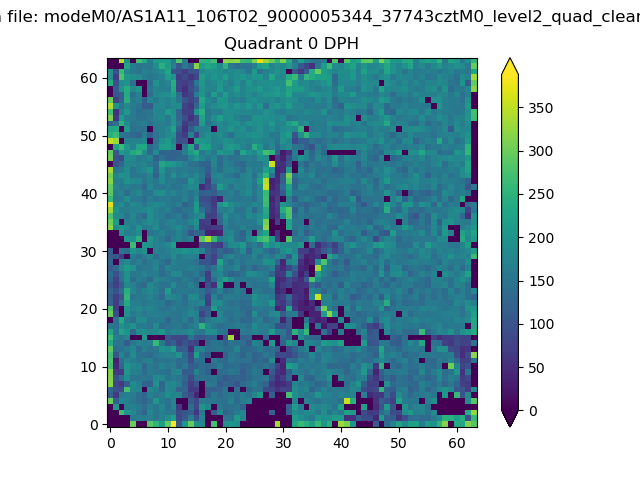 |
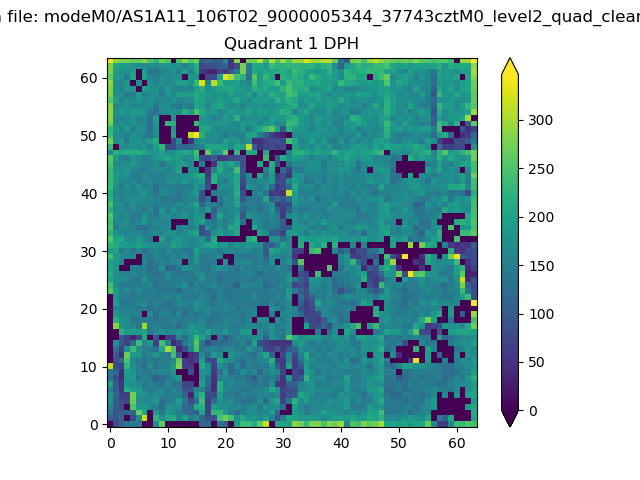 |
Quadrant B |
|---|---|---|---|
| Quadrant D | 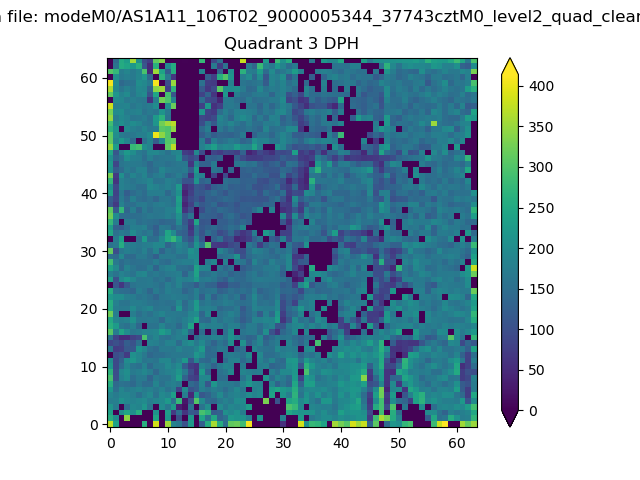 |
 |
Quadrant C |
| Plot type | Count rate plots | Images |
|---|---|---|
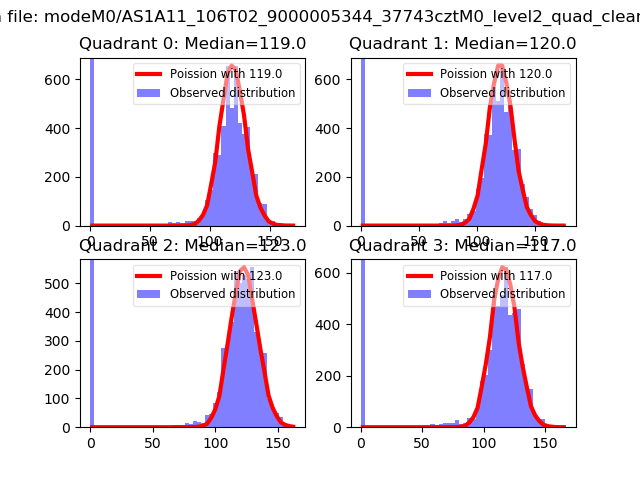
| Comparison with Poisson distribution Blue bars denote a histogram of data divided into 1 sec bins. Red curve is a Poisson curve with rate = median count rate of data. |
 |
 |
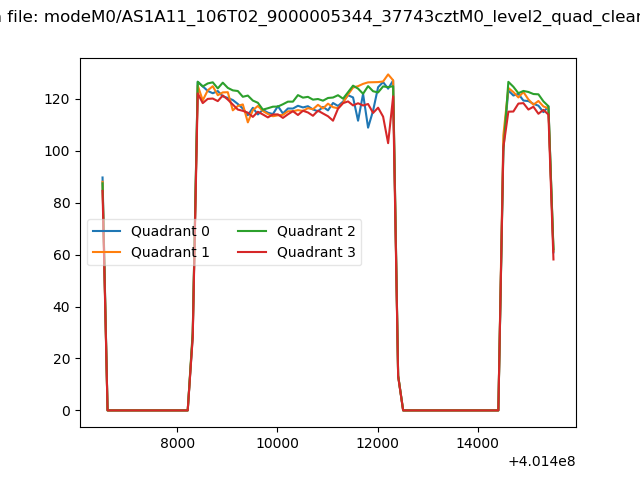
| Quadrant-wise count rates Data is divided into 100 sec bins |
 |
|
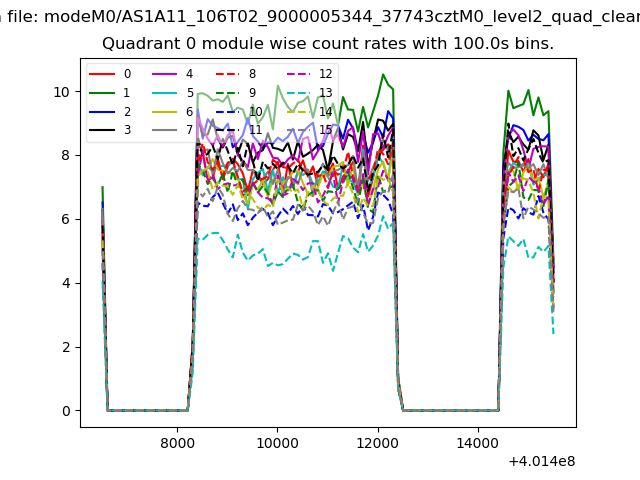
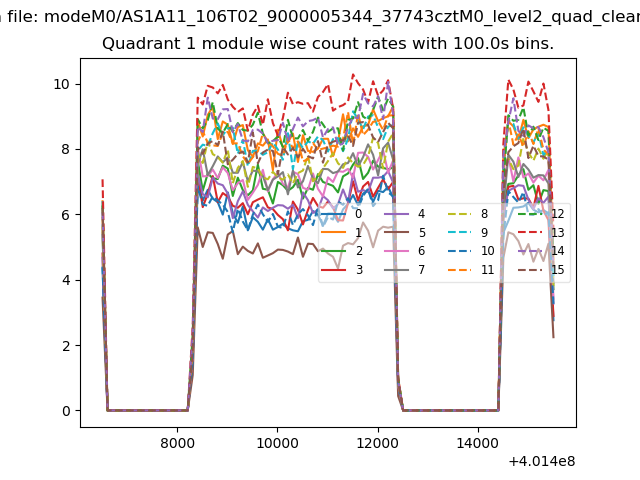
| Module-wise count rates for Quadrant A Data is divided into 100 sec bins |
 |
 |
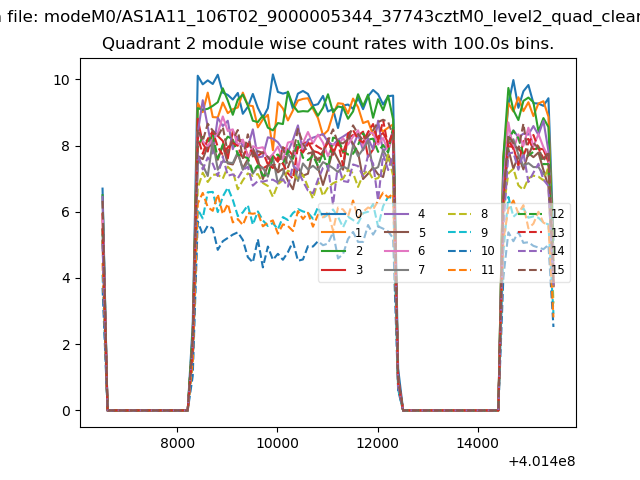
| Module-wise count rates for Quadrant B Data is divided into 100 sec bins |
 |
 |
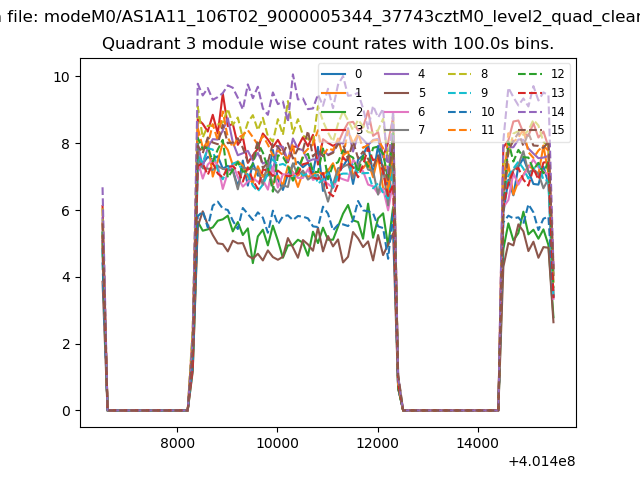
| Module-wise count rates for Quadrant C Data is divided into 100 sec bins |
 |
 |
| Module-wise count rates for Quadrant D Data is divided into 100 sec bins |
 |
 |
| Parameter | Plot |
|---|---|
| CZT HV Monitor | 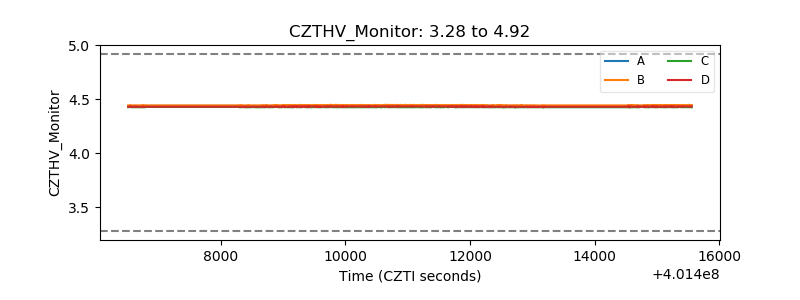 |
| D_VDD | 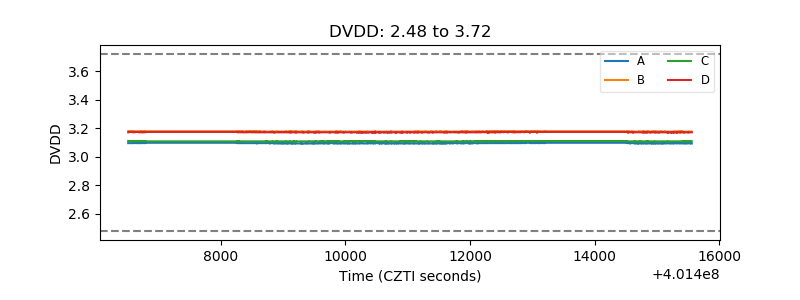 |
| Temperature 1 | 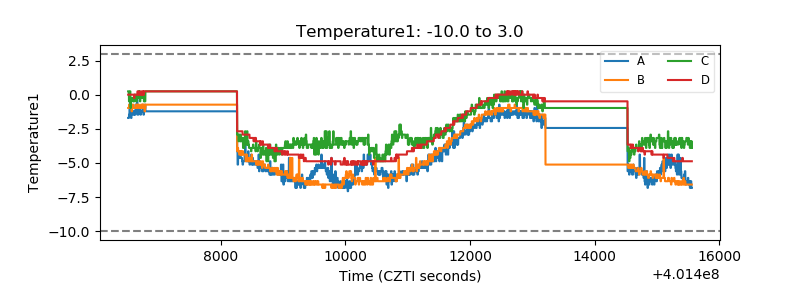 |
| Veto HV Monitor | 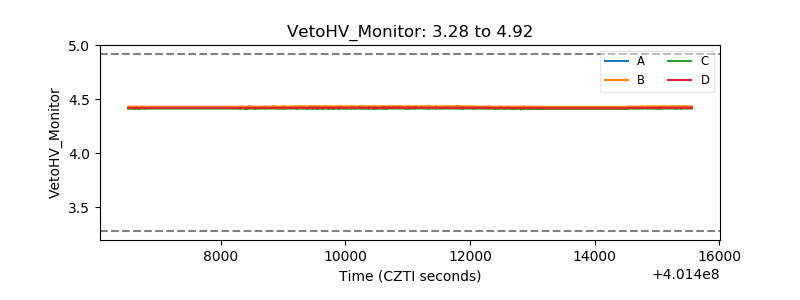 |
| Veto LLD | 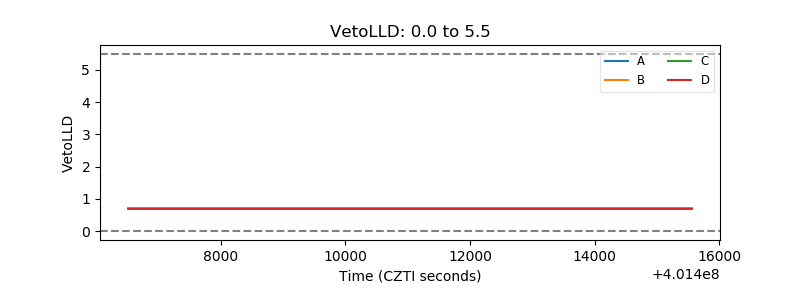 |
| Alpha Counter | 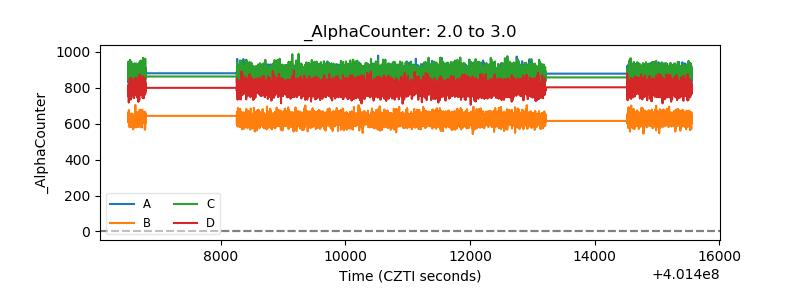 |
| _CPM_Rate | 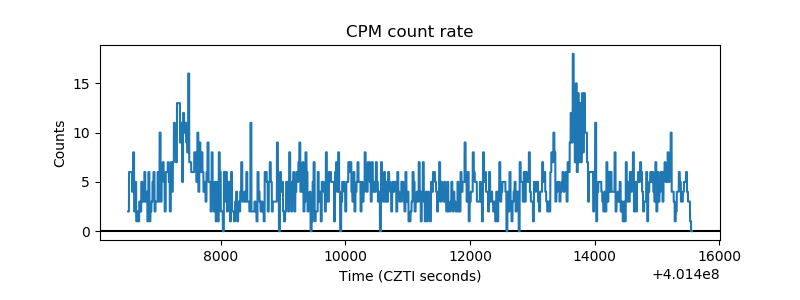 |
| CZT Counter | 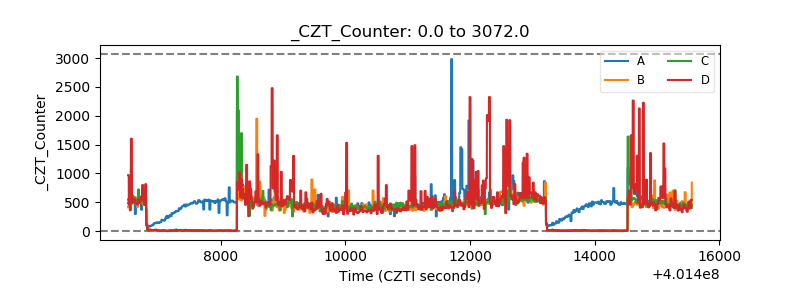 |
| +2.5 Volts monitor |  |
| +5 Volts monitor | 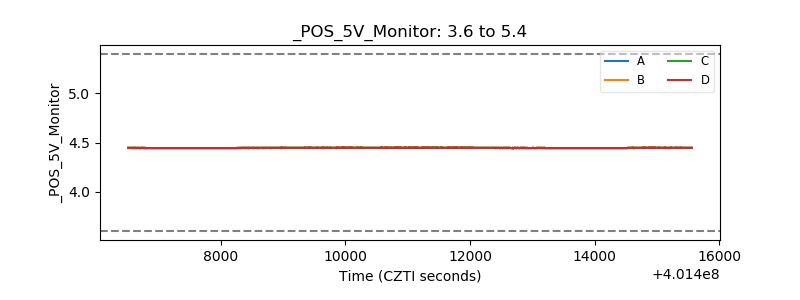 |
| _ROLL_ROT | 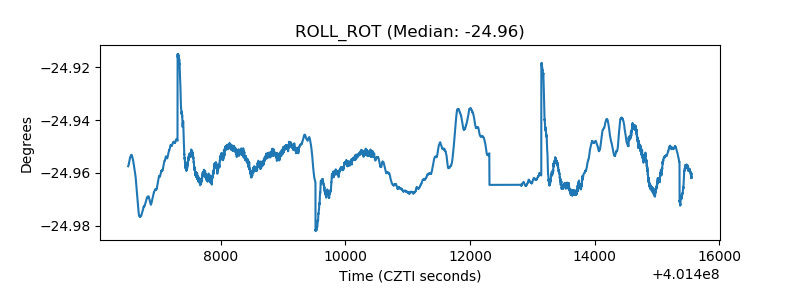 |
| _Roll_DEC | 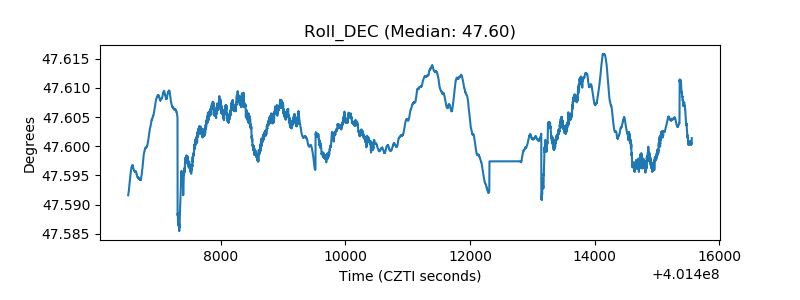 |
| _Roll_RA | 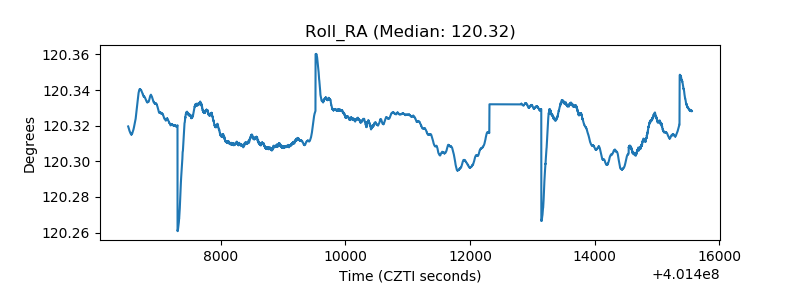 |
| Veto Counter | 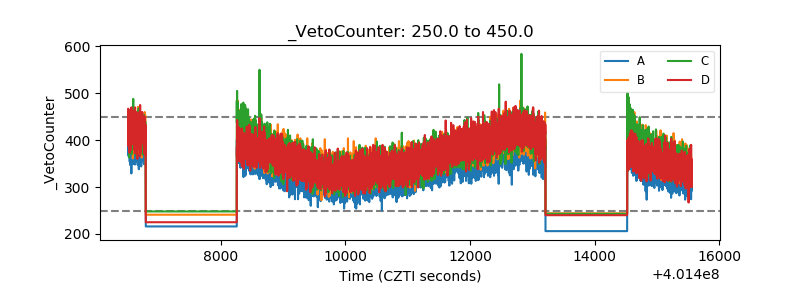 |