| Param | Original file | Final file |
|---|---|---|
| Filename | modeM0/AS1A11_106T02_9000005344_37746cztM0_level2.evt | modeM0/AS1A11_106T02_9000005344_37746cztM0_level2_quad_clean.evt |
| Size (bytes) | 1,231,125,120 | 203,489,280 |
| Size | 1.1 GB | 194.1 MB |
| Events in quadrant A | 7,880,870 | 1,281,273 |
| Events in quadrant B | 8,455,912 | 1,282,064 |
| Events in quadrant C | 7,706,419 | 1,301,573 |
| Events in quadrant D | 12,160,714 | 1,194,609 |
| Mode M9 | |||
|---|---|---|---|
| Quadrant | BADHDUFLAG | Total packets | Discarded packets |
| A | 0 | 56 | 0 |
| B | 0 | 56 | 0 |
| C | 0 | 56 | 0 |
| D | 0 | 56 | 0 |
| Mode SS | |||
|---|---|---|---|
| Quadrant | BADHDUFLAG | Total packets | Discarded packets |
| A | 0 | 326 | 0 |
| B | 0 | 326 | 0 |
| C | 0 | 326 | 0 |
| D | 0 | 326 | 0 |
| Mode M0 | |||
|---|---|---|---|
| Quadrant | BADHDUFLAG | Total packets | Discarded packets |
| A | 0 | 33726 | 5 |
| B | 0 | 36422 | 4 |
| C | 0 | 33242 | 4 |
| D | 0 | 47483 | 4 |
| Quadrant | Total seconds | Saturated seconds | Saturation percentage |
|---|---|---|---|
| A | 16003 | 19 | 0.118728% |
| B | 16003 | 420 | 2.624508% |
| C | 16003 | 51 | 0.318690% |
| D | 16003 | 1317 | 8.229707% |
Noise dominated data is calculated using 1-second bins in cleaned event files. If a bin has >2000 counts, and if more than 50% of those come from <1% of pixels, then it is considered to be noise-dominated and hence unusable.
| Quadrant | # 1 sec bins | Bins with >0 counts | Bins with >2000 counts | High rate bins dominated by noise | Noise dominated (total time) | Noise dominated (detector-on time) | Marked lightcurve |
|---|---|---|---|---|---|---|---|
| A | 21493 | 16007 | 11 | 11 | 0.05% | 0.07% | 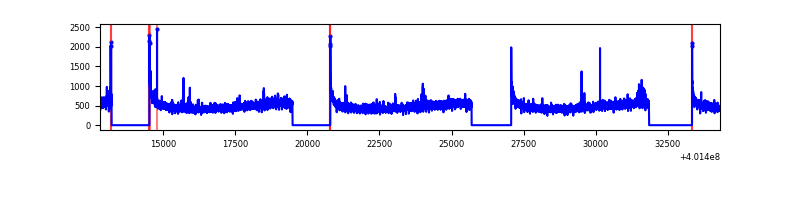 |
| B | 21493 | 16007 | 320 | 320 | 1.49% | 2.00% | 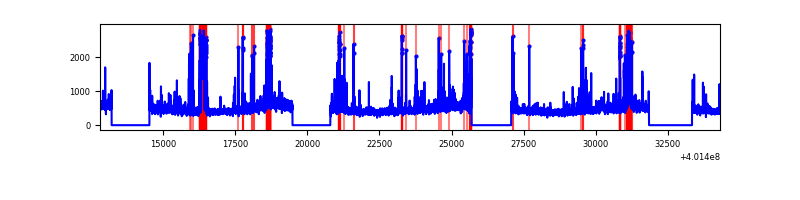 |
| C | 21493 | 16007 | 31 | 31 | 0.14% | 0.19% | 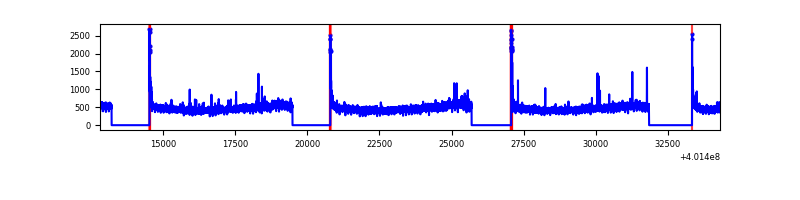 |
| D | 21493 | 16005 | 1206 | 1206 | 5.61% | 7.54% | 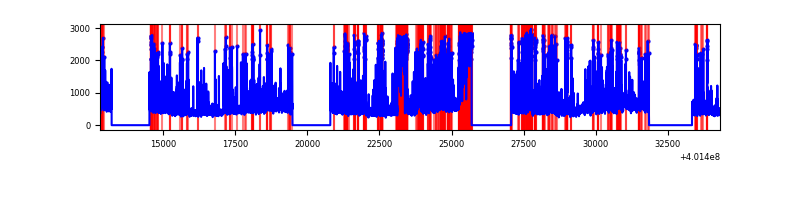 |
Top three noisy pixels from each quadrant. If the there are fewer than three noisy pixels in the level2.evt file, extra rows are filled as -1
| Pixel properties | Quadrant properties | ||||||
|---|---|---|---|---|---|---|---|
| Quadrant | DetID | PixID | Counts | Sigma | Mean | Median | Sigma |
| A | 10 | 83 | 862872 | 2438.27 | 1769 | 1737 | 353.2 |
| A | 15 | 222 | 41043 | 111.29 | 1769 | 1737 | 353.2 |
| A | 13 | 6 | 39793 | 107.75 | 1769 | 1737 | 353.2 |
| B | 5 | 255 | 917293 | 2776.93 | 1737 | 1689 | 329.7 |
| B | 5 | 172 | 167890 | 504.07 | 1737 | 1689 | 329.7 |
| B | 10 | 246 | 117479 | 351.18 | 1737 | 1689 | 329.7 |
| C | 15 | 214 | 679731 | 1702.33 | 1724 | 1736 | 398.3 |
| C | 0 | 10 | 190257 | 473.34 | 1724 | 1736 | 398.3 |
| C | 15 | 159 | 30210 | 71.49 | 1724 | 1736 | 398.3 |
| D | 2 | 249 | 2060217 | 5150.04 | 1649 | 1602 | 399.7 |
| D | 12 | 235 | 1655185 | 4136.77 | 1649 | 1602 | 399.7 |
| D | 2 | 250 | 635988 | 1587.04 | 1649 | 1602 | 399.7 |
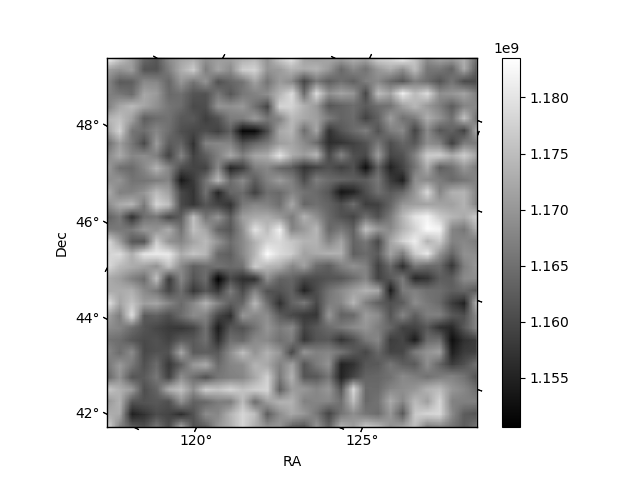
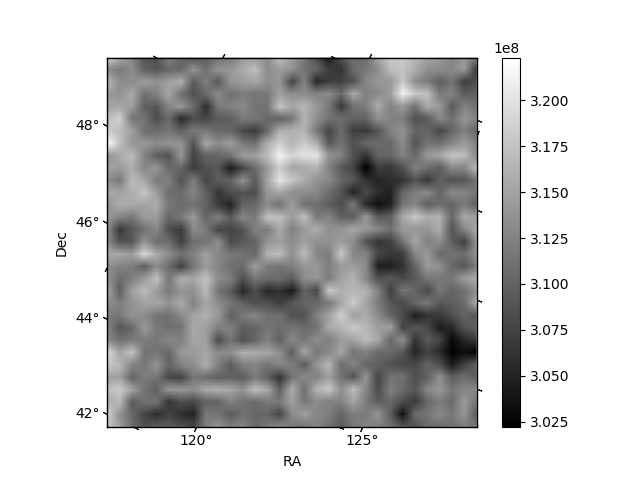
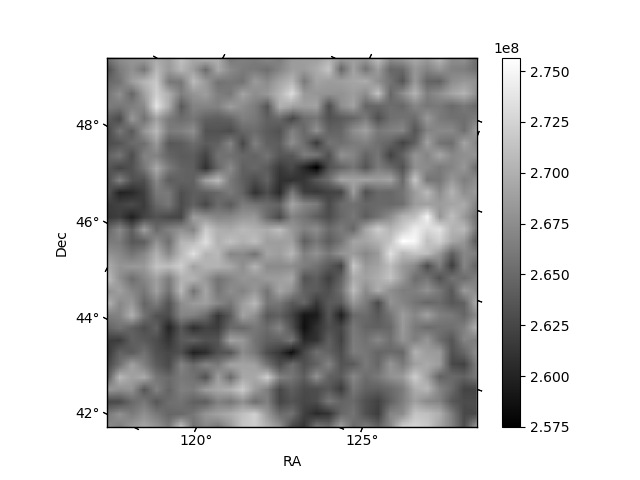
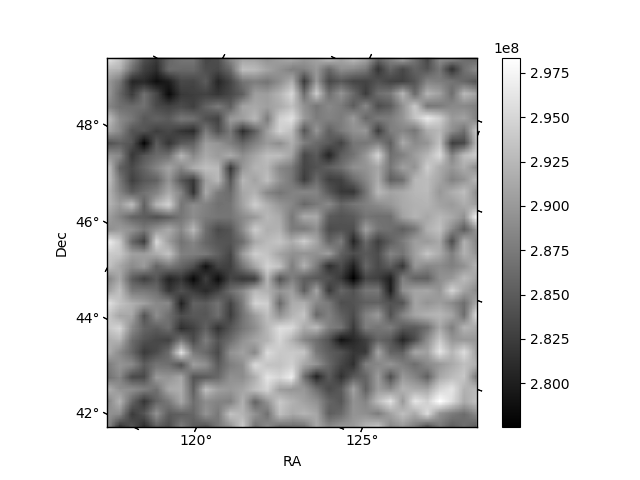
Histogram calculated using DETX and DETY for each event in the final _common_clean file
| Quadrant A | 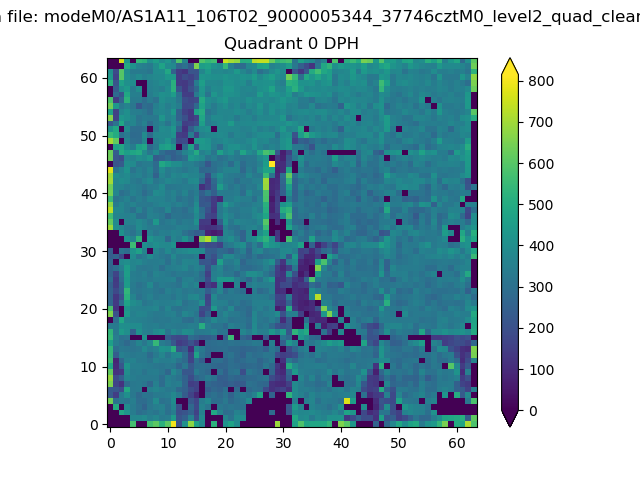 |
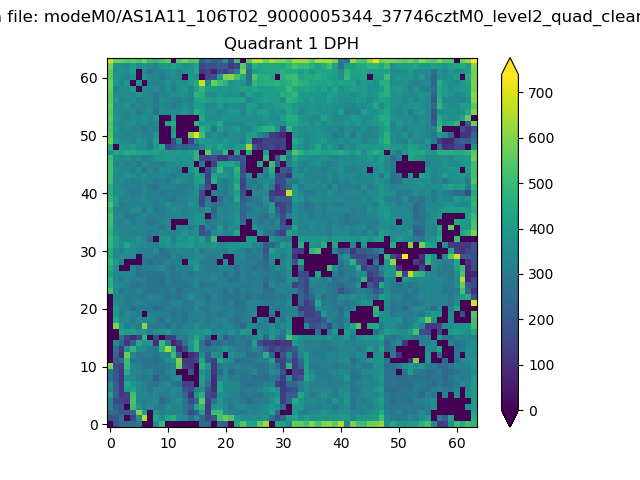 |
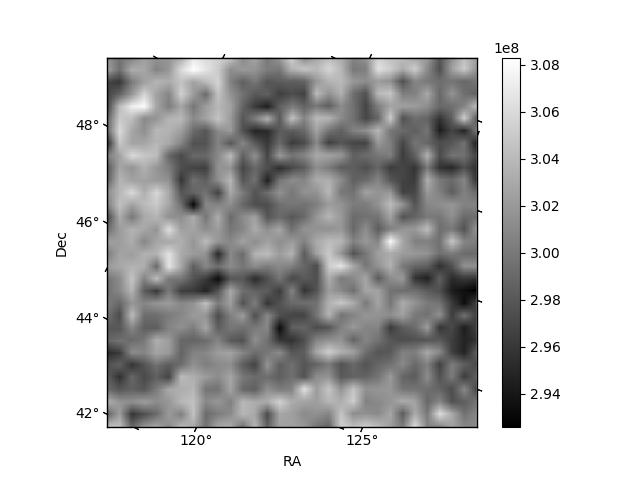
Quadrant B |
|---|---|---|---|
| Quadrant D | 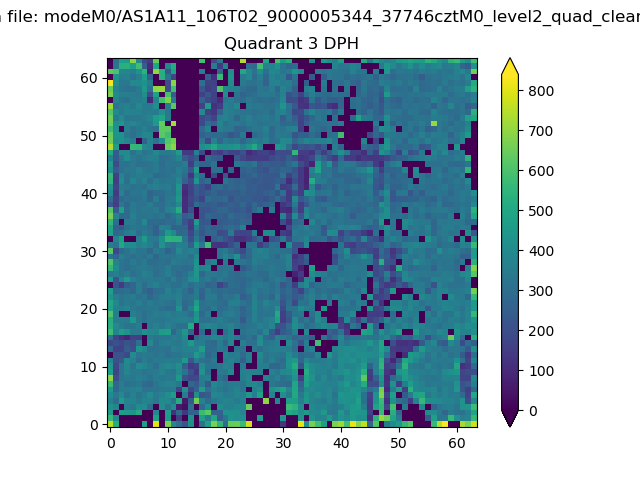 |
 |
Quadrant C |
| Plot type | Count rate plots | Images |
|---|---|---|
| Comparison with Poisson distribution Blue bars denote a histogram of data divided into 1 sec bins. Red curve is a Poisson curve with rate = median count rate of data. |
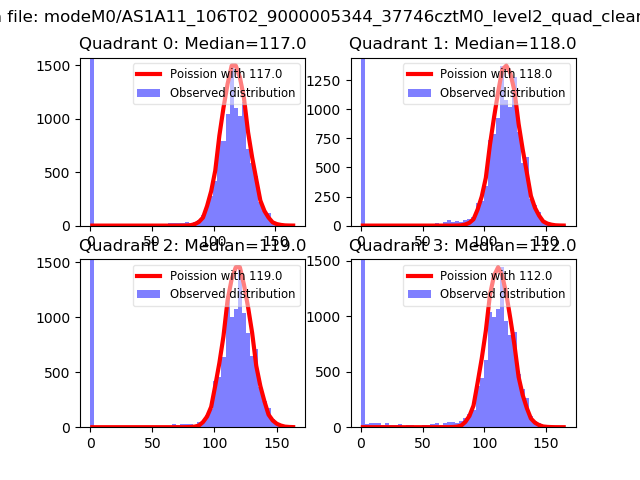 |
 |
| Quadrant-wise count rates Data is divided into 100 sec bins |
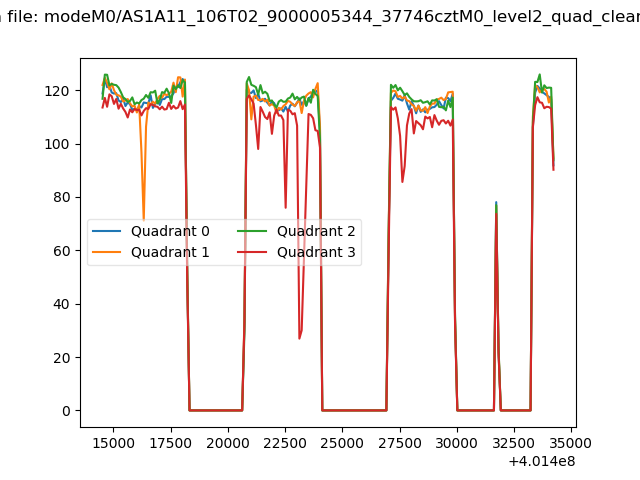 |
|
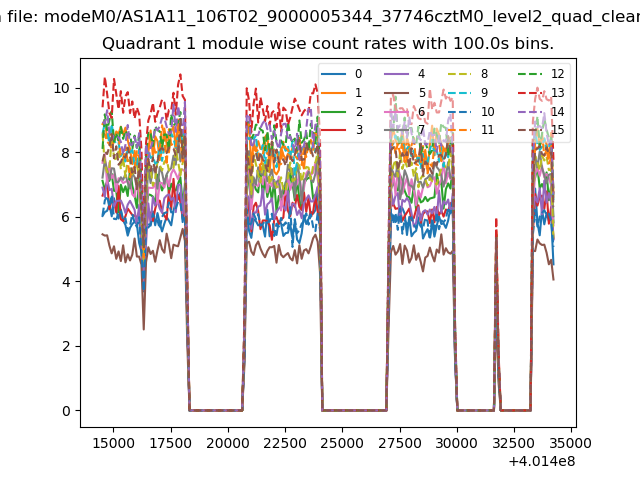
| Module-wise count rates for Quadrant A Data is divided into 100 sec bins |
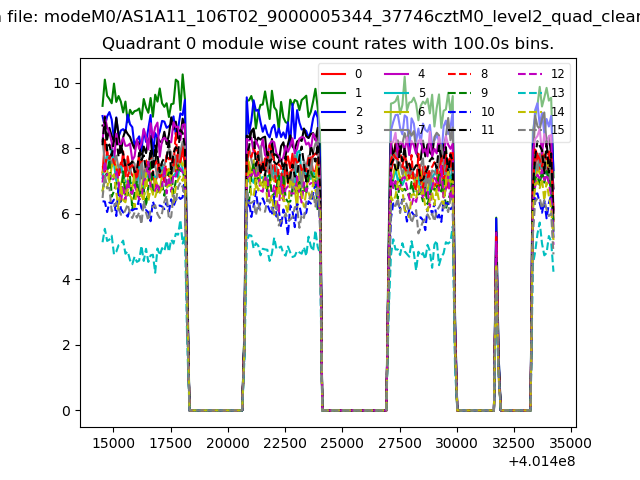 |
 |
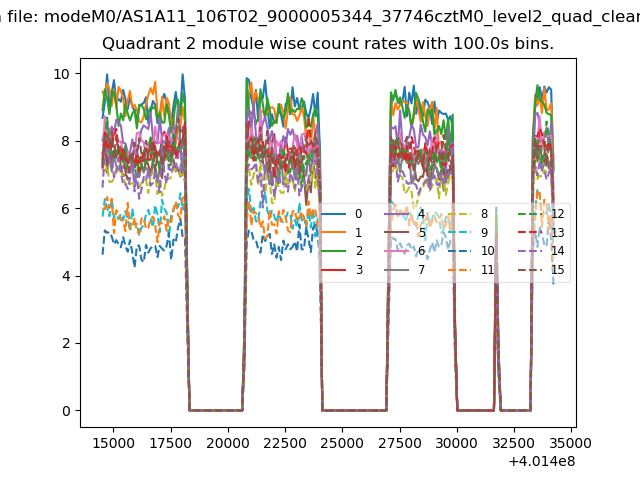
| Module-wise count rates for Quadrant B Data is divided into 100 sec bins |
 |
 |
| Module-wise count rates for Quadrant C Data is divided into 100 sec bins |
 |
 |
| Module-wise count rates for Quadrant D Data is divided into 100 sec bins |
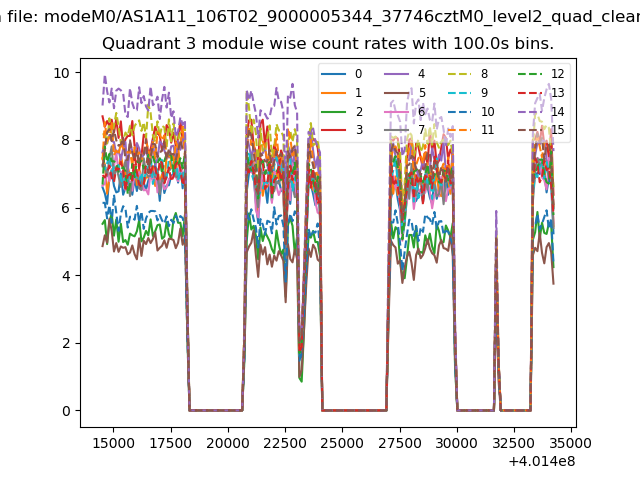 |
 |
| Parameter | Plot |
|---|---|
| CZT HV Monitor | 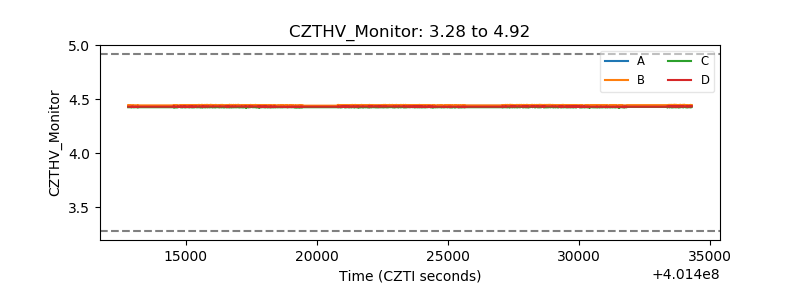 |
| D_VDD | 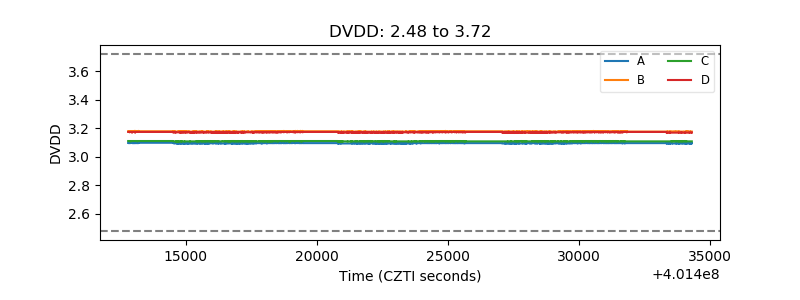 |
| Temperature 1 | 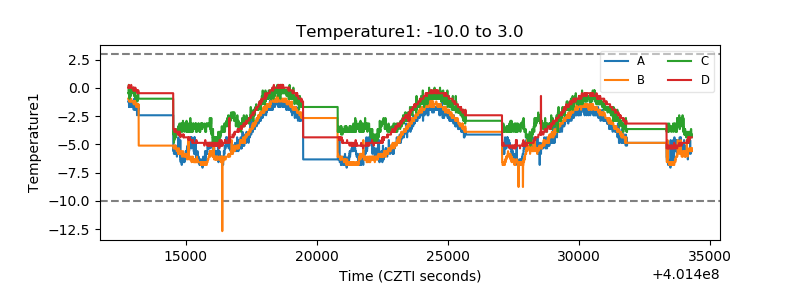 |
| Veto HV Monitor |  |
| Veto LLD | 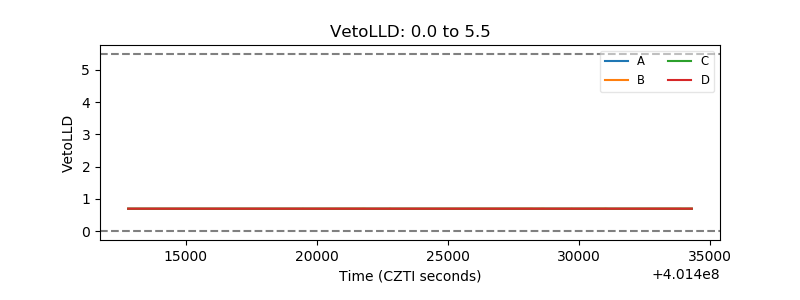 |
| Alpha Counter | 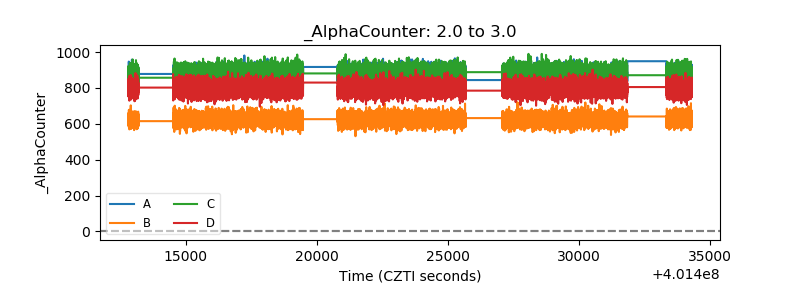 |
| _CPM_Rate | 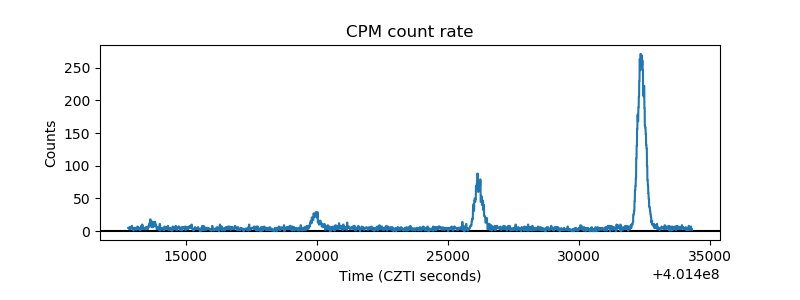 |
| CZT Counter | 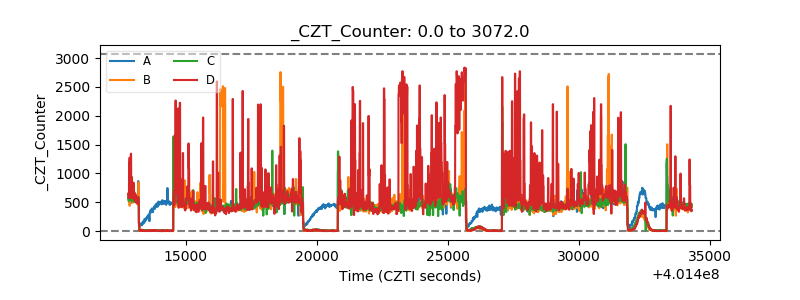 |
| +2.5 Volts monitor |  |
| +5 Volts monitor | 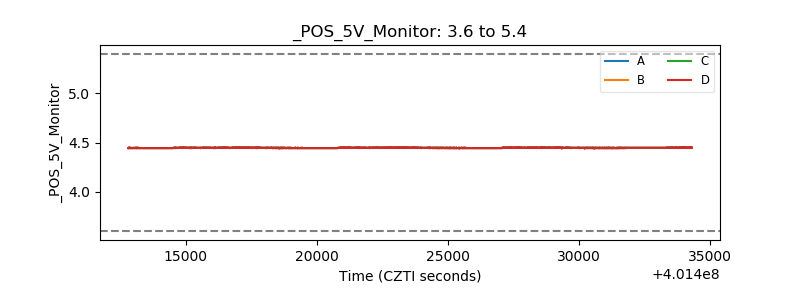 |
| _ROLL_ROT | 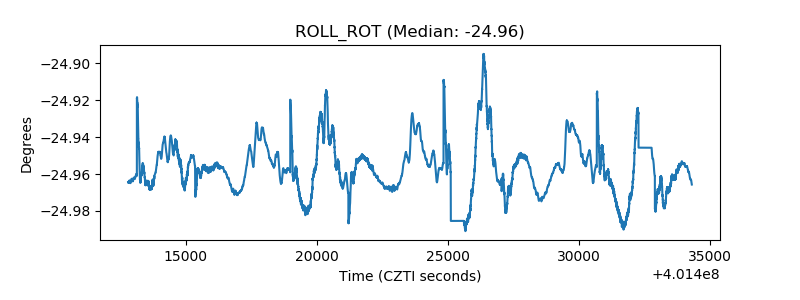 |
| _Roll_DEC | 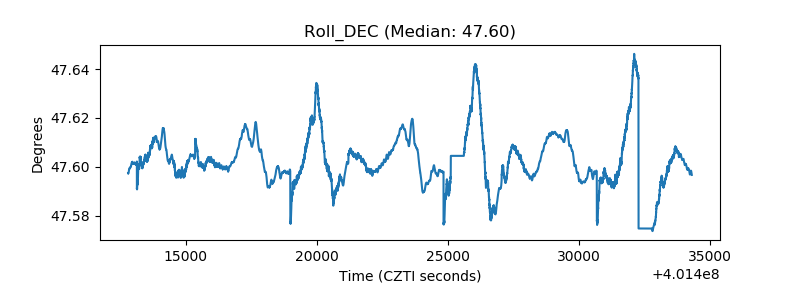 |
| _Roll_RA | 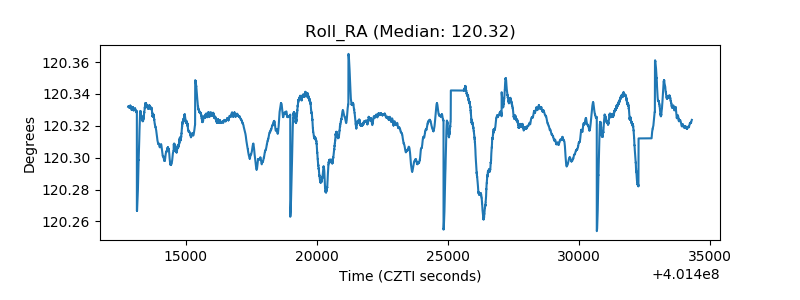 |
| Veto Counter | 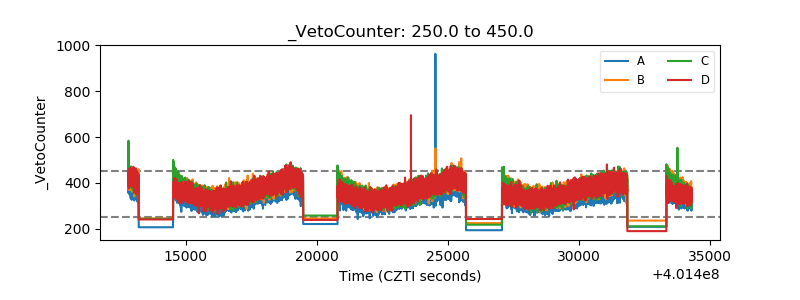 |