| Param | Original file | Final file |
|---|---|---|
| Filename | modeM0/AS1A11_106T02_9000005344_37749cztM0_level2.evt | modeM0/AS1A11_106T02_9000005344_37749cztM0_level2_quad_clean.evt |
| Size (bytes) | 421,479,360 | 69,762,240 |
| Size | 402.0 MB | 66.5 MB |
| Events in quadrant A | 3,104,272 | 437,794 |
| Events in quadrant B | 3,008,635 | 440,572 |
| Events in quadrant C | 2,736,529 | 442,933 |
| Events in quadrant D | 3,553,713 | 418,597 |
| Mode M9 | |||
|---|---|---|---|
| Quadrant | BADHDUFLAG | Total packets | Discarded packets |
| A | 0 | 17 | 0 |
| B | 0 | 17 | 0 |
| C | 0 | 17 | 0 |
| D | 0 | 17 | 0 |
| Mode SS | |||
|---|---|---|---|
| Quadrant | BADHDUFLAG | Total packets | Discarded packets |
| A | 0 | 110 | 0 |
| B | 0 | 110 | 0 |
| C | 0 | 110 | 0 |
| D | 0 | 110 | 0 |
| Mode M0 | |||
|---|---|---|---|
| Quadrant | BADHDUFLAG | Total packets | Discarded packets |
| A | 0 | 12548 | 2 |
| B | 0 | 12411 | 1 |
| C | 0 | 11282 | 1 |
| D | 0 | 14191 | 1 |
| Quadrant | Total seconds | Saturated seconds | Saturation percentage |
|---|---|---|---|
| A | 5311 | 8 | 0.150631% |
| B | 5311 | 219 | 4.123517% |
| C | 5311 | 41 | 0.771983% |
| D | 5311 | 216 | 4.067031% |
Noise dominated data is calculated using 1-second bins in cleaned event files. If a bin has >2000 counts, and if more than 50% of those come from <1% of pixels, then it is considered to be noise-dominated and hence unusable.
| Quadrant | # 1 sec bins | Bins with >0 counts | Bins with >2000 counts | High rate bins dominated by noise | Noise dominated (total time) | Noise dominated (detector-on time) | Marked lightcurve |
|---|---|---|---|---|---|---|---|
| A | 7044 | 5312 | 2 | 2 | 0.03% | 0.04% | 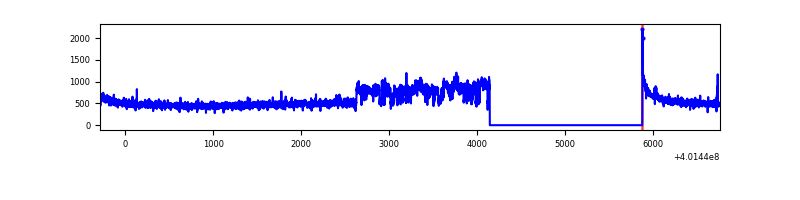 |
| B | 7044 | 5312 | 198 | 198 | 2.81% | 3.73% | 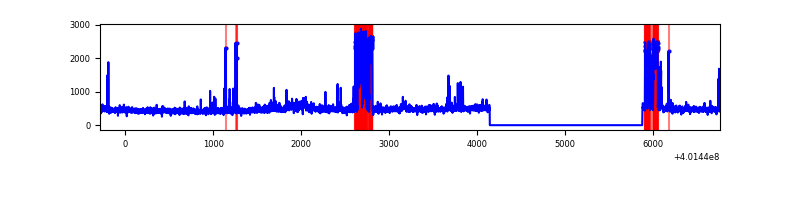 |
| C | 7044 | 5312 | 37 | 37 | 0.53% | 0.70% | 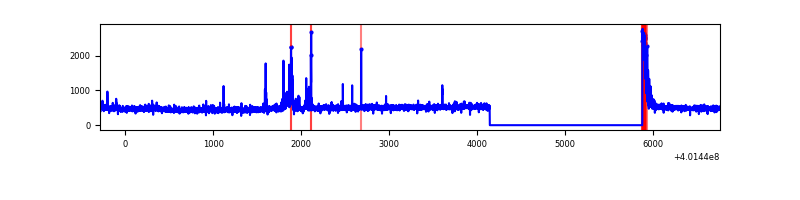 |
| D | 7044 | 5312 | 209 | 209 | 2.97% | 3.93% | 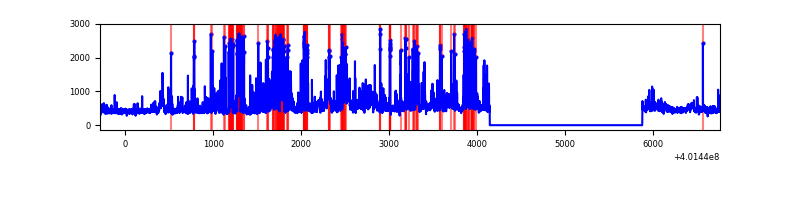 |
Top three noisy pixels from each quadrant. If the there are fewer than three noisy pixels in the level2.evt file, extra rows are filled as -1
| Pixel properties | Quadrant properties | ||||||
|---|---|---|---|---|---|---|---|
| Quadrant | DetID | PixID | Counts | Sigma | Mean | Median | Sigma |
| A | 6 | 10 | 448461 | 3719.96 | 602 | 590 | 120.4 |
| A | 10 | 83 | 290818 | 2410.6 | 602 | 590 | 120.4 |
| A | 13 | 6 | 20809 | 167.94 | 602 | 590 | 120.4 |
| B | 5 | 184 | 314562 | 2824.19 | 584 | 569 | 111.2 |
| B | 5 | 255 | 242065 | 2172.12 | 584 | 569 | 111.2 |
| B | 0 | 189 | 65360 | 582.76 | 584 | 569 | 111.2 |
| C | 15 | 214 | 228757 | 1675.42 | 582 | 585 | 136.2 |
| C | 0 | 10 | 111456 | 814.1 | 582 | 585 | 136.2 |
| C | 15 | 159 | 76209 | 555.29 | 582 | 585 | 136.2 |
| D | 2 | 249 | 549771 | 3925.09 | 577 | 562 | 139.9 |
| D | 2 | 250 | 184136 | 1311.97 | 577 | 562 | 139.9 |
| D | 13 | 249 | 146252 | 1041.22 | 577 | 562 | 139.9 |
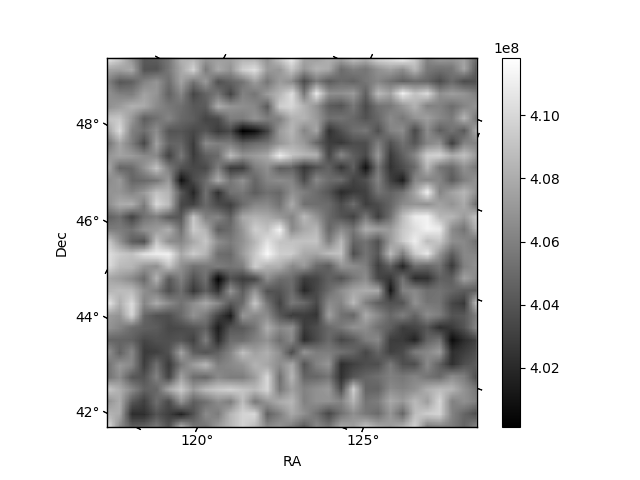
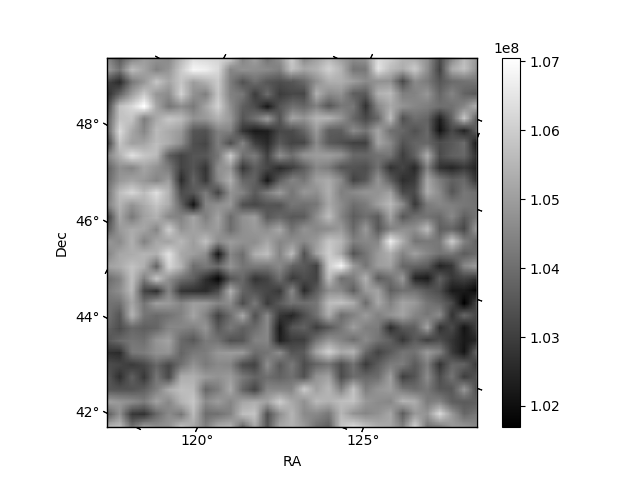
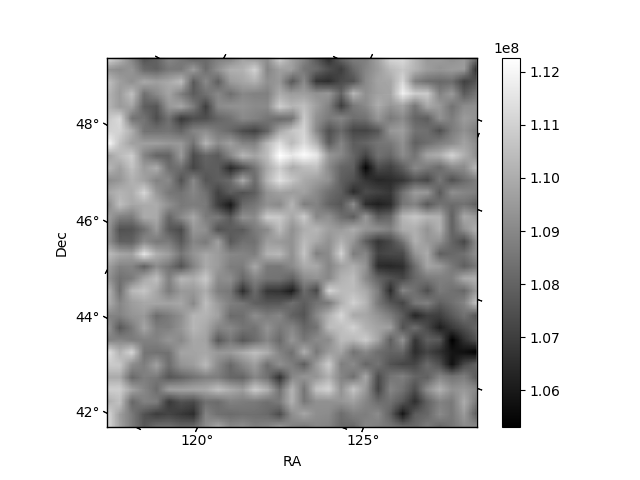
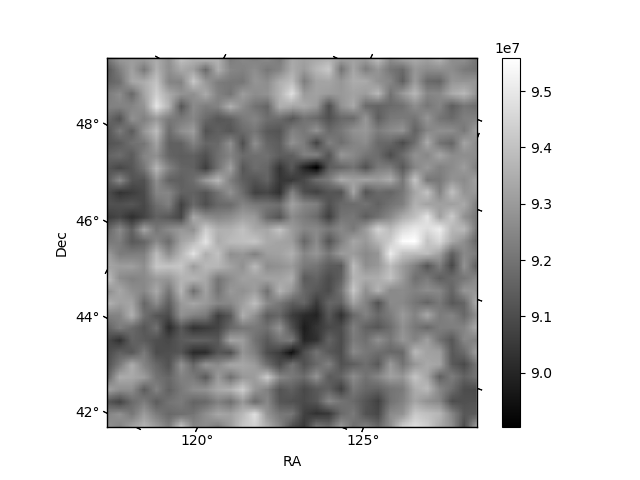
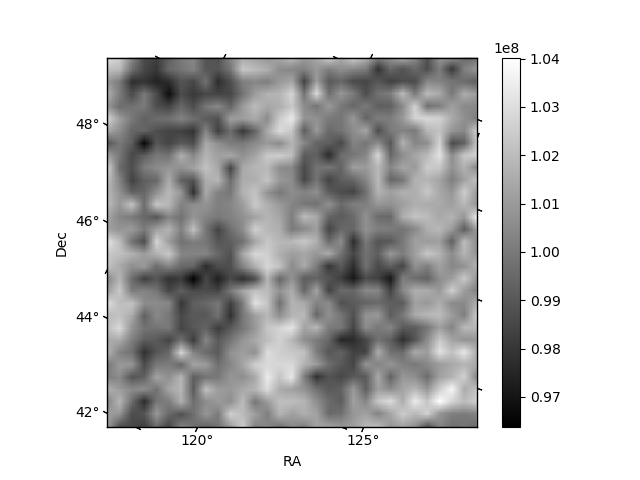
Histogram calculated using DETX and DETY for each event in the final _common_clean file
| Quadrant A | 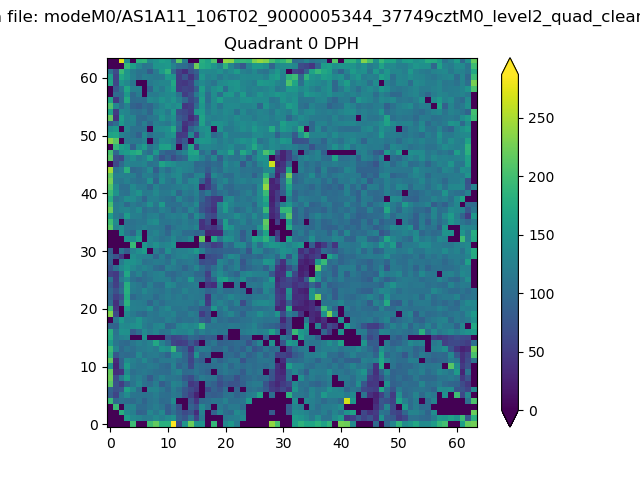 |
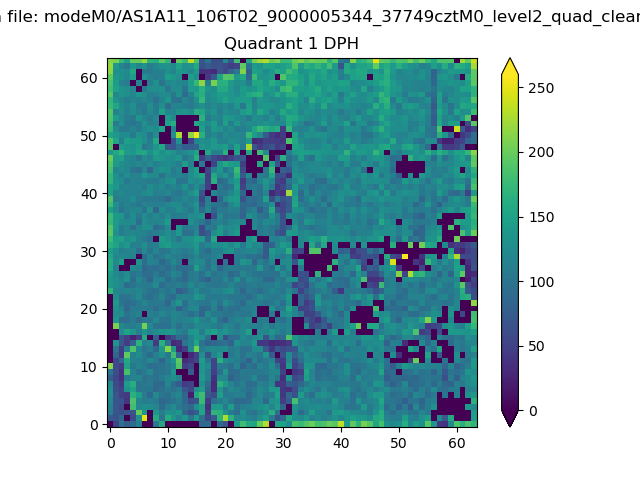 |
Quadrant B |
|---|---|---|---|
| Quadrant D | 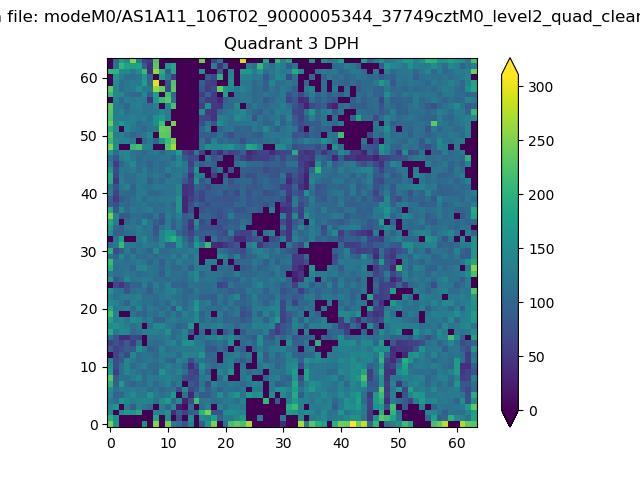 |
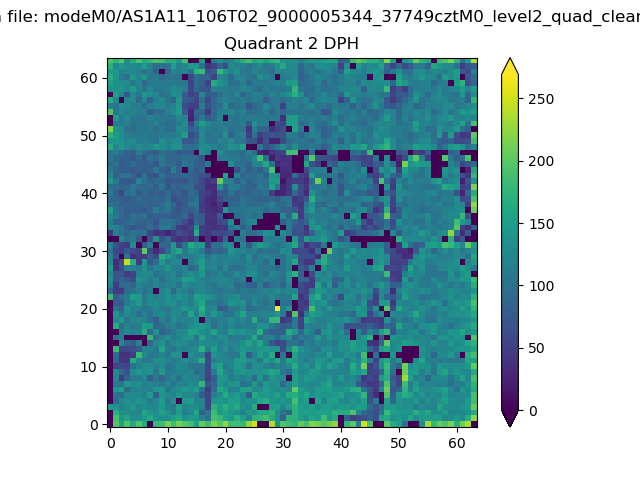 |
Quadrant C |
| Plot type | Count rate plots | Images |
|---|---|---|
| Comparison with Poisson distribution Blue bars denote a histogram of data divided into 1 sec bins. Red curve is a Poisson curve with rate = median count rate of data. |
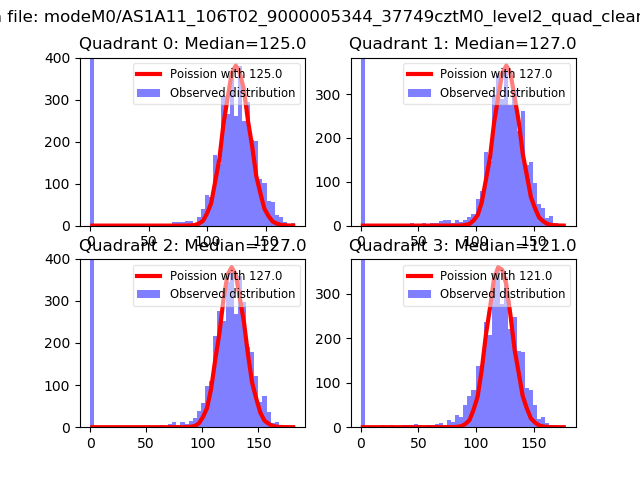 |
 |
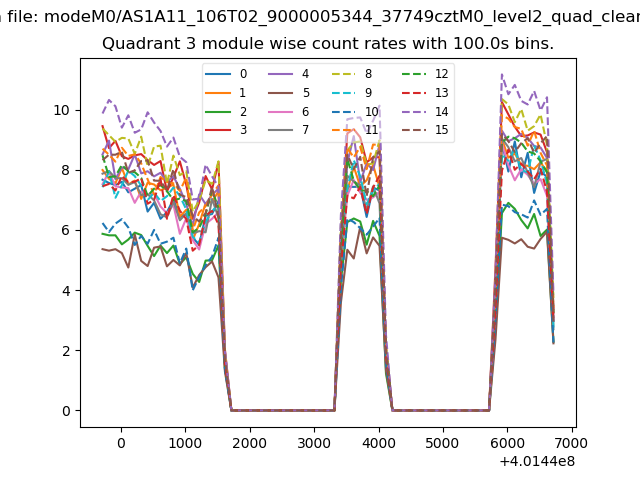
| Quadrant-wise count rates Data is divided into 100 sec bins |
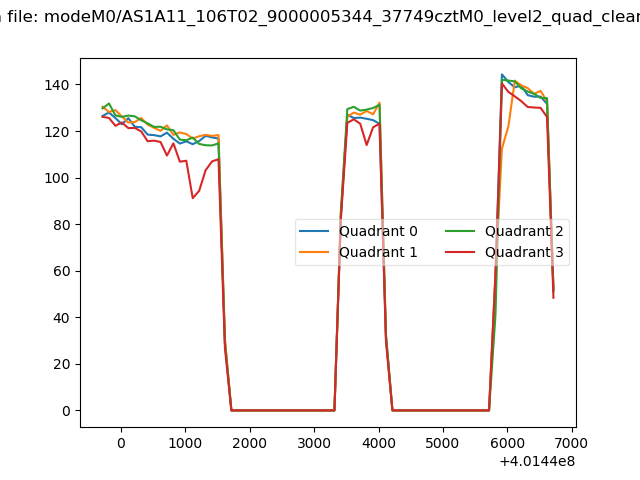 |
|
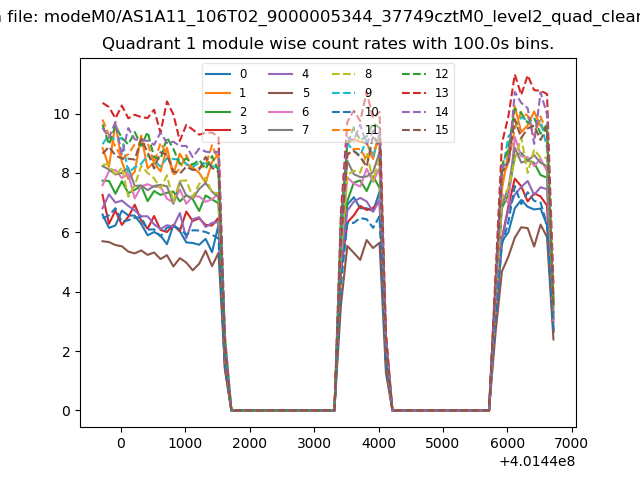
| Module-wise count rates for Quadrant A Data is divided into 100 sec bins |
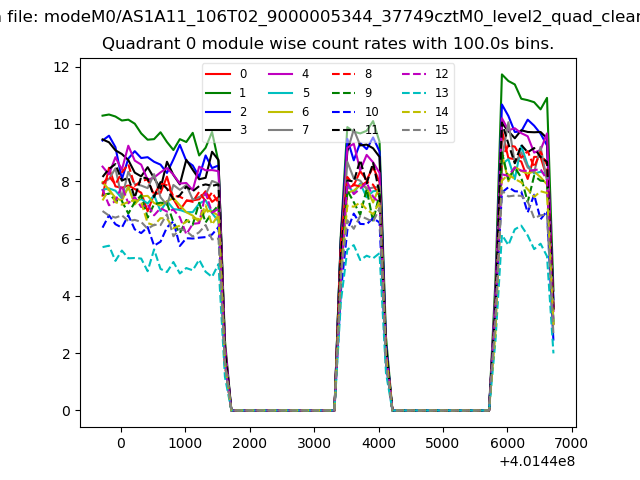 |
 |
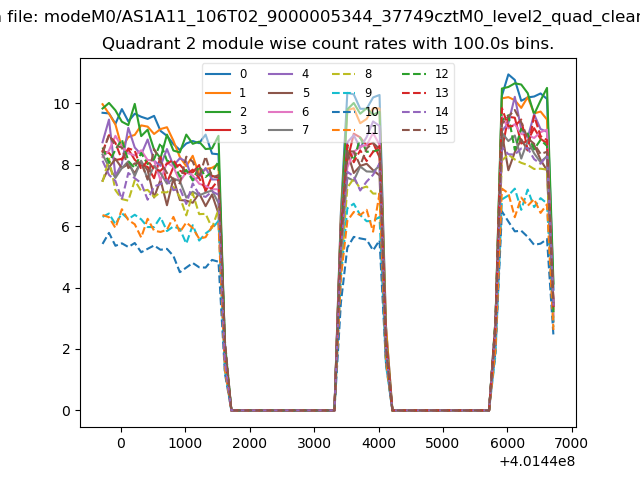
| Module-wise count rates for Quadrant B Data is divided into 100 sec bins |
 |
 |
| Module-wise count rates for Quadrant C Data is divided into 100 sec bins |
 |
 |
| Module-wise count rates for Quadrant D Data is divided into 100 sec bins |
 |
 |
| Parameter | Plot |
|---|---|
| CZT HV Monitor | 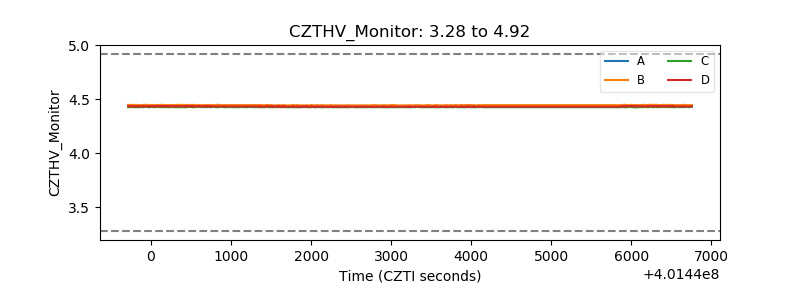 |
| D_VDD | 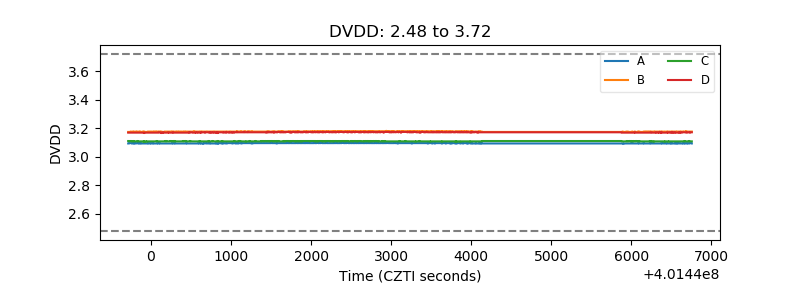 |
| Temperature 1 | 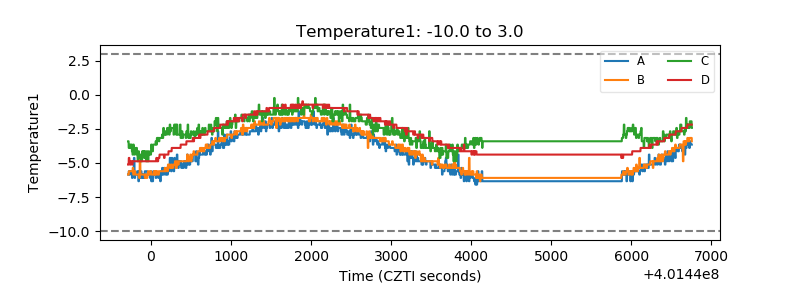 |
| Veto HV Monitor | 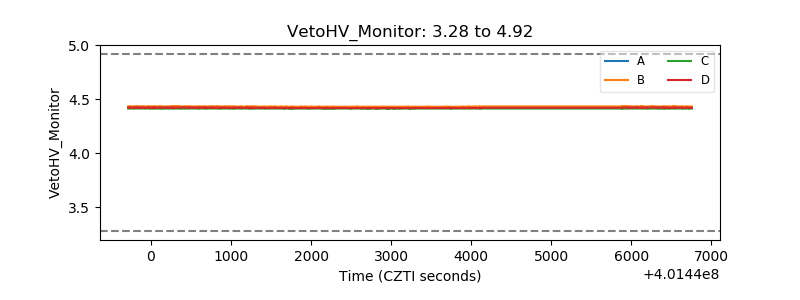 |
| Veto LLD | 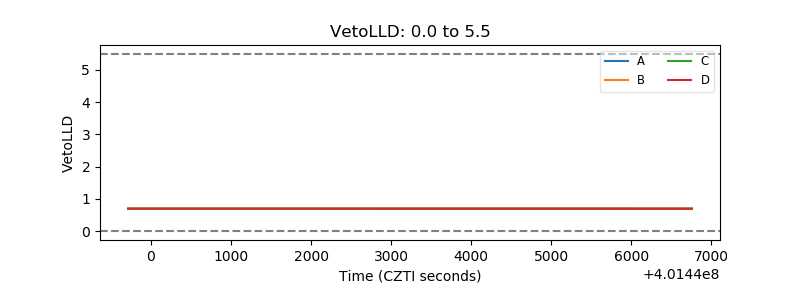 |
| Alpha Counter | 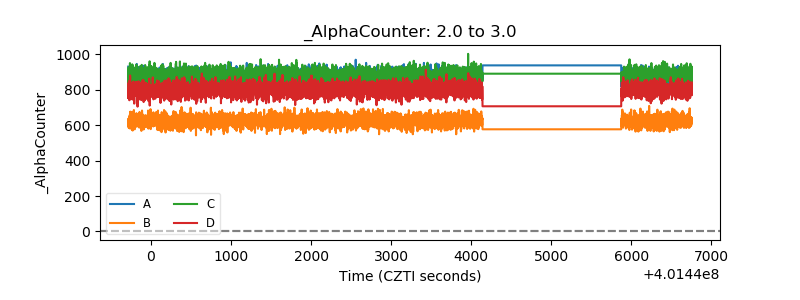 |
| _CPM_Rate | 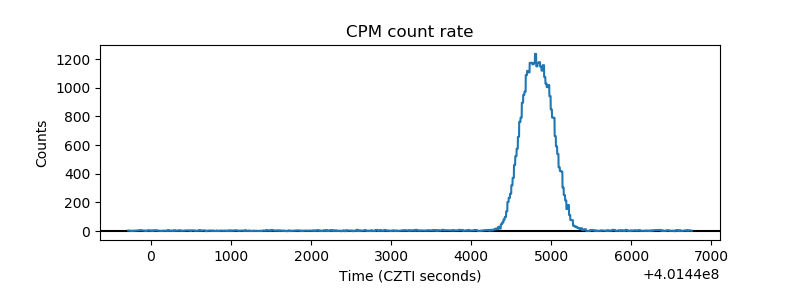 |
| CZT Counter | 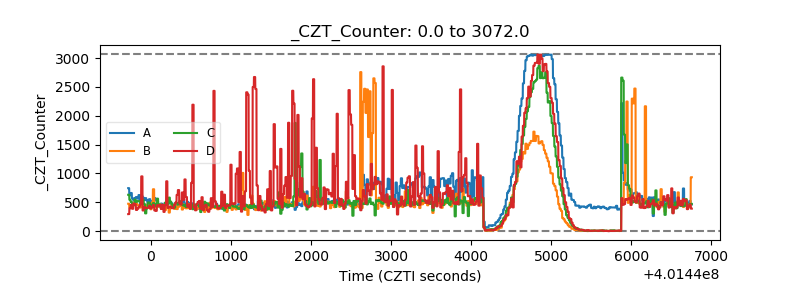 |
| +2.5 Volts monitor |  |
| +5 Volts monitor | 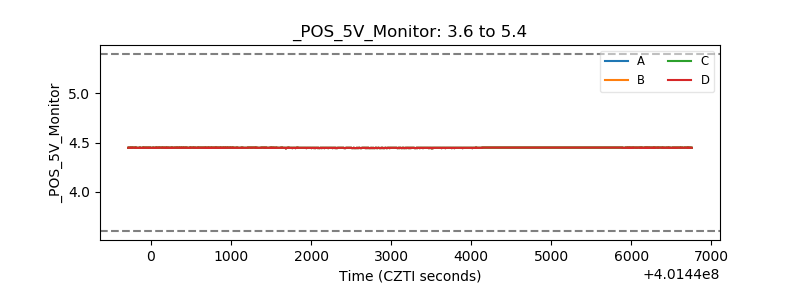 |
| _ROLL_ROT | 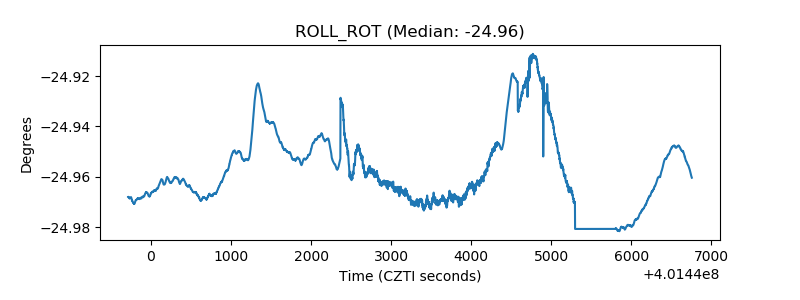 |
| _Roll_DEC | 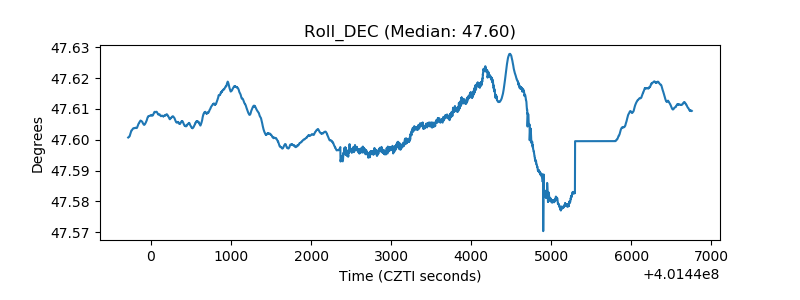 |
| _Roll_RA | 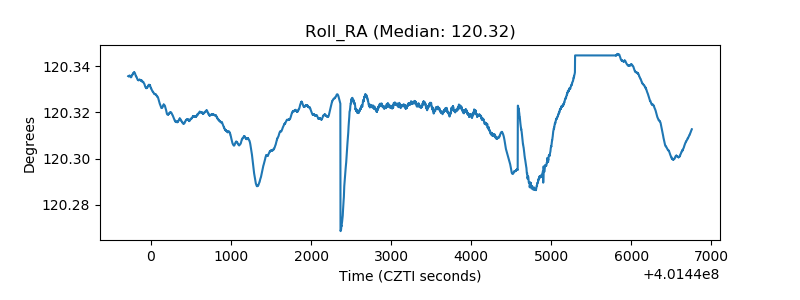 |
| Veto Counter | 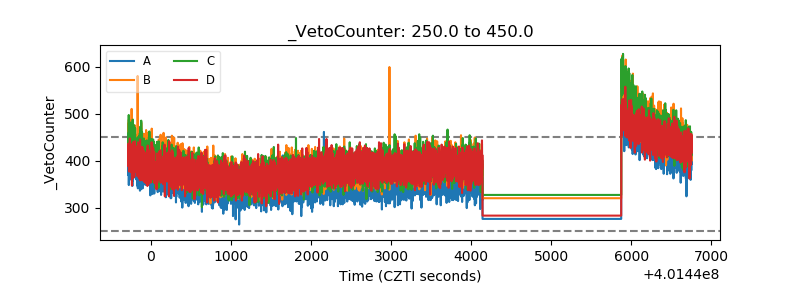 |