| Param | Original file | Final file |
|---|---|---|
| Filename | modeM0/AS1A11_106T02_9000005344_37750cztM0_level2.evt | modeM0/AS1A11_106T02_9000005344_37750cztM0_level2_quad_clean.evt |
| Size (bytes) | 442,756,800 | 73,258,560 |
| Size | 422.2 MB | 69.9 MB |
| Events in quadrant A | 2,862,777 | 472,042 |
| Events in quadrant B | 2,915,232 | 470,068 |
| Events in quadrant C | 2,842,971 | 468,041 |
| Events in quadrant D | 4,430,093 | 438,938 |
| Mode M9 | |||
|---|---|---|---|
| Quadrant | BADHDUFLAG | Total packets | Discarded packets |
| A | 0 | 18 | 0 |
| B | 0 | 18 | 0 |
| C | 0 | 18 | 0 |
| D | 0 | 19 | 0 |
| Mode SS | |||
|---|---|---|---|
| Quadrant | BADHDUFLAG | Total packets | Discarded packets |
| A | 0 | 108 | 0 |
| B | 0 | 108 | 0 |
| C | 0 | 108 | 0 |
| D | 0 | 108 | 0 |
| Mode M0 | |||
|---|---|---|---|
| Quadrant | BADHDUFLAG | Total packets | Discarded packets |
| A | 0 | 11580 | 3 |
| B | 0 | 11890 | 2 |
| C | 0 | 11398 | 2 |
| D | 0 | 16651 | 2 |
| Quadrant | Total seconds | Saturated seconds | Saturation percentage |
|---|---|---|---|
| A | 5269 | 29 | 0.550389% |
| B | 5269 | 119 | 2.258493% |
| C | 5269 | 67 | 1.271589% |
| D | 5269 | 356 | 6.756500% |
Noise dominated data is calculated using 1-second bins in cleaned event files. If a bin has >2000 counts, and if more than 50% of those come from <1% of pixels, then it is considered to be noise-dominated and hence unusable.
| Quadrant | # 1 sec bins | Bins with >0 counts | Bins with >2000 counts | High rate bins dominated by noise | Noise dominated (total time) | Noise dominated (detector-on time) | Marked lightcurve |
|---|---|---|---|---|---|---|---|
| A | 7122 | 5270 | 20 | 20 | 0.28% | 0.38% | 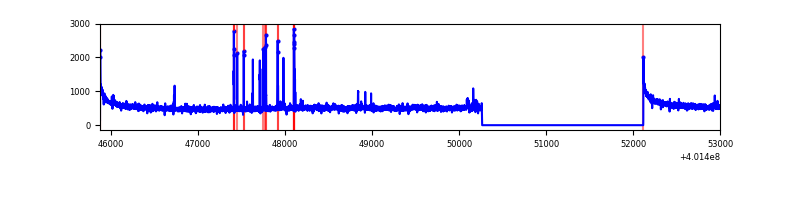 |
| B | 7122 | 5270 | 97 | 97 | 1.36% | 1.84% | 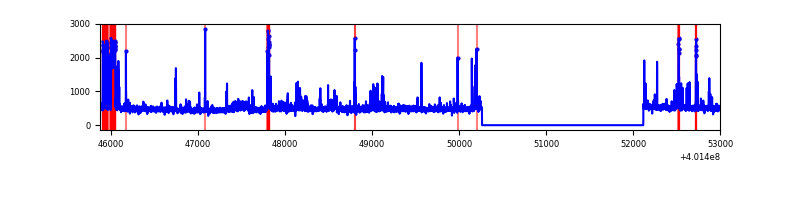 |
| C | 7122 | 5270 | 63 | 63 | 0.88% | 1.20% | 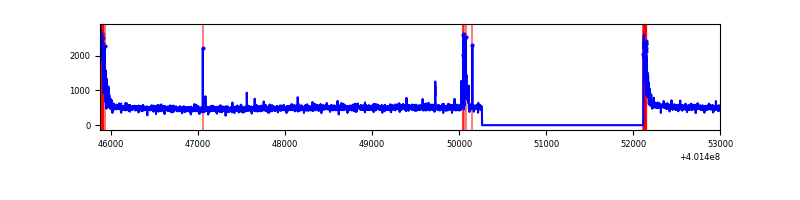 |
| D | 7122 | 5270 | 331 | 331 | 4.65% | 6.28% | 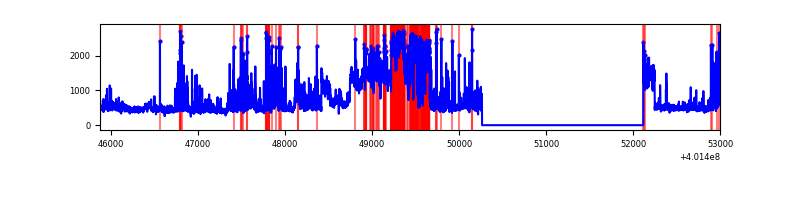 |
Top three noisy pixels from each quadrant. If the there are fewer than three noisy pixels in the level2.evt file, extra rows are filled as -1
| Pixel properties | Quadrant properties | ||||||
|---|---|---|---|---|---|---|---|
| Quadrant | DetID | PixID | Counts | Sigma | Mean | Median | Sigma |
| A | 10 | 83 | 330720 | 2667.64 | 625 | 615 | 123.7 |
| A | 6 | 10 | 78955 | 633.08 | 625 | 615 | 123.7 |
| A | 13 | 6 | 19196 | 150.16 | 625 | 615 | 123.7 |
| B | 5 | 255 | 294696 | 2536.49 | 609 | 595 | 115.9 |
| B | 0 | 189 | 52778 | 450.06 | 609 | 595 | 115.9 |
| B | 5 | 172 | 51279 | 437.13 | 609 | 595 | 115.9 |
| C | 15 | 214 | 226487 | 1646.28 | 600 | 605 | 137.2 |
| C | 0 | 10 | 195246 | 1418.59 | 600 | 605 | 137.2 |
| C | 15 | 159 | 45476 | 327.03 | 600 | 605 | 137.2 |
| D | 13 | 249 | 1046545 | 7173.7 | 596 | 579 | 145.8 |
| D | 2 | 249 | 439310 | 3009.01 | 596 | 579 | 145.8 |
| D | 12 | 233 | 218552 | 1494.95 | 596 | 579 | 145.8 |
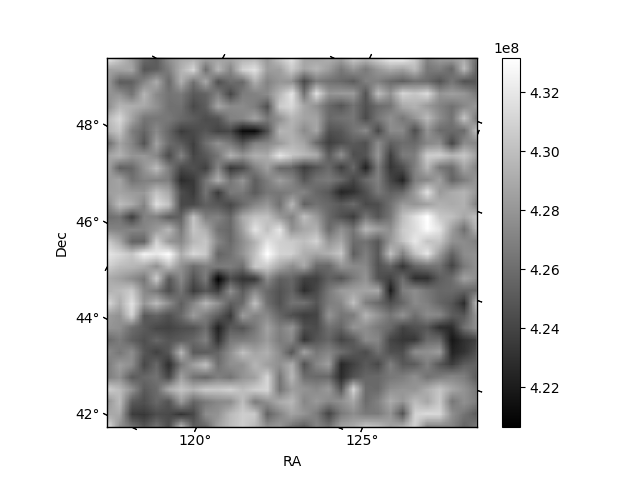
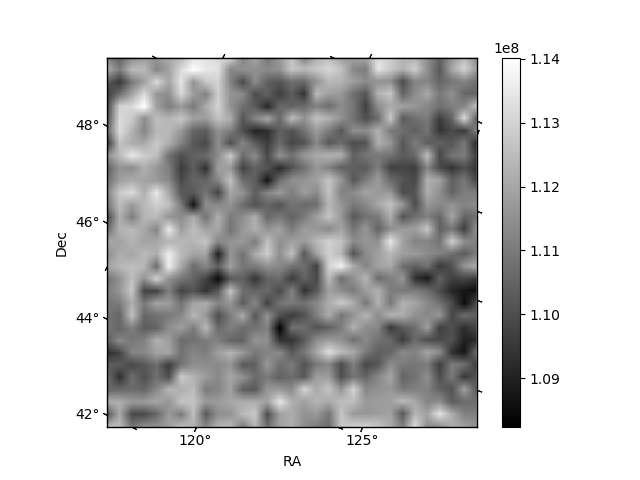
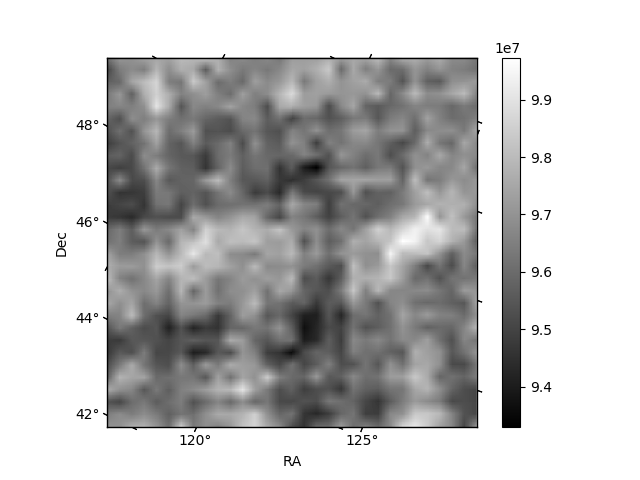
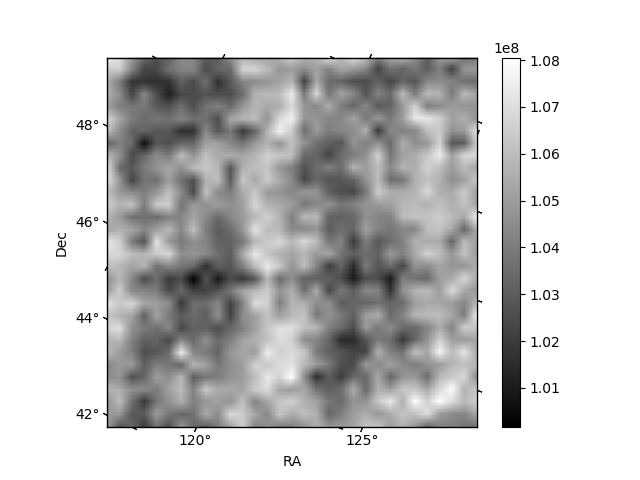
Histogram calculated using DETX and DETY for each event in the final _common_clean file
| Quadrant A | 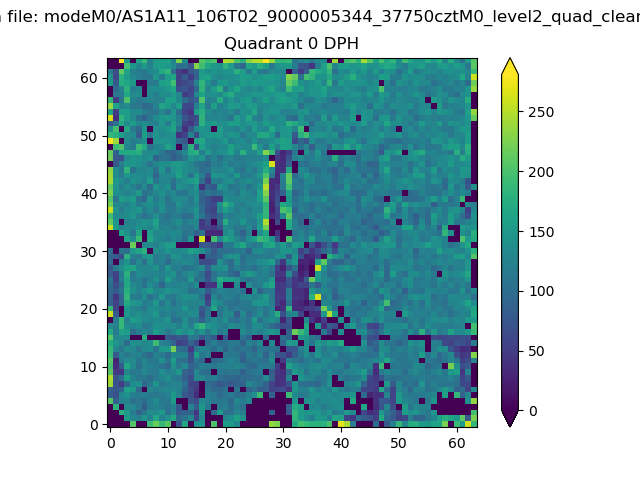 |
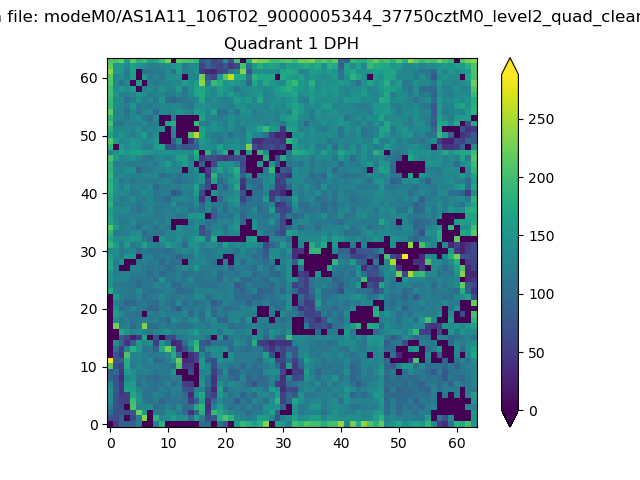 |
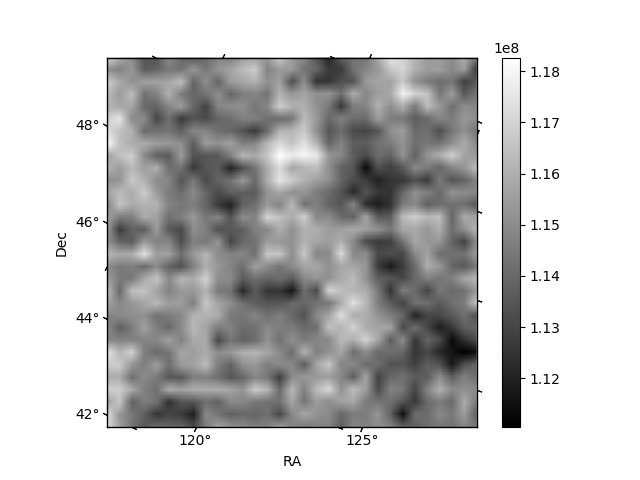
Quadrant B |
|---|---|---|---|
| Quadrant D | 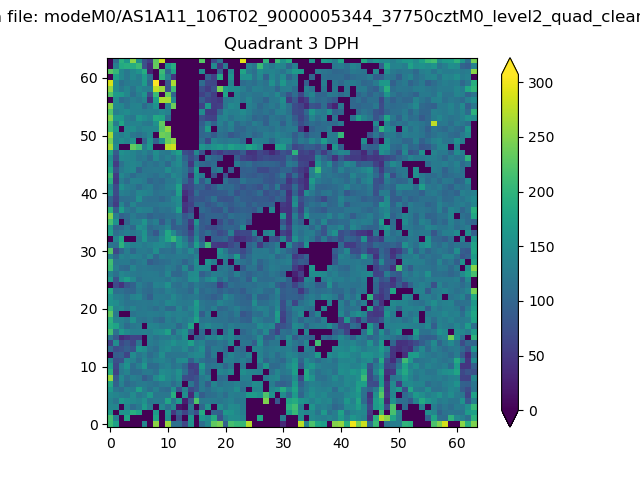 |
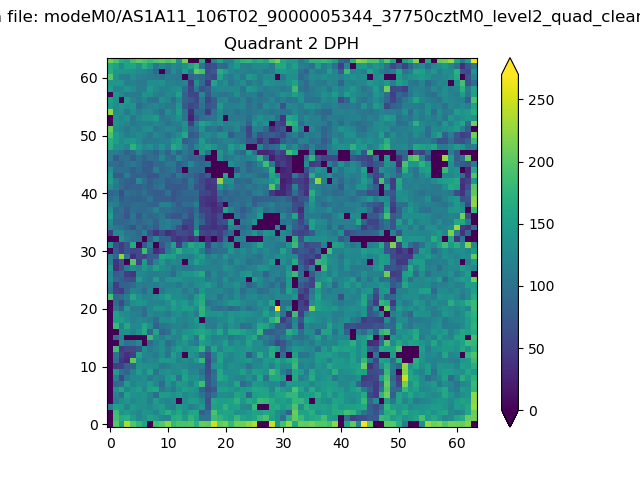 |
Quadrant C |
| Plot type | Count rate plots | Images |
|---|---|---|
| Comparison with Poisson distribution Blue bars denote a histogram of data divided into 1 sec bins. Red curve is a Poisson curve with rate = median count rate of data. |
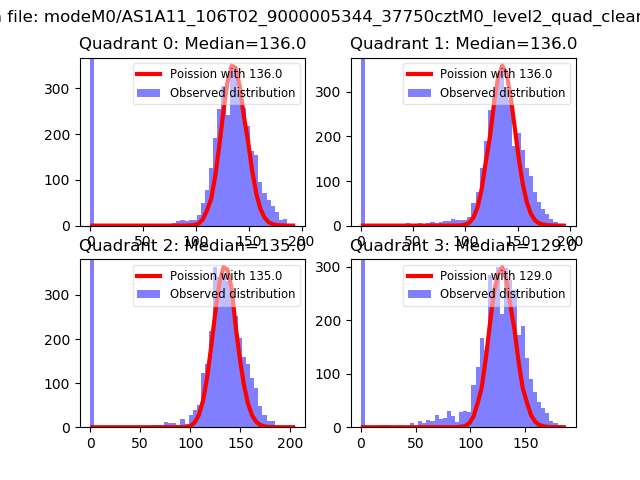 |
 |
| Quadrant-wise count rates Data is divided into 100 sec bins |
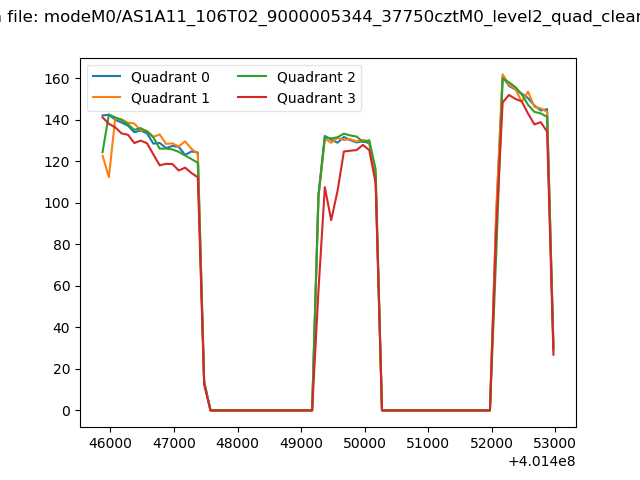 |
|
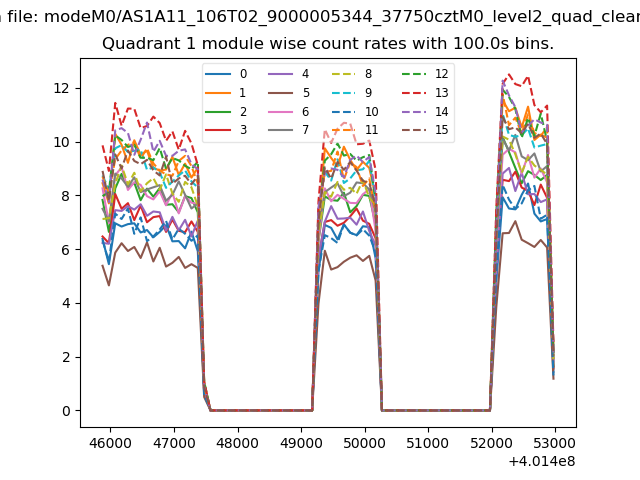
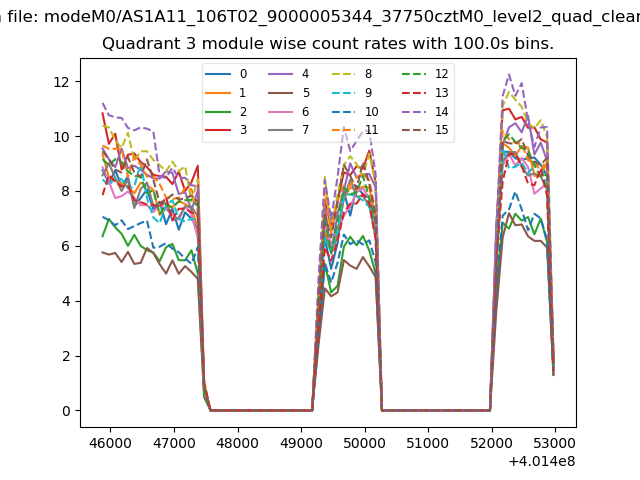
| Module-wise count rates for Quadrant A Data is divided into 100 sec bins |
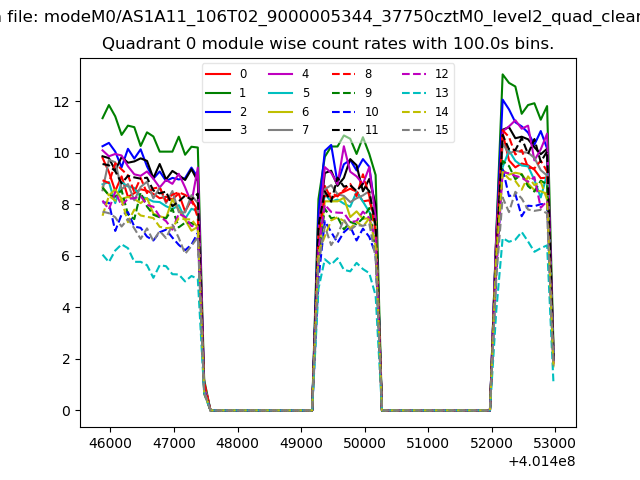 |
 |
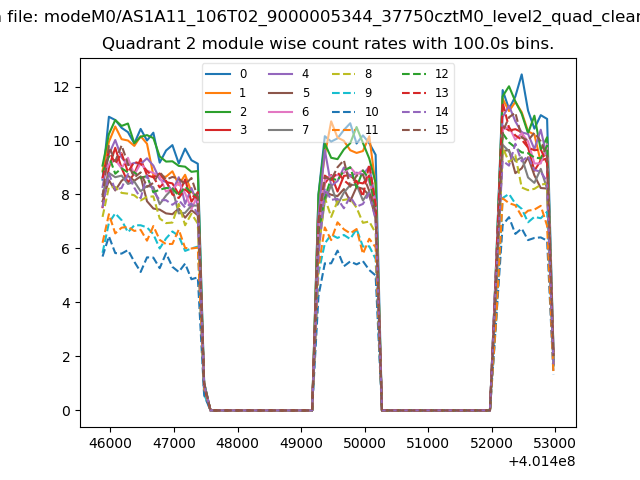
| Module-wise count rates for Quadrant B Data is divided into 100 sec bins |
 |
 |
| Module-wise count rates for Quadrant C Data is divided into 100 sec bins |
 |
 |
| Module-wise count rates for Quadrant D Data is divided into 100 sec bins |
 |
 |
| Parameter | Plot |
|---|---|
| CZT HV Monitor | 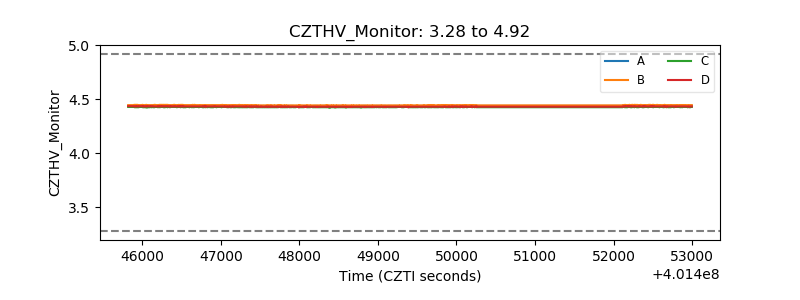 |
| D_VDD |  |
| Temperature 1 | 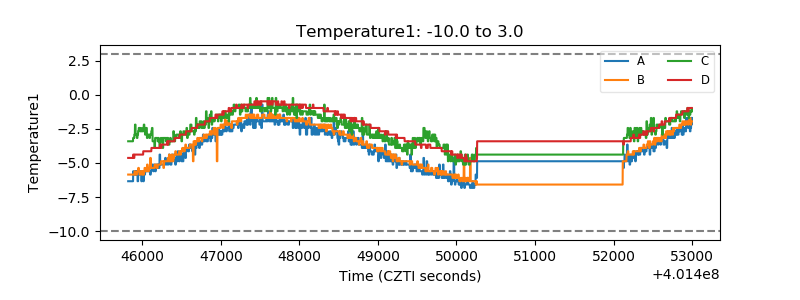 |
| Veto HV Monitor | 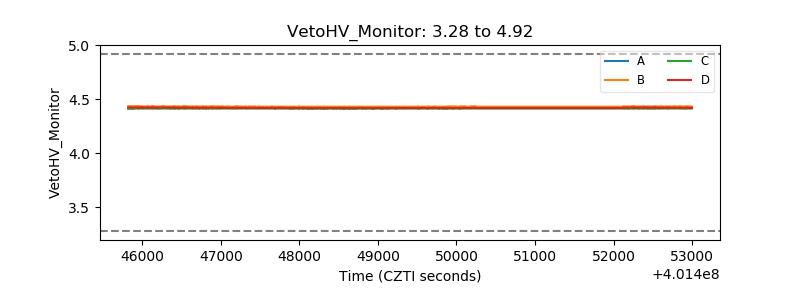 |
| Veto LLD | 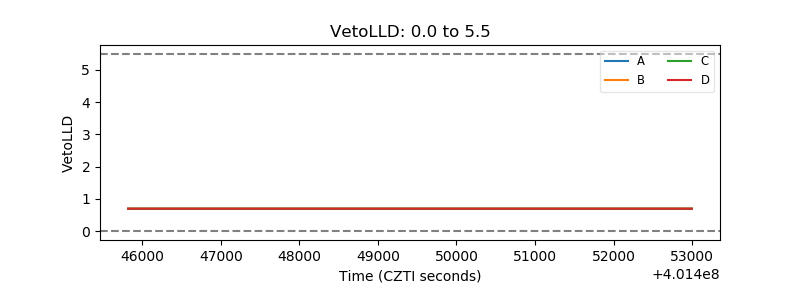 |
| Alpha Counter | 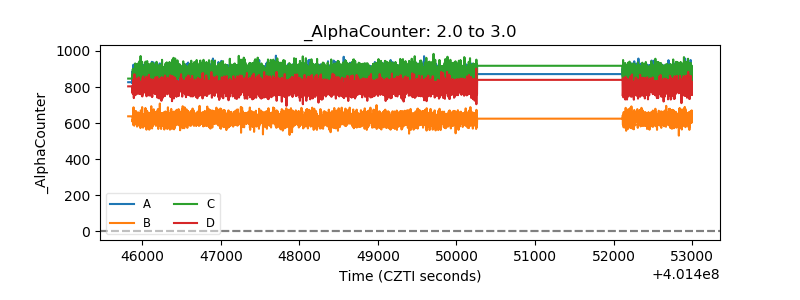 |
| _CPM_Rate | 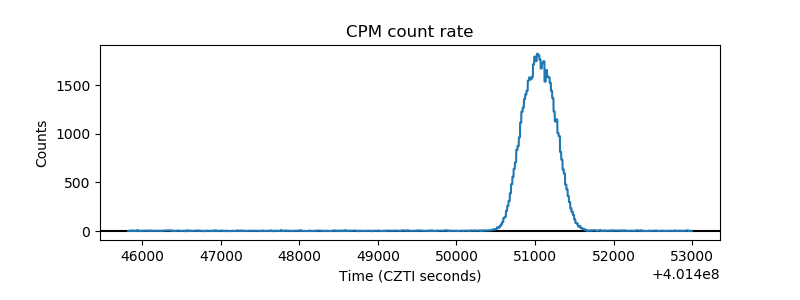 |
| CZT Counter | 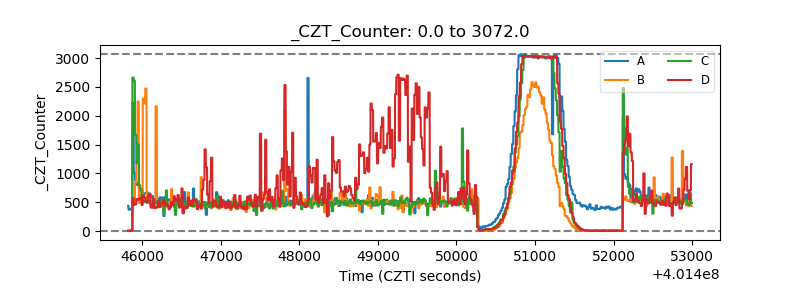 |
| +2.5 Volts monitor | 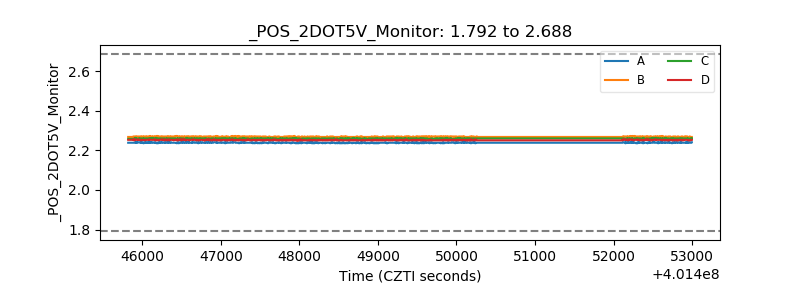 |
| +5 Volts monitor | 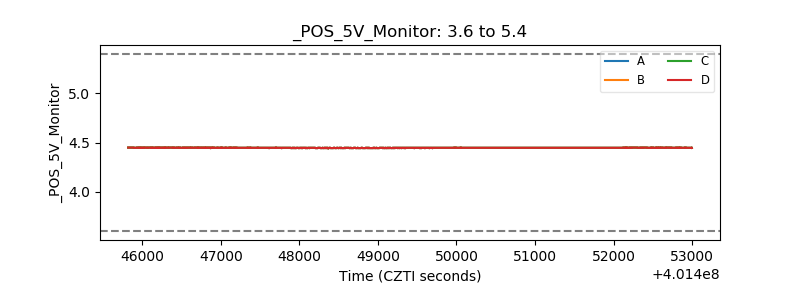 |
| _ROLL_ROT | 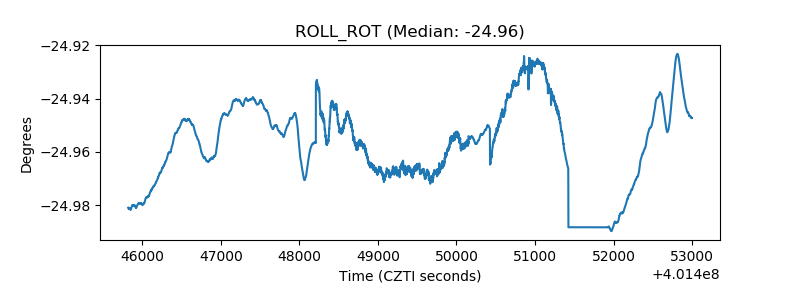 |
| _Roll_DEC | 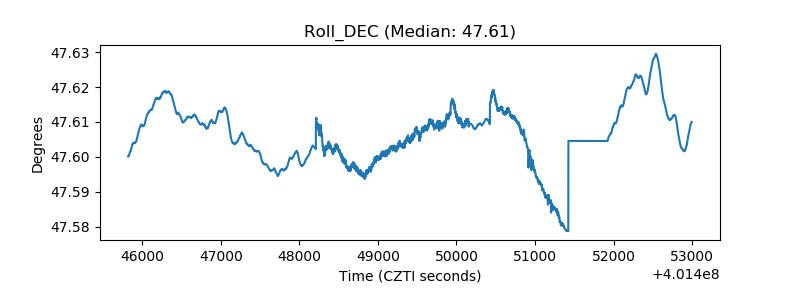 |
| _Roll_RA | 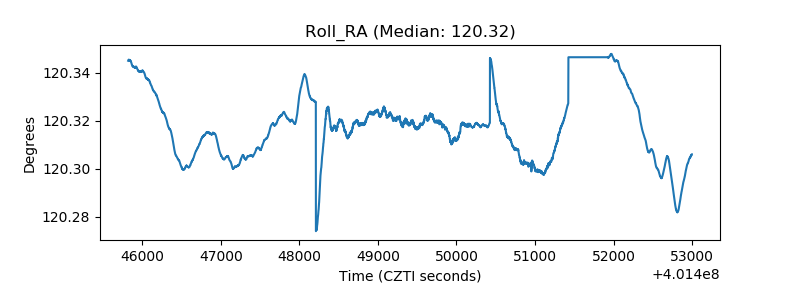 |
| Veto Counter | 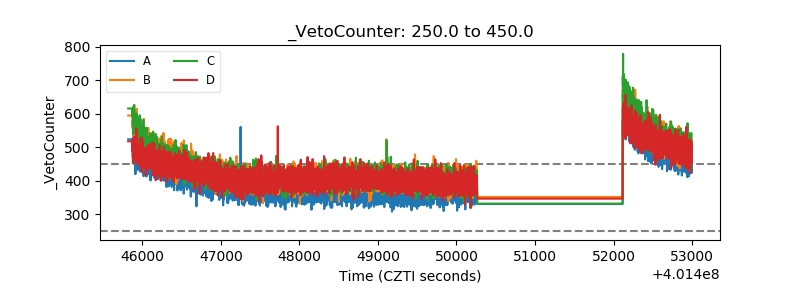 |