| Param | Original file | Final file |
|---|---|---|
| Filename | modeM0/AS1A11_106T02_9000005344_37751cztM0_level2.evt | modeM0/AS1A11_106T02_9000005344_37751cztM0_level2_quad_clean.evt |
| Size (bytes) | 603,599,040 | 71,916,480 |
| Size | 575.6 MB | 68.6 MB |
| Events in quadrant A | 8,330,579 | 413,494 |
| Events in quadrant B | 2,845,303 | 480,432 |
| Events in quadrant C | 2,830,102 | 473,464 |
| Events in quadrant D | 3,923,191 | 447,214 |
| Mode M9 | |||
|---|---|---|---|
| Quadrant | BADHDUFLAG | Total packets | Discarded packets |
| A | 0 | 20 | 0 |
| B | 0 | 20 | 0 |
| C | 0 | 20 | 0 |
| D | 0 | 21 | 0 |
| Mode SS | |||
|---|---|---|---|
| Quadrant | BADHDUFLAG | Total packets | Discarded packets |
| A | 0 | 106 | 0 |
| B | 0 | 106 | 0 |
| C | 0 | 106 | 0 |
| D | 0 | 106 | 0 |
| Mode M0 | |||
|---|---|---|---|
| Quadrant | BADHDUFLAG | Total packets | Discarded packets |
| A | 0 | 28193 | 3 |
| B | 0 | 11412 | 2 |
| C | 0 | 11171 | 2 |
| D | 0 | 14986 | 2 |
| Quadrant | Total seconds | Saturated seconds | Saturation percentage |
|---|---|---|---|
| A | 5171 | 3007 | 58.151228% |
| B | 5171 | 35 | 0.676852% |
| C | 5171 | 46 | 0.889576% |
| D | 5171 | 197 | 3.809708% |
Noise dominated data is calculated using 1-second bins in cleaned event files. If a bin has >2000 counts, and if more than 50% of those come from <1% of pixels, then it is considered to be noise-dominated and hence unusable.
| Quadrant | # 1 sec bins | Bins with >0 counts | Bins with >2000 counts | High rate bins dominated by noise | Noise dominated (total time) | Noise dominated (detector-on time) | Marked lightcurve |
|---|---|---|---|---|---|---|---|
| A | 7144 | 5172 | 2628 | 2628 | 36.79% | 50.81% | 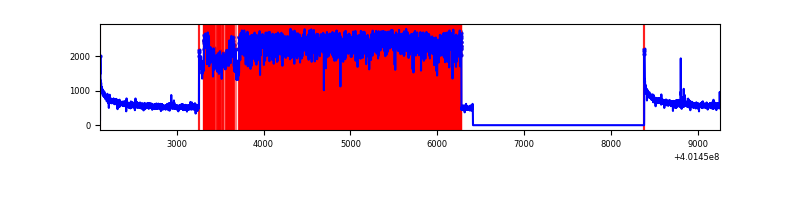 |
| B | 7144 | 5172 | 25 | 25 | 0.35% | 0.48% | 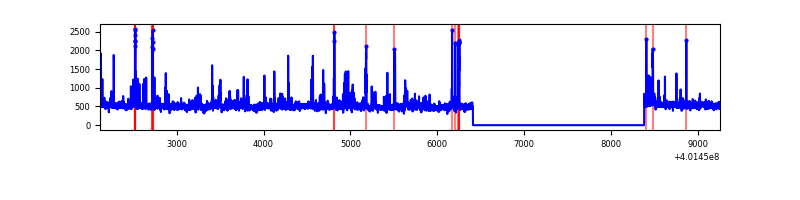 |
| C | 7144 | 5172 | 52 | 52 | 0.73% | 1.01% | 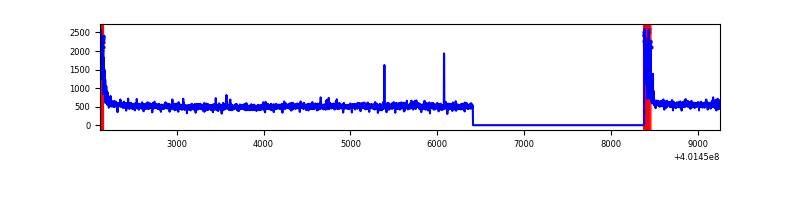 |
| D | 7144 | 5172 | 196 | 196 | 2.74% | 3.79% | 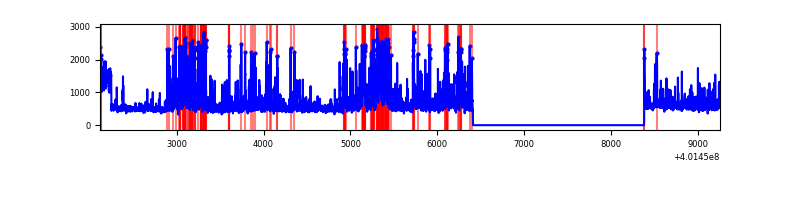 |
Top three noisy pixels from each quadrant. If the there are fewer than three noisy pixels in the level2.evt file, extra rows are filled as -1
| Pixel properties | Quadrant properties | ||||||
|---|---|---|---|---|---|---|---|
| Quadrant | DetID | PixID | Counts | Sigma | Mean | Median | Sigma |
| A | 15 | 222 | 6037228 | 59726.96 | 508 | 499 | 101.1 |
| A | 10 | 83 | 291639 | 2880.51 | 508 | 499 | 101.1 |
| A | 13 | 6 | 15429 | 147.71 | 508 | 499 | 101.1 |
| B | 5 | 255 | 112867 | 954.15 | 627 | 613 | 117.6 |
| B | 4 | 81 | 46941 | 393.79 | 627 | 613 | 117.6 |
| B | 0 | 189 | 43586 | 365.27 | 627 | 613 | 117.6 |
| C | 15 | 214 | 223331 | 1575.79 | 615 | 621 | 141.3 |
| C | 0 | 10 | 177778 | 1253.48 | 615 | 621 | 141.3 |
| C | 15 | 159 | 11292 | 75.5 | 615 | 621 | 141.3 |
| D | 2 | 250 | 626443 | 4192.48 | 619 | 603 | 149.3 |
| D | 2 | 249 | 279073 | 1865.46 | 619 | 603 | 149.3 |
| D | 7 | 223 | 174726 | 1166.44 | 619 | 603 | 149.3 |
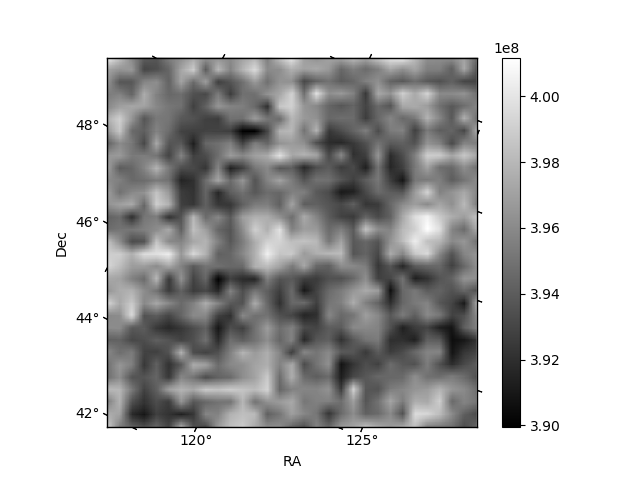
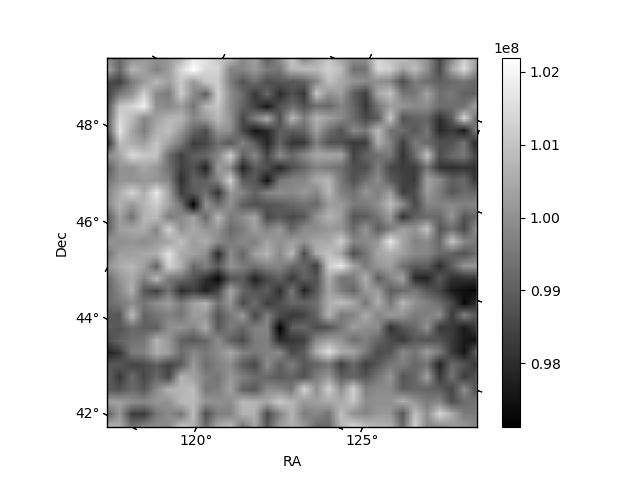
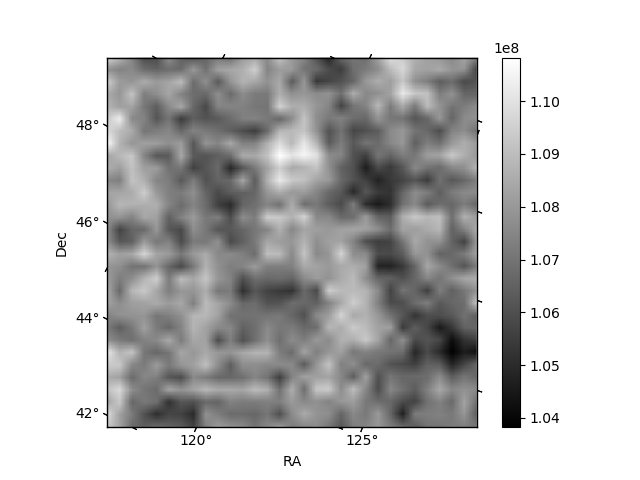
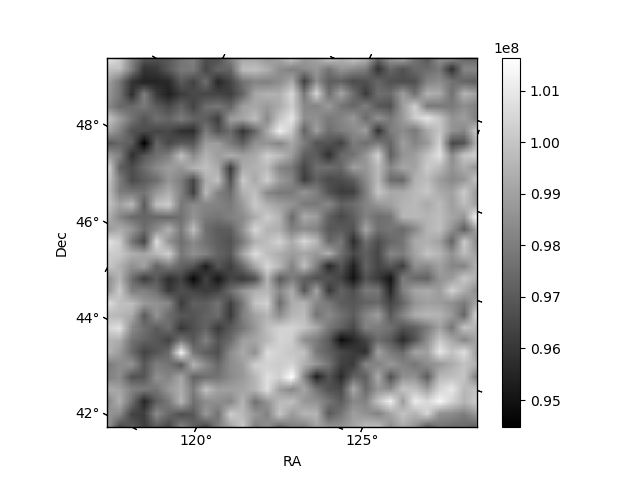
Histogram calculated using DETX and DETY for each event in the final _common_clean file
| Quadrant A | 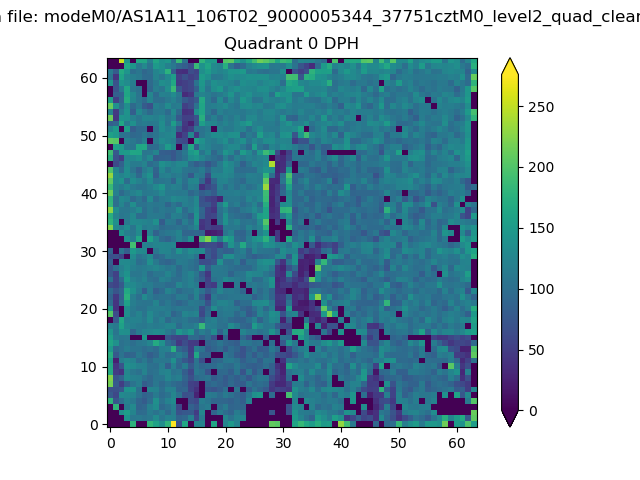 |
 |
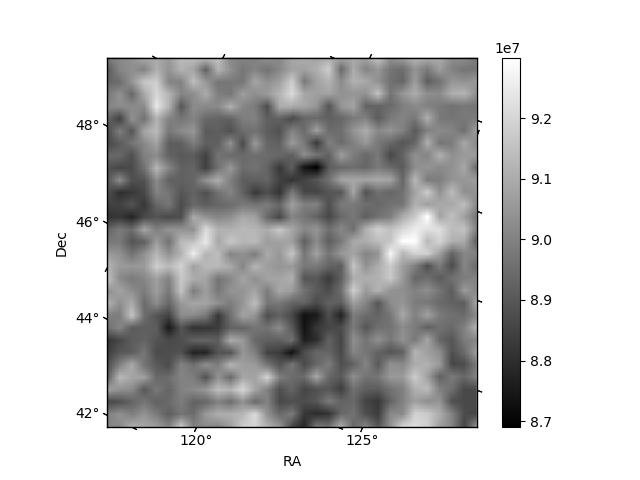
Quadrant B |
|---|---|---|---|
| Quadrant D | 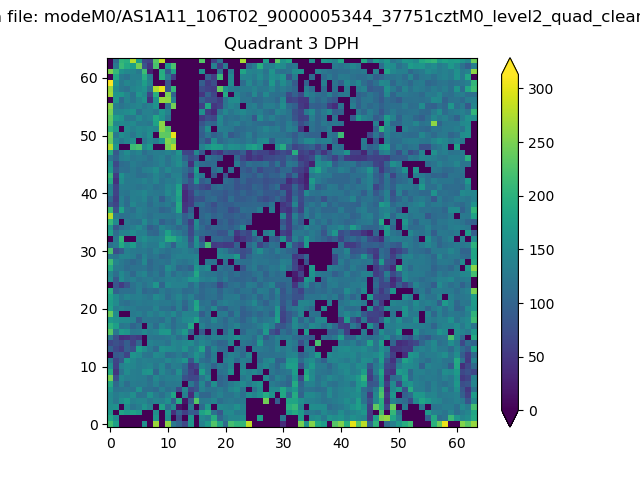 |
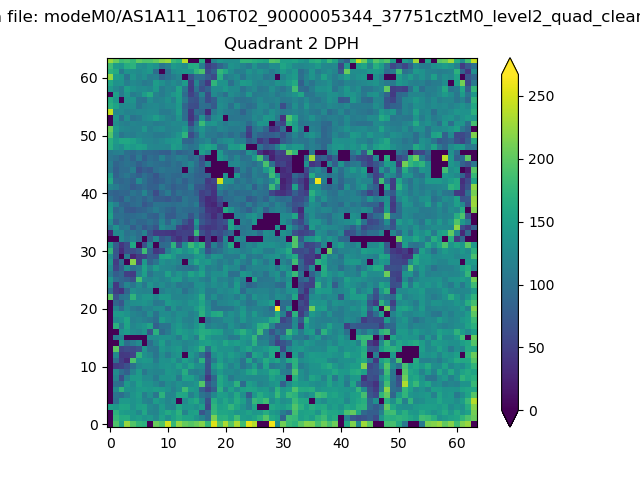 |
Quadrant C |
| Plot type | Count rate plots | Images |
|---|---|---|
| Comparison with Poisson distribution Blue bars denote a histogram of data divided into 1 sec bins. Red curve is a Poisson curve with rate = median count rate of data. |
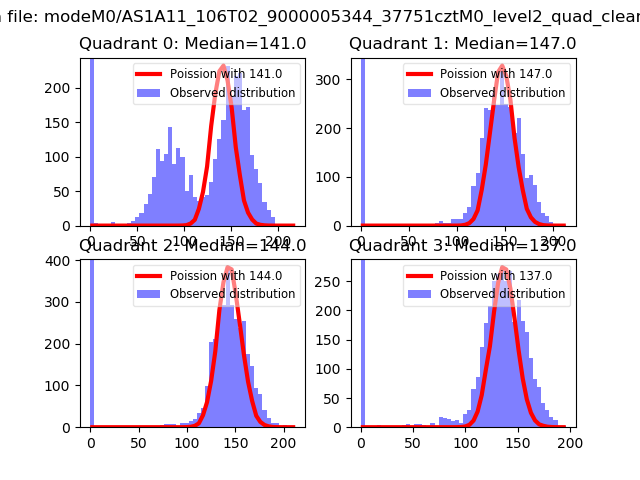 |
 |
| Quadrant-wise count rates Data is divided into 100 sec bins |
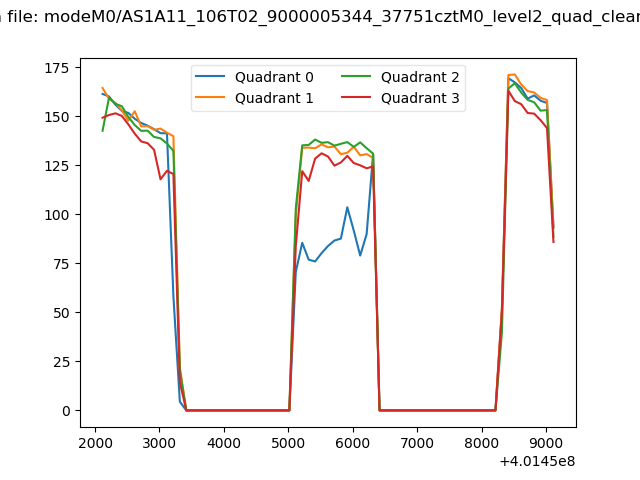 |
|
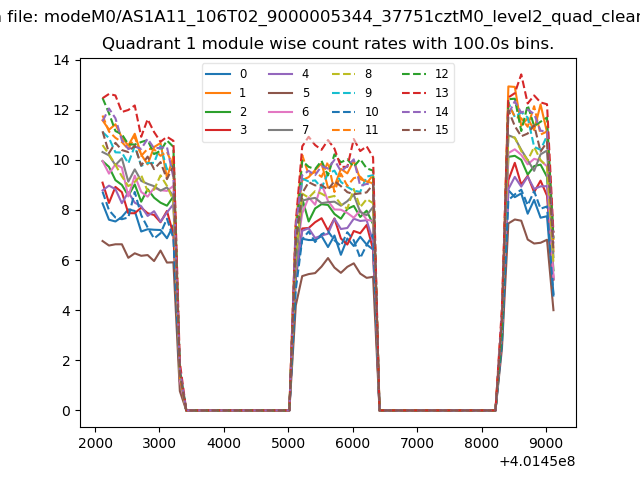
| Module-wise count rates for Quadrant A Data is divided into 100 sec bins |
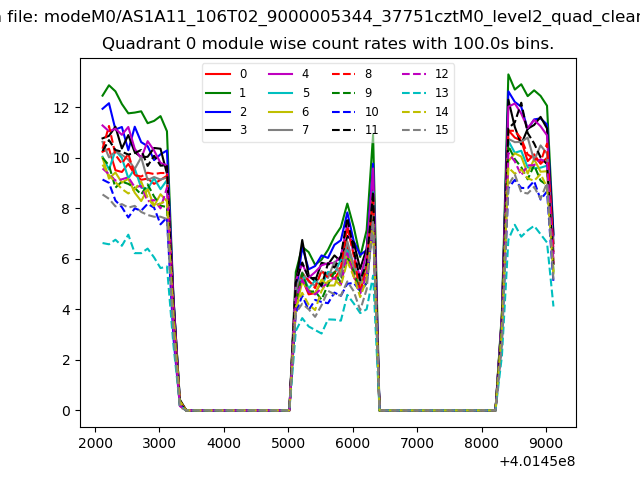 |
 |
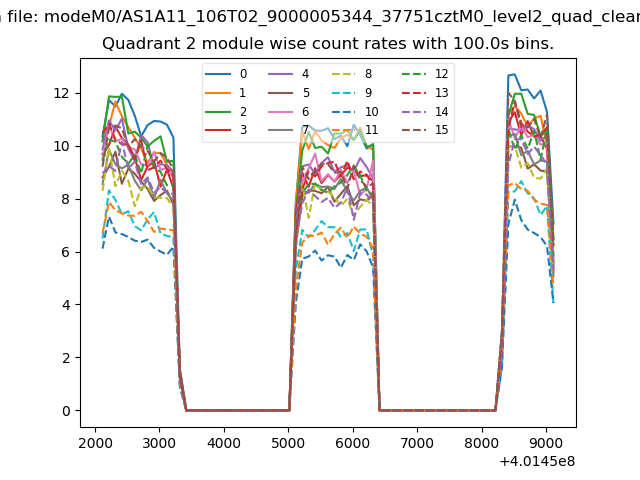
| Module-wise count rates for Quadrant B Data is divided into 100 sec bins |
 |
 |
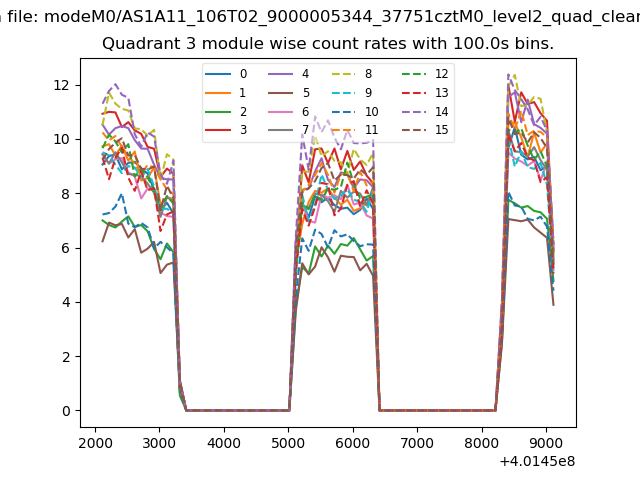
| Module-wise count rates for Quadrant C Data is divided into 100 sec bins |
 |
 |
| Module-wise count rates for Quadrant D Data is divided into 100 sec bins |
 |
 |
| Parameter | Plot |
|---|---|
| CZT HV Monitor | 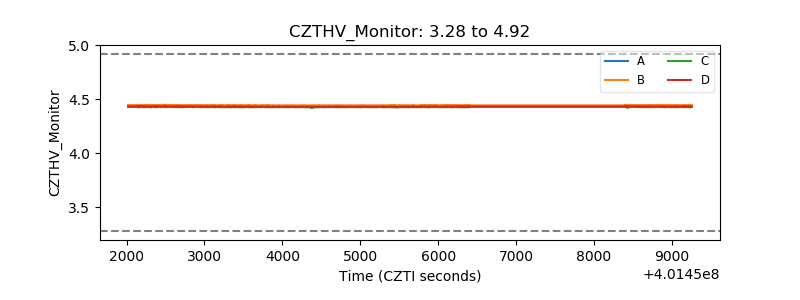 |
| D_VDD | 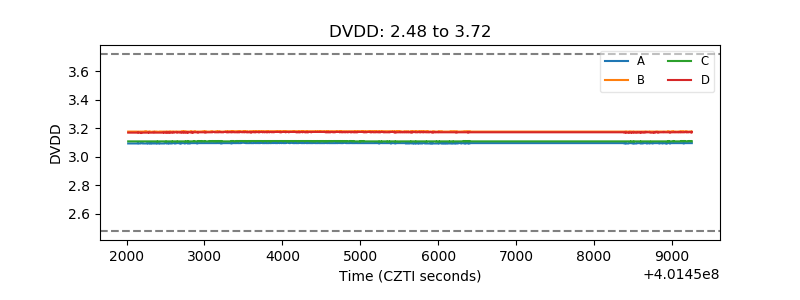 |
| Temperature 1 | 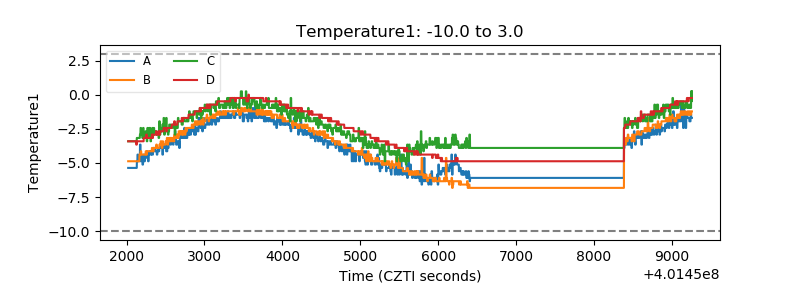 |
| Veto HV Monitor | 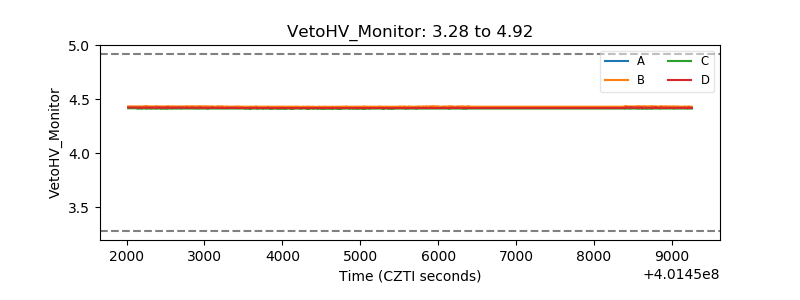 |
| Veto LLD | 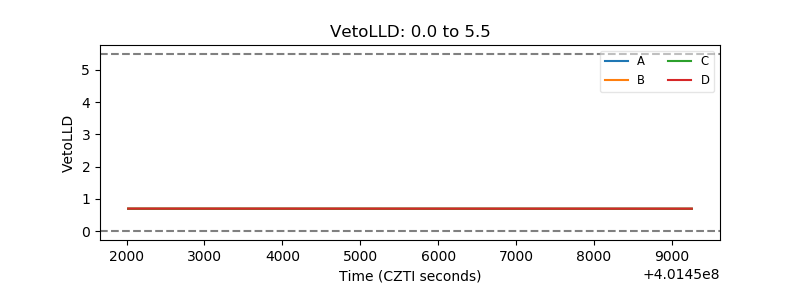 |
| Alpha Counter | 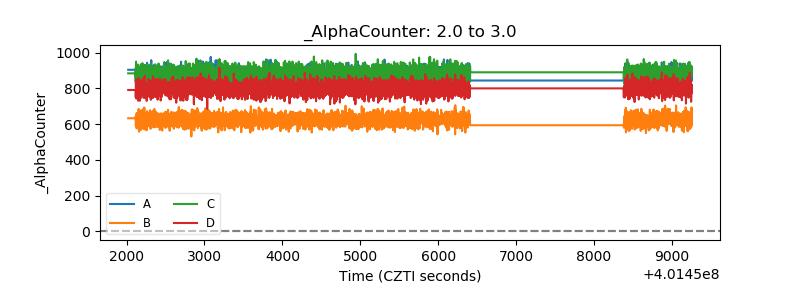 |
| _CPM_Rate | 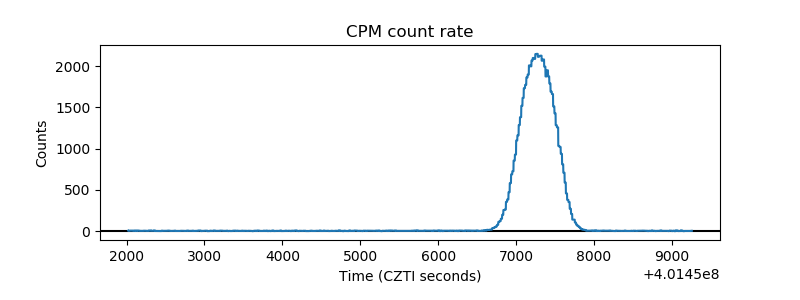 |
| CZT Counter | 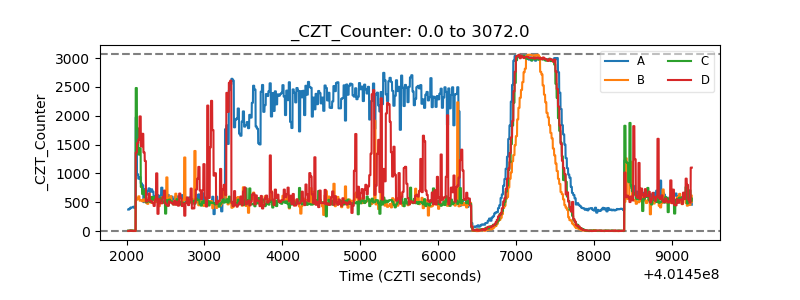 |
| +2.5 Volts monitor | 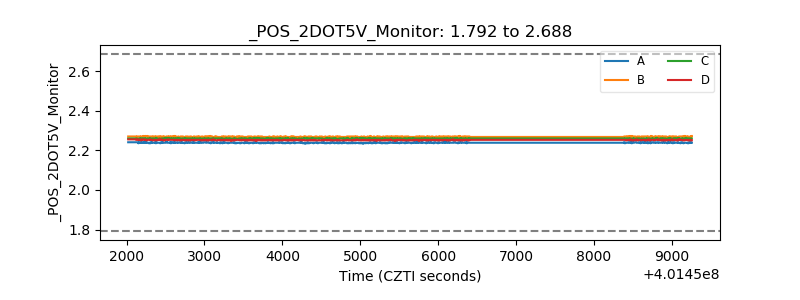 |
| +5 Volts monitor | 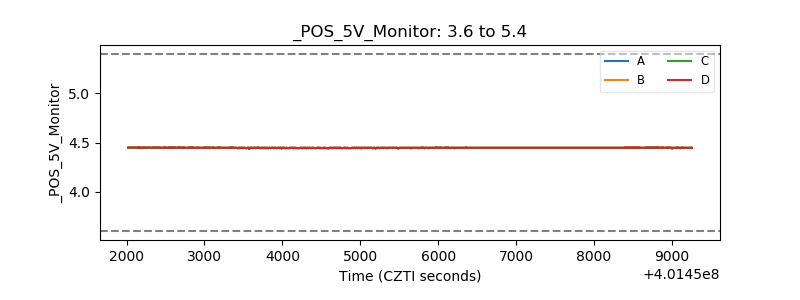 |
| _ROLL_ROT | 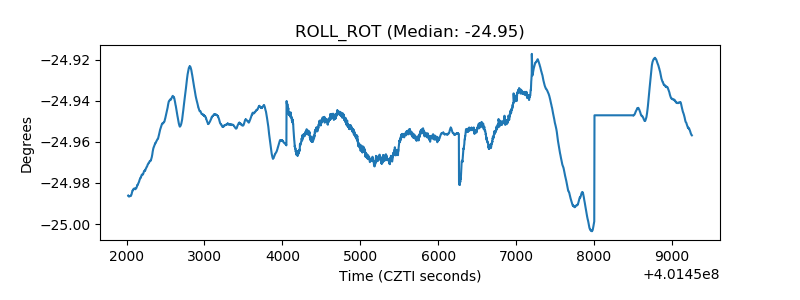 |
| _Roll_DEC | 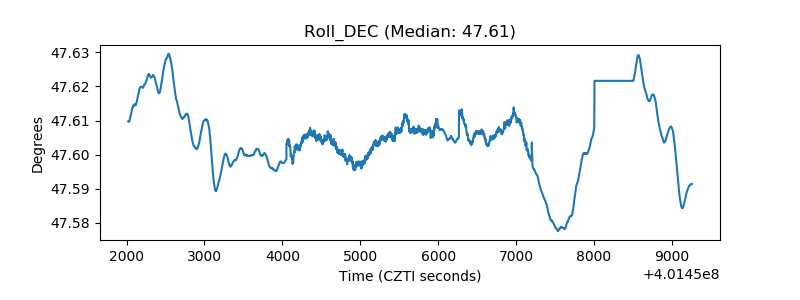 |
| _Roll_RA | 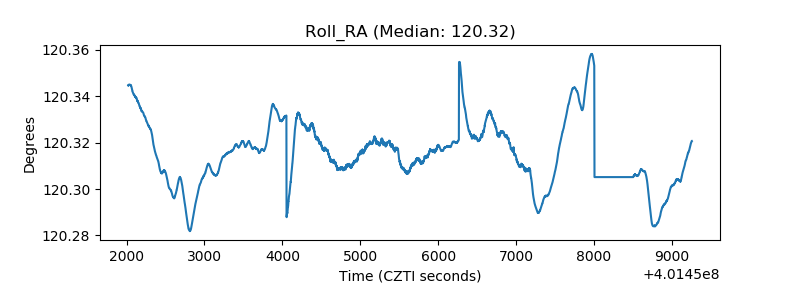 |
| Veto Counter | 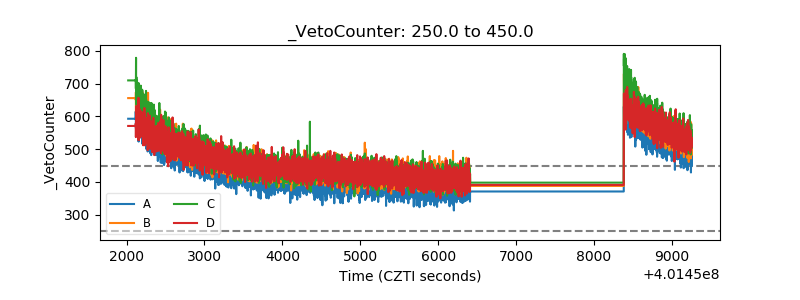 |