| Param | Original file | Final file |
|---|---|---|
| Filename | modeM0/AS1A11_106T02_9000005344_37752cztM0_level2.evt | modeM0/AS1A11_106T02_9000005344_37752cztM0_level2_quad_clean.evt |
| Size (bytes) | 515,226,240 | 58,003,200 |
| Size | 491.4 MB | 55.3 MB |
| Events in quadrant A | 6,387,015 | 264,664 |
| Events in quadrant B | 2,621,809 | 389,681 |
| Events in quadrant C | 2,756,757 | 386,904 |
| Events in quadrant D | 3,505,197 | 370,029 |
| Mode M9 | |||
|---|---|---|---|
| Quadrant | BADHDUFLAG | Total packets | Discarded packets |
| A | 0 | 21 | 0 |
| B | 0 | 21 | 0 |
| C | 0 | 21 | 0 |
| D | 0 | 21 | 0 |
| Mode SS | |||
|---|---|---|---|
| Quadrant | BADHDUFLAG | Total packets | Discarded packets |
| A | 0 | 100 | 0 |
| B | 0 | 100 | 0 |
| C | 0 | 100 | 0 |
| D | 0 | 100 | 0 |
| Mode M0 | |||
|---|---|---|---|
| Quadrant | BADHDUFLAG | Total packets | Discarded packets |
| A | 0 | 22115 | 2 |
| B | 0 | 10526 | 1 |
| C | 0 | 10791 | 1 |
| D | 0 | 13601 | 1 |
| Quadrant | Total seconds | Saturated seconds | Saturation percentage |
|---|---|---|---|
| A | 4906 | 1784 | 36.363636% |
| B | 4906 | 6 | 0.122299% |
| C | 4906 | 22 | 0.448430% |
| D | 4906 | 173 | 3.526294% |
Noise dominated data is calculated using 1-second bins in cleaned event files. If a bin has >2000 counts, and if more than 50% of those come from <1% of pixels, then it is considered to be noise-dominated and hence unusable.
| Quadrant | # 1 sec bins | Bins with >0 counts | Bins with >2000 counts | High rate bins dominated by noise | Noise dominated (total time) | Noise dominated (detector-on time) | Marked lightcurve |
|---|---|---|---|---|---|---|---|
| A | 6970 | 4906 | 1762 | 1762 | 25.28% | 35.92% | 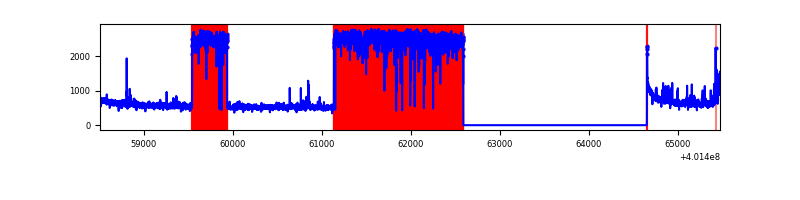 |
| B | 6970 | 4907 | 3 | 3 | 0.04% | 0.06% | 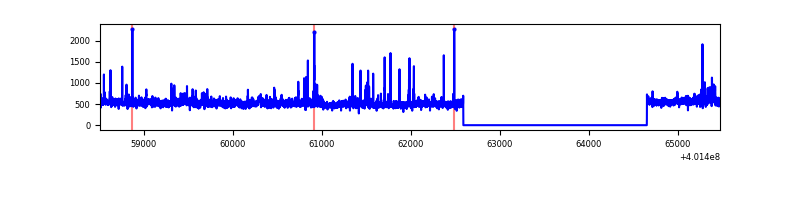 |
| C | 6970 | 4907 | 24 | 24 | 0.34% | 0.49% | 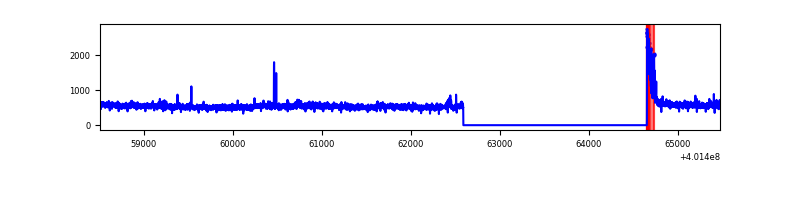 |
| D | 6970 | 4907 | 169 | 169 | 2.42% | 3.44% | 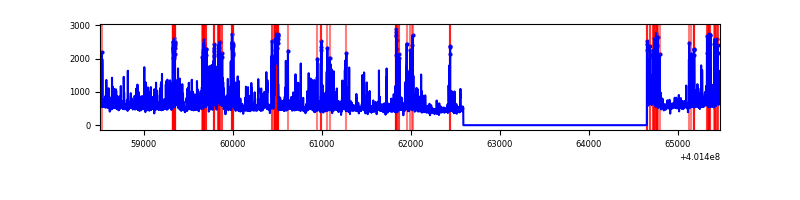 |
Top three noisy pixels from each quadrant. If the there are fewer than three noisy pixels in the level2.evt file, extra rows are filled as -1
| Pixel properties | Quadrant properties | ||||||
|---|---|---|---|---|---|---|---|
| Quadrant | DetID | PixID | Counts | Sigma | Mean | Median | Sigma |
| A | 15 | 222 | 4106199 | 41450.09 | 492 | 483 | 99.1 |
| A | 10 | 83 | 254072 | 2560.16 | 492 | 483 | 99.1 |
| A | 6 | 10 | 79939 | 802.16 | 492 | 483 | 99.1 |
| B | 5 | 255 | 46445 | 401.32 | 609 | 594 | 114.2 |
| B | 0 | 230 | 43912 | 379.15 | 609 | 594 | 114.2 |
| B | 0 | 213 | 36908 | 317.85 | 609 | 594 | 114.2 |
| C | 15 | 214 | 209619 | 1527.55 | 600 | 605 | 136.8 |
| C | 0 | 10 | 113656 | 826.22 | 600 | 605 | 136.8 |
| C | 0 | 207 | 65777 | 476.3 | 600 | 605 | 136.8 |
| D | 2 | 249 | 454281 | 3114.91 | 600 | 584 | 145.7 |
| D | 7 | 223 | 139260 | 952.1 | 600 | 584 | 145.7 |
| D | 13 | 249 | 126734 | 866.1 | 600 | 584 | 145.7 |
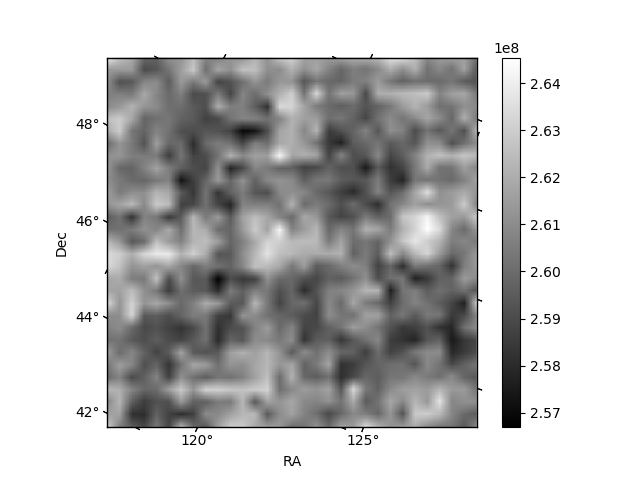
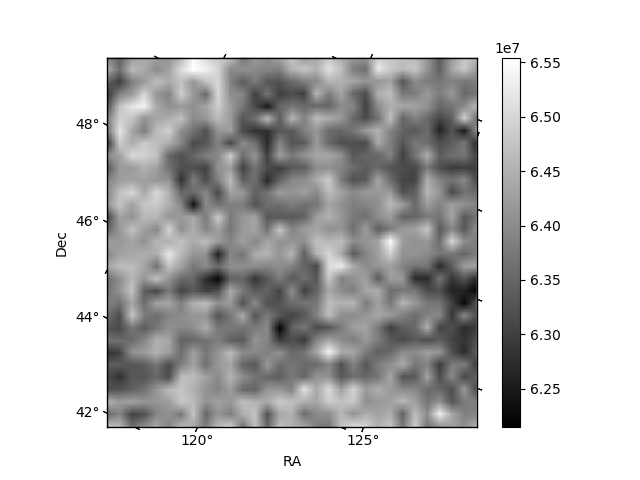
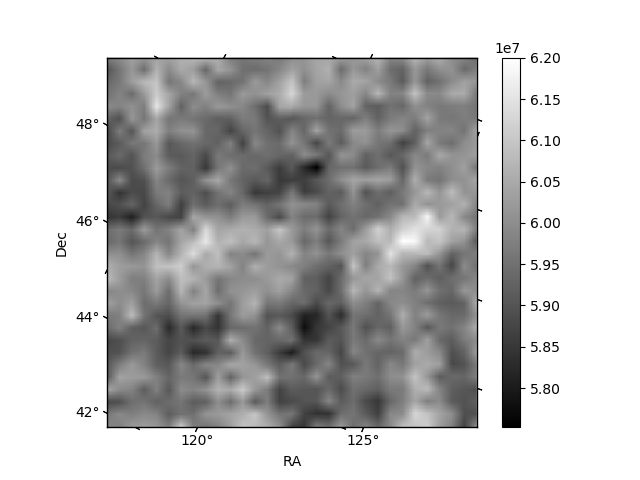
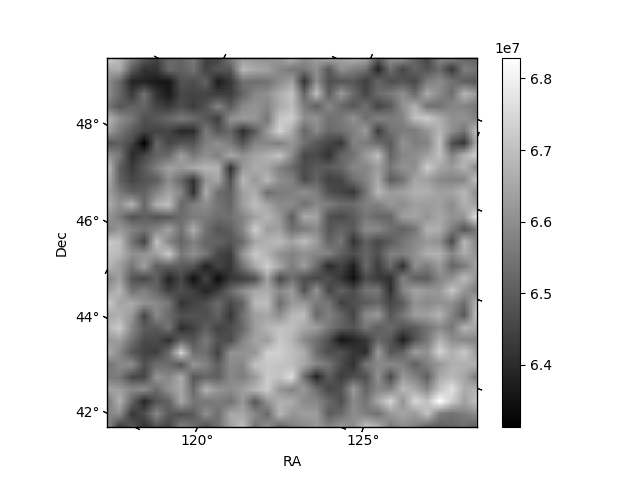
Histogram calculated using DETX and DETY for each event in the final _common_clean file
| Quadrant A | 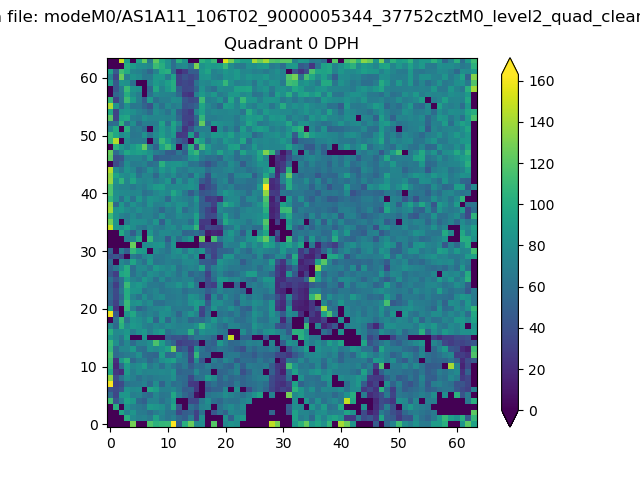 |
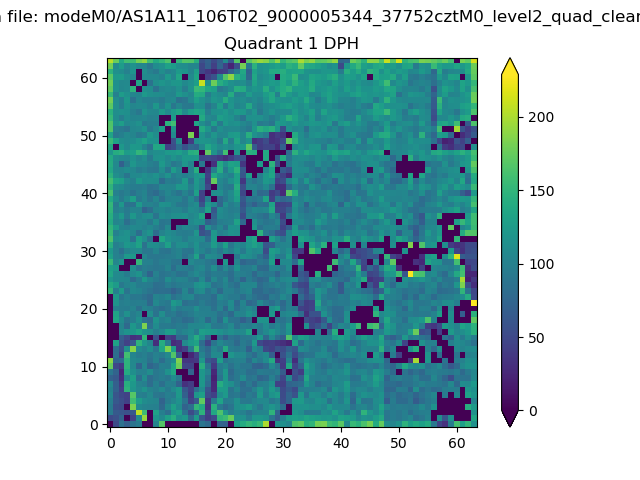 |
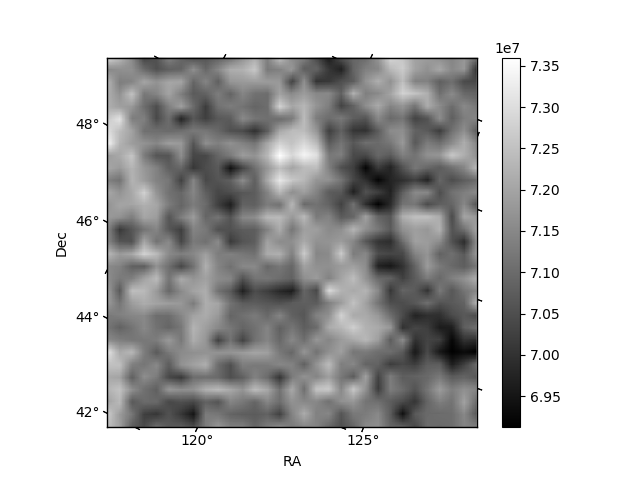
Quadrant B |
|---|---|---|---|
| Quadrant D | 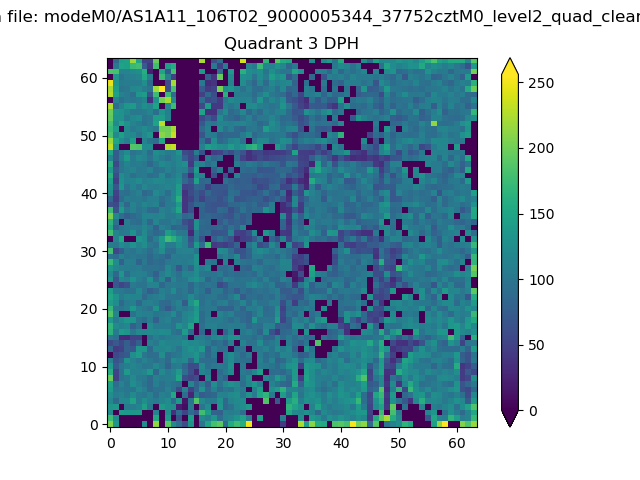 |
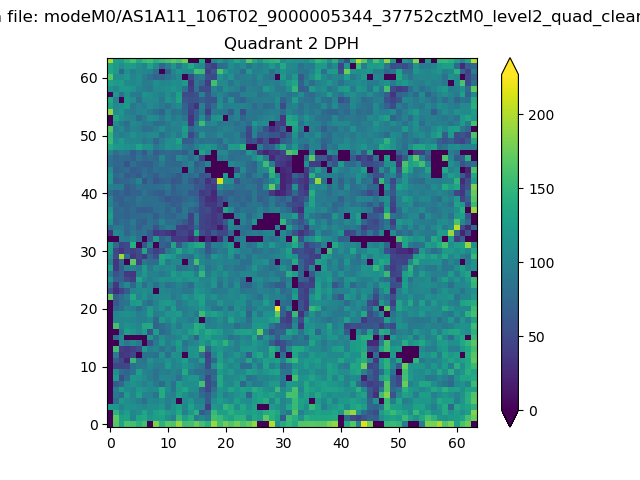 |
Quadrant C |
| Plot type | Count rate plots | Images |
|---|---|---|
| Comparison with Poisson distribution Blue bars denote a histogram of data divided into 1 sec bins. Red curve is a Poisson curve with rate = median count rate of data. |
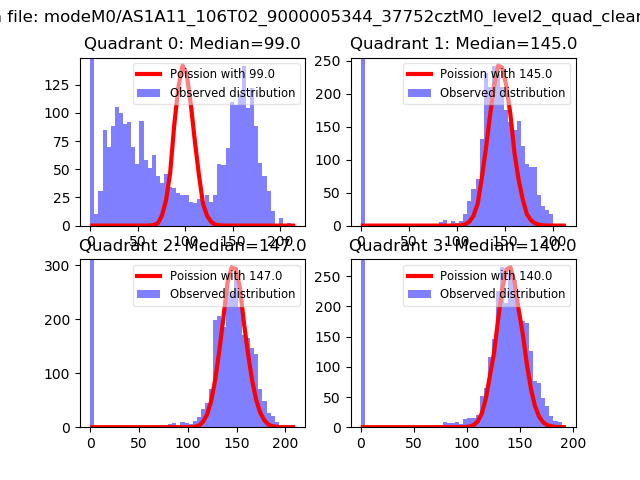 |
 |
| Quadrant-wise count rates Data is divided into 100 sec bins |
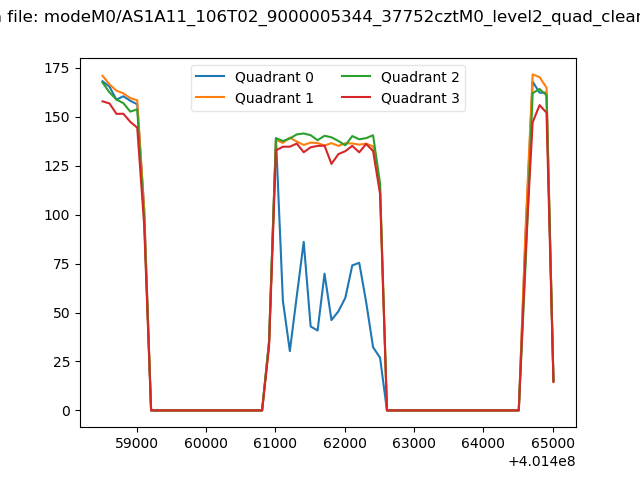 |
|
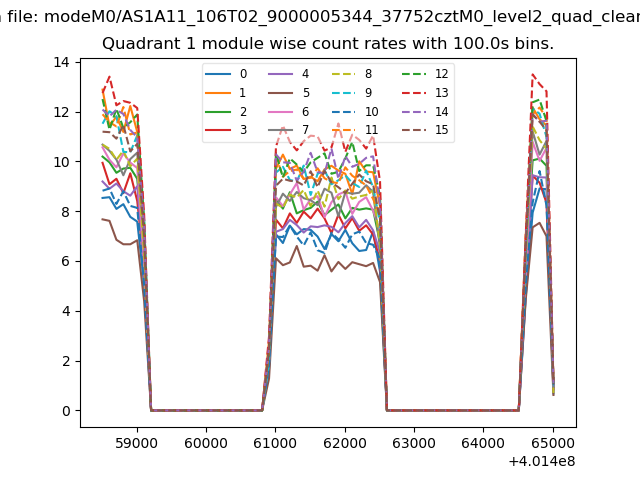
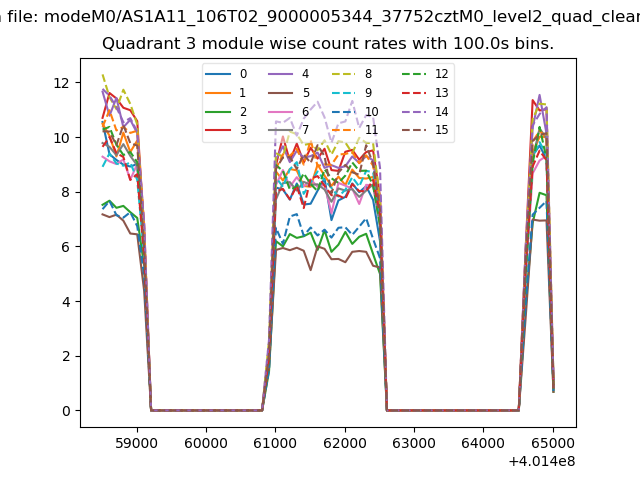
| Module-wise count rates for Quadrant A Data is divided into 100 sec bins |
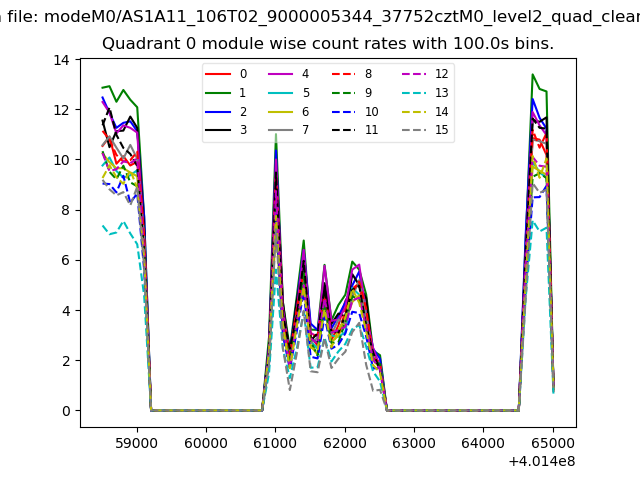 |
 |
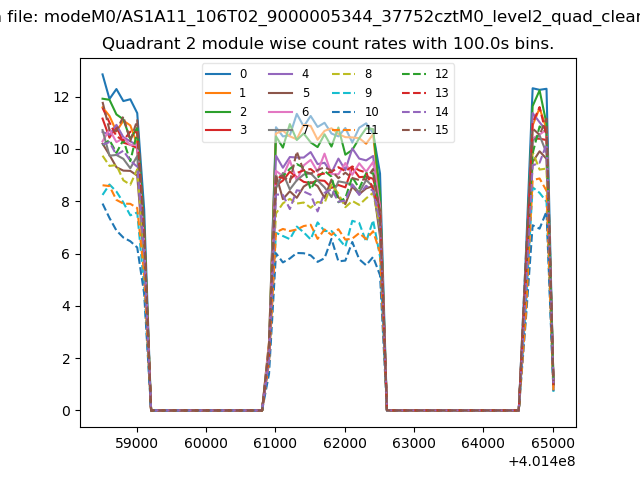
| Module-wise count rates for Quadrant B Data is divided into 100 sec bins |
 |
 |
| Module-wise count rates for Quadrant C Data is divided into 100 sec bins |
 |
 |
| Module-wise count rates for Quadrant D Data is divided into 100 sec bins |
 |
 |
| Parameter | Plot |
|---|---|
| CZT HV Monitor | 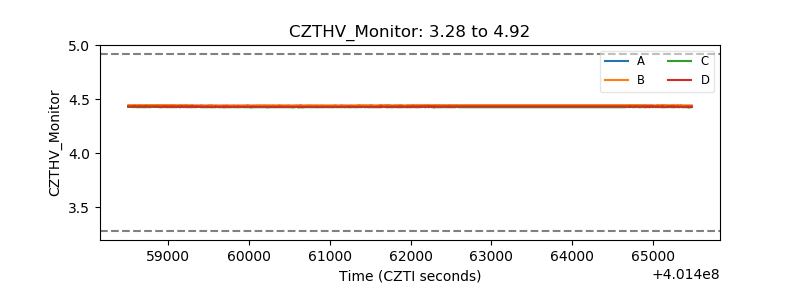 |
| D_VDD | 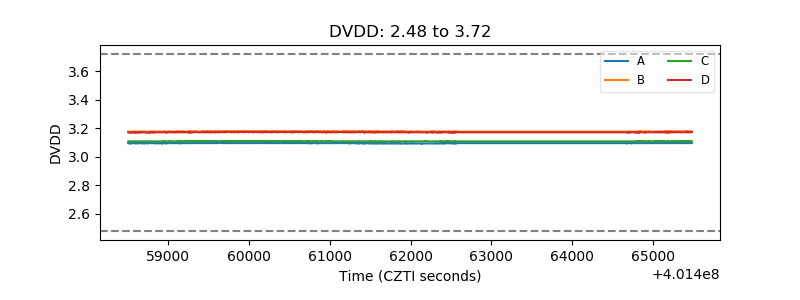 |
| Temperature 1 | 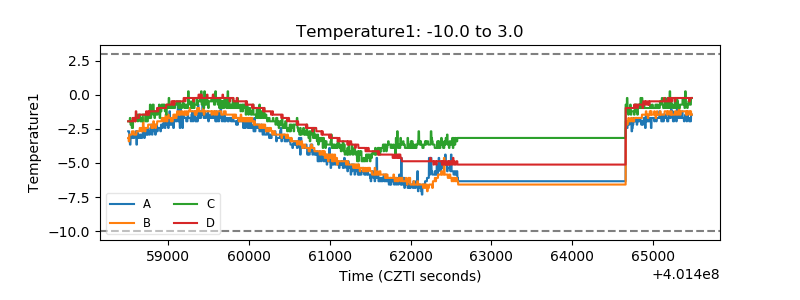 |
| Veto HV Monitor | 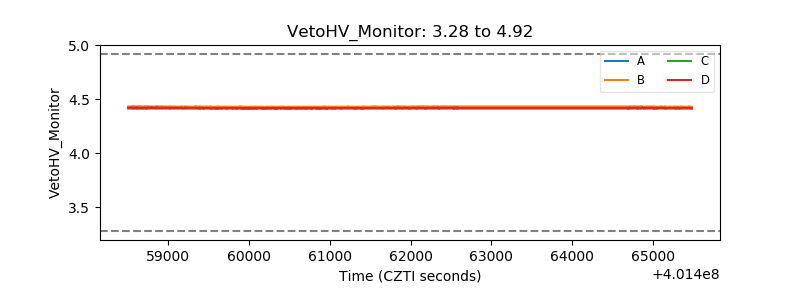 |
| Veto LLD | 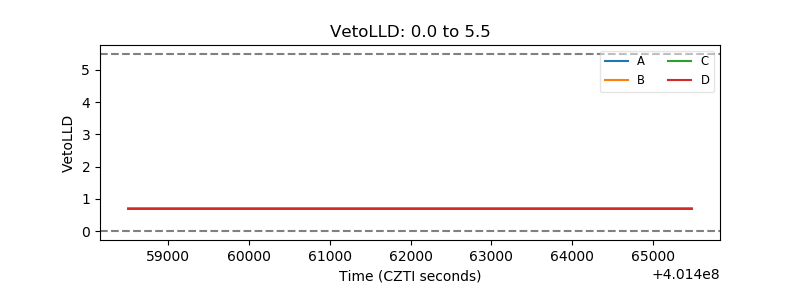 |
| Alpha Counter | 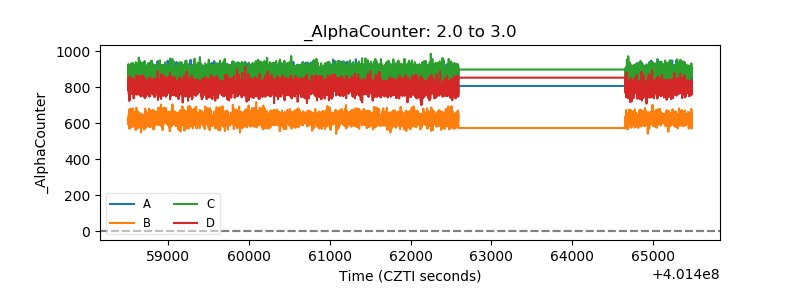 |
| _CPM_Rate | 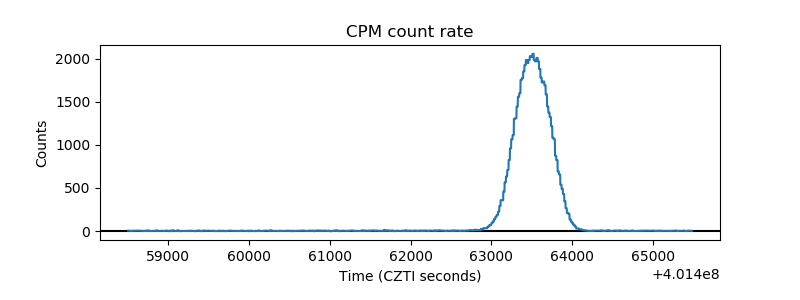 |
| CZT Counter | 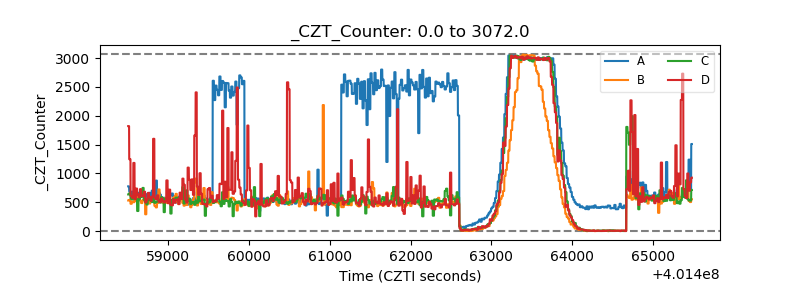 |
| +2.5 Volts monitor | 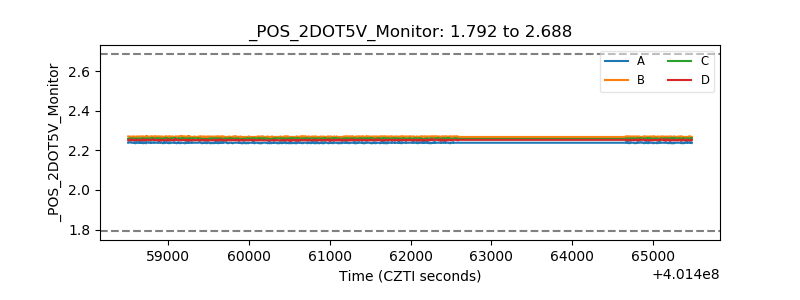 |
| +5 Volts monitor | 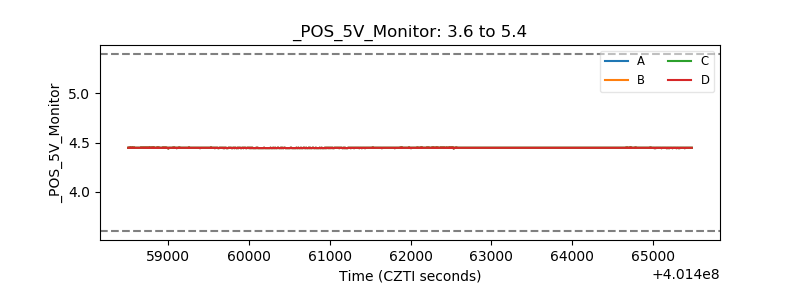 |
| _ROLL_ROT | 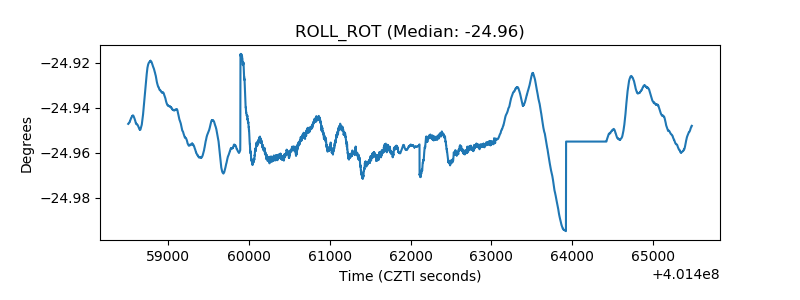 |
| _Roll_DEC | 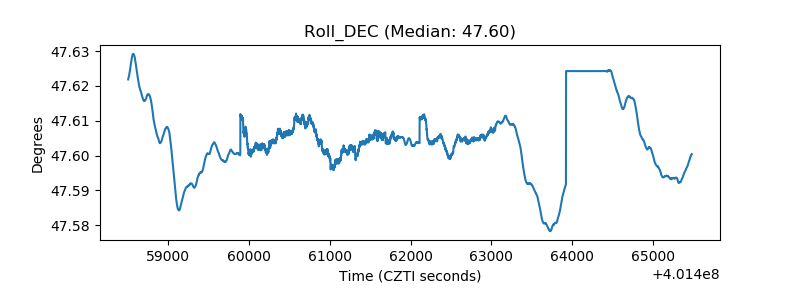 |
| _Roll_RA | 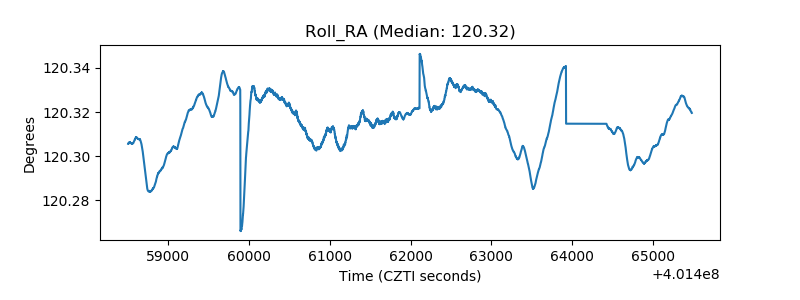 |
| Veto Counter | 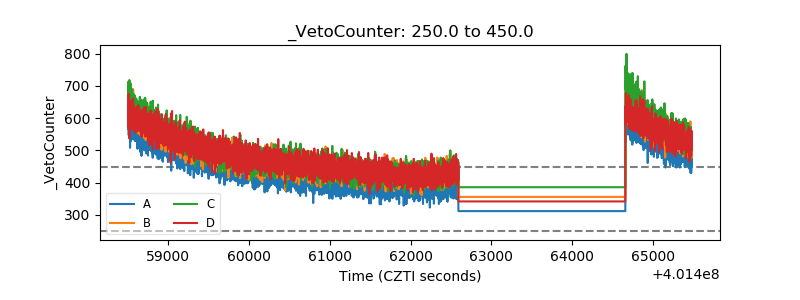 |