| Param | Original file | Final file |
|---|---|---|
| Filename | modeM0/AS1A11_106T02_9000005344_37753cztM0_level2.evt | modeM0/AS1A11_106T02_9000005344_37753cztM0_level2_quad_clean.evt |
| Size (bytes) | 537,114,240 | 53,501,760 |
| Size | 512.2 MB | 51.0 MB |
| Events in quadrant A | 5,617,771 | 292,123 |
| Events in quadrant B | 2,797,971 | 331,437 |
| Events in quadrant C | 2,968,565 | 333,823 |
| Events in quadrant D | 4,526,642 | 294,526 |
| Mode M9 | |||
|---|---|---|---|
| Quadrant | BADHDUFLAG | Total packets | Discarded packets |
| A | 0 | 23 | 0 |
| B | 0 | 23 | 0 |
| C | 0 | 23 | 0 |
| D | 0 | 24 | 0 |
| Mode SS | |||
|---|---|---|---|
| Quadrant | BADHDUFLAG | Total packets | Discarded packets |
| A | 0 | 106 | 0 |
| B | 0 | 106 | 0 |
| C | 0 | 106 | 0 |
| D | 0 | 106 | 0 |
| Mode M0 | |||
|---|---|---|---|
| Quadrant | BADHDUFLAG | Total packets | Discarded packets |
| A | 0 | 20137 | 3 |
| B | 0 | 11367 | 2 |
| C | 0 | 11734 | 2 |
| D | 0 | 16921 | 2 |
| Quadrant | Total seconds | Saturated seconds | Saturation percentage |
|---|---|---|---|
| A | 5247 | 1285 | 24.490185% |
| B | 5247 | 34 | 0.647989% |
| C | 5247 | 38 | 0.724223% |
| D | 5247 | 509 | 9.700781% |
Noise dominated data is calculated using 1-second bins in cleaned event files. If a bin has >2000 counts, and if more than 50% of those come from <1% of pixels, then it is considered to be noise-dominated and hence unusable.
| Quadrant | # 1 sec bins | Bins with >0 counts | Bins with >2000 counts | High rate bins dominated by noise | Noise dominated (total time) | Noise dominated (detector-on time) | Marked lightcurve |
|---|---|---|---|---|---|---|---|
| A | 7370 | 5248 | 1217 | 1217 | 16.51% | 23.19% | 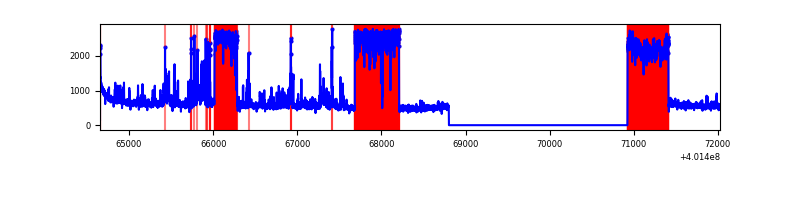 |
| B | 7370 | 5248 | 19 | 19 | 0.26% | 0.36% | 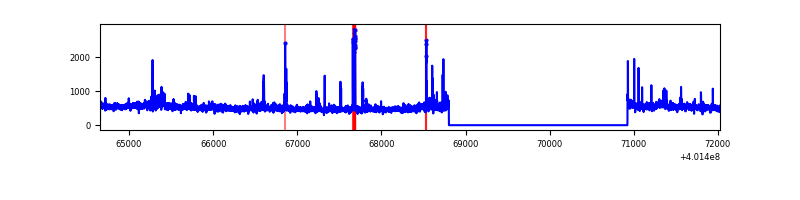 |
| C | 7370 | 5248 | 34 | 34 | 0.46% | 0.65% | 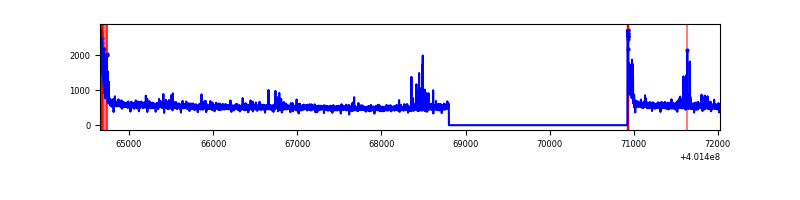 |
| D | 7370 | 5248 | 499 | 499 | 6.77% | 9.51% | 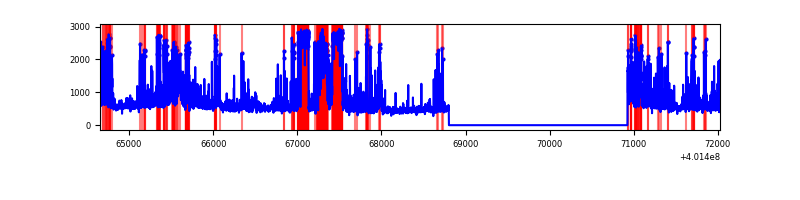 |
Top three noisy pixels from each quadrant. If the there are fewer than three noisy pixels in the level2.evt file, extra rows are filled as -1
| Pixel properties | Quadrant properties | ||||||
|---|---|---|---|---|---|---|---|
| Quadrant | DetID | PixID | Counts | Sigma | Mean | Median | Sigma |
| A | 15 | 222 | 2738104 | 24489.05 | 555 | 545 | 111.8 |
| A | 10 | 83 | 271456 | 2423.46 | 555 | 545 | 111.8 |
| A | 12 | 227 | 232150 | 2071.84 | 555 | 545 | 111.8 |
| B | 4 | 81 | 63538 | 524.32 | 648 | 633 | 120.0 |
| B | 0 | 230 | 45320 | 372.47 | 648 | 633 | 120.0 |
| B | 0 | 229 | 42467 | 348.69 | 648 | 633 | 120.0 |
| C | 15 | 214 | 225166 | 1535.67 | 638 | 644 | 146.2 |
| C | 0 | 10 | 174628 | 1190.0 | 638 | 644 | 146.2 |
| C | 14 | 254 | 34301 | 230.2 | 638 | 644 | 146.2 |
| D | 13 | 249 | 1007523 | 6765.03 | 619 | 604 | 148.8 |
| D | 2 | 249 | 386722 | 2594.15 | 619 | 604 | 148.8 |
| D | 2 | 250 | 205626 | 1377.45 | 619 | 604 | 148.8 |
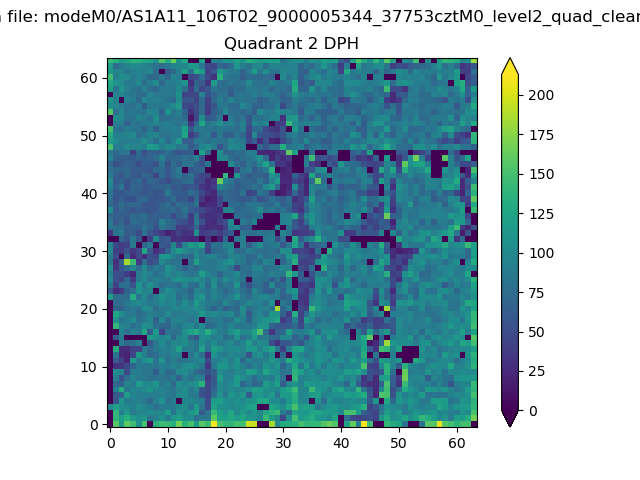
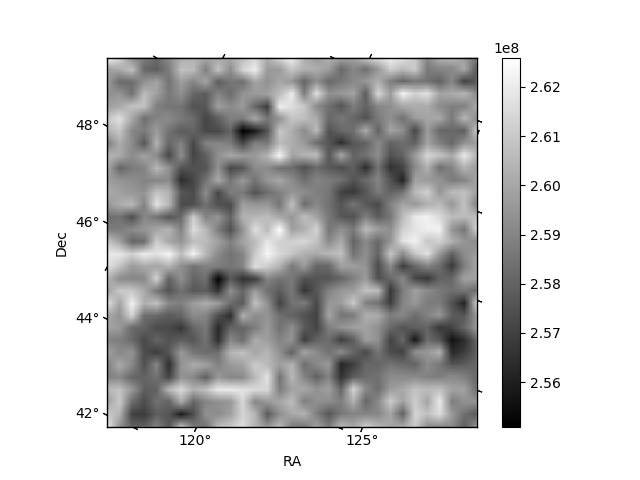
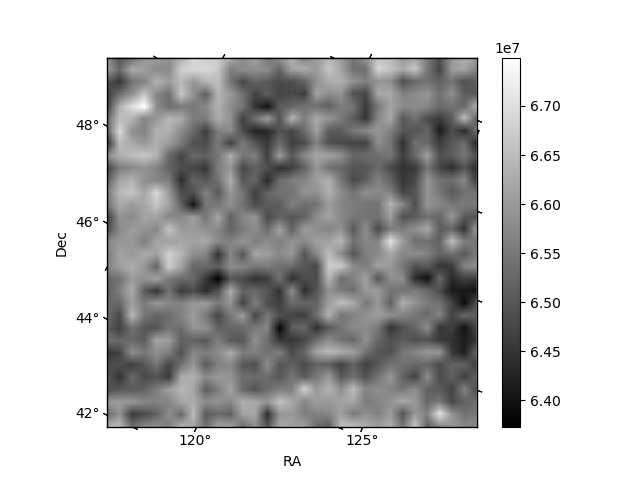
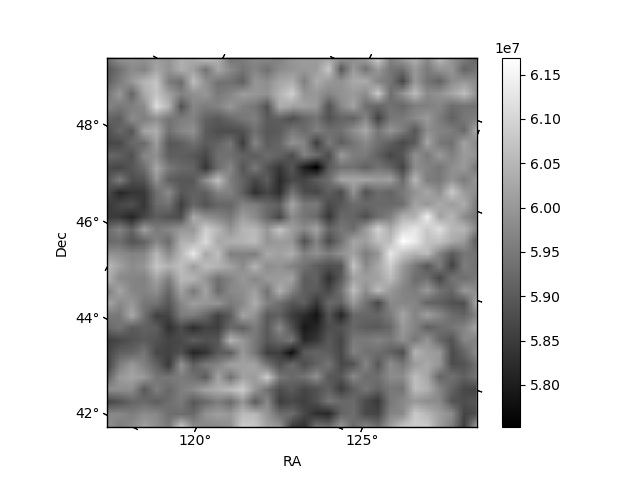
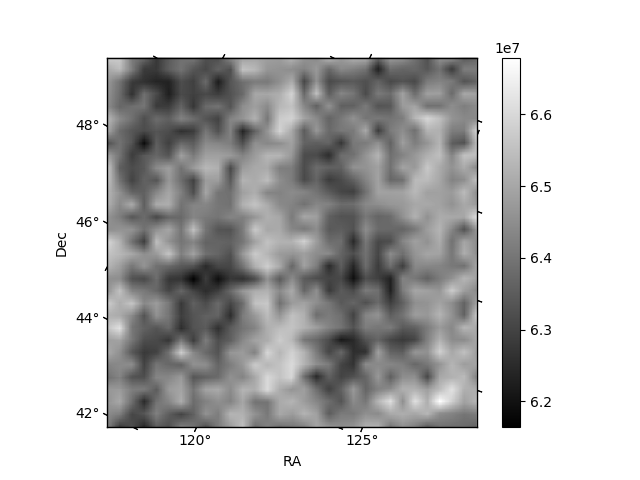
Histogram calculated using DETX and DETY for each event in the final _common_clean file
| Quadrant A | 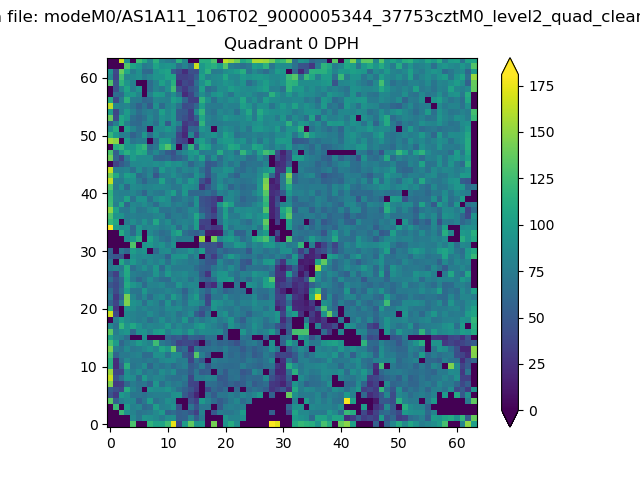 |
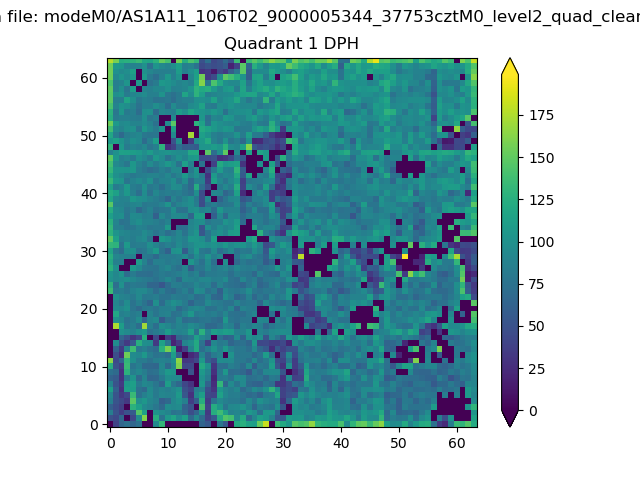 |
Quadrant B |
|---|---|---|---|
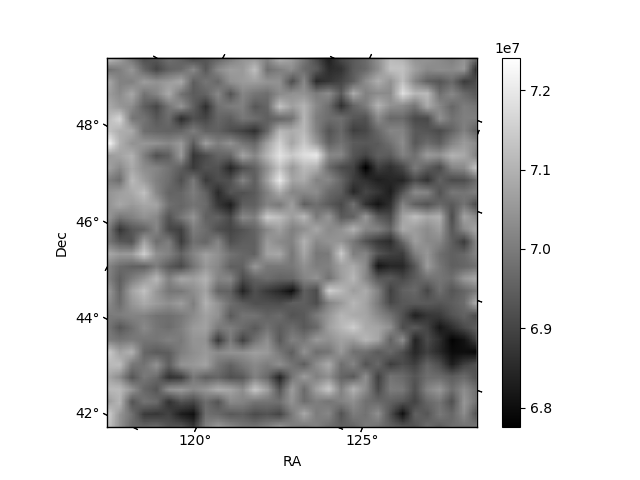
| Quadrant D | 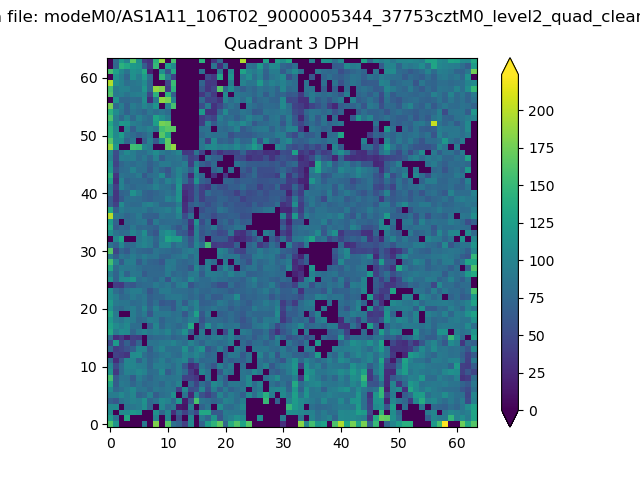 |
 |
Quadrant C |
| Plot type | Count rate plots | Images |
|---|---|---|
| Comparison with Poisson distribution Blue bars denote a histogram of data divided into 1 sec bins. Red curve is a Poisson curve with rate = median count rate of data. |
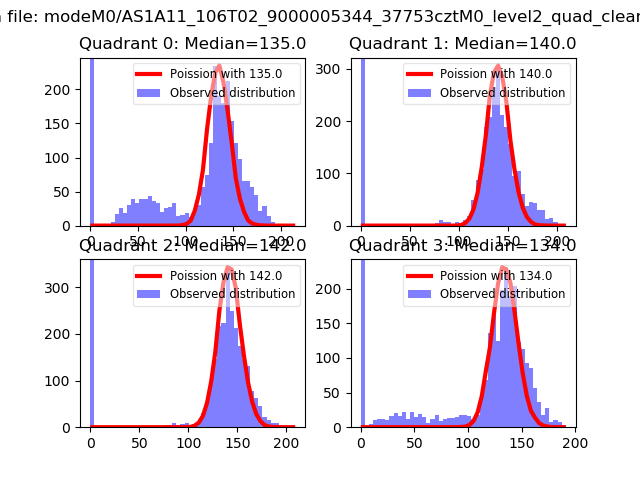 |
 |
| Quadrant-wise count rates Data is divided into 100 sec bins |
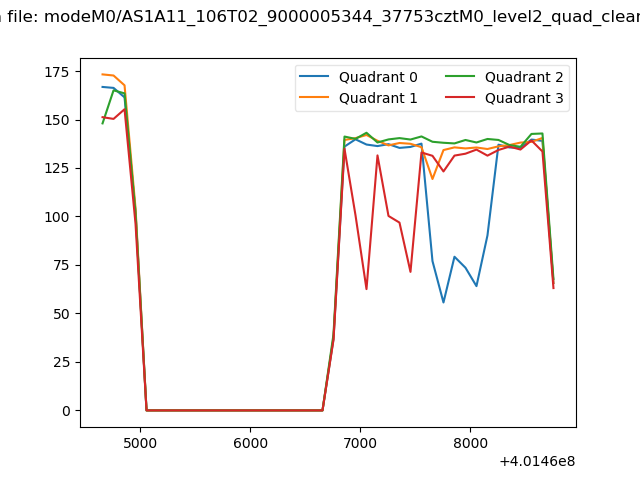 |
|
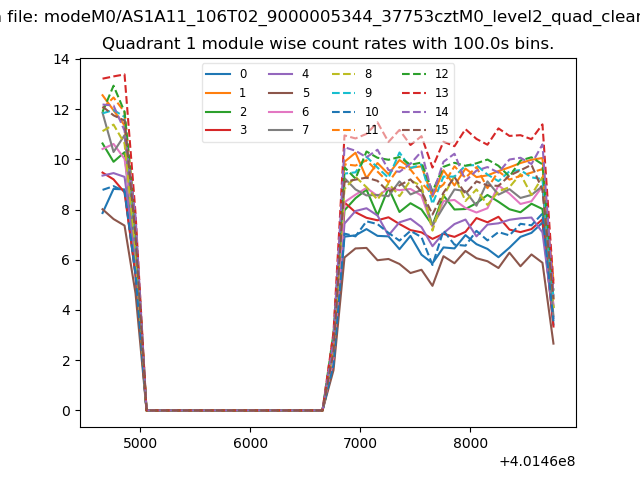
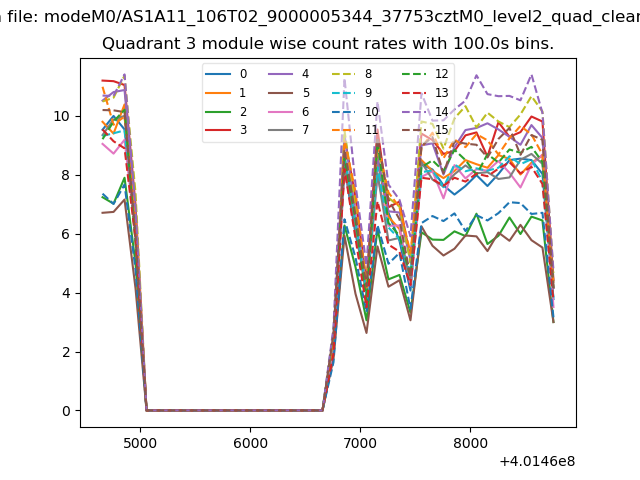
| Module-wise count rates for Quadrant A Data is divided into 100 sec bins |
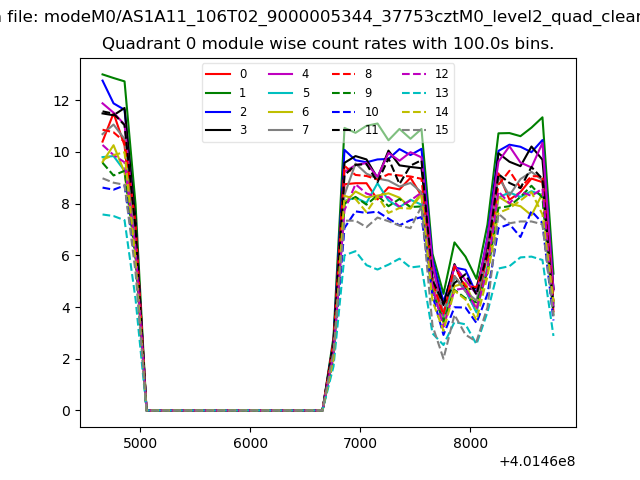 |
 |
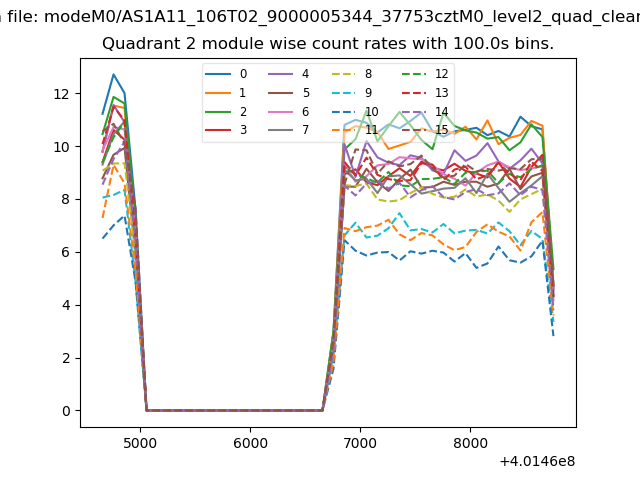
| Module-wise count rates for Quadrant B Data is divided into 100 sec bins |
 |
 |
| Module-wise count rates for Quadrant C Data is divided into 100 sec bins |
 |
 |
| Module-wise count rates for Quadrant D Data is divided into 100 sec bins |
 |
 |
| Parameter | Plot |
|---|---|
| CZT HV Monitor | 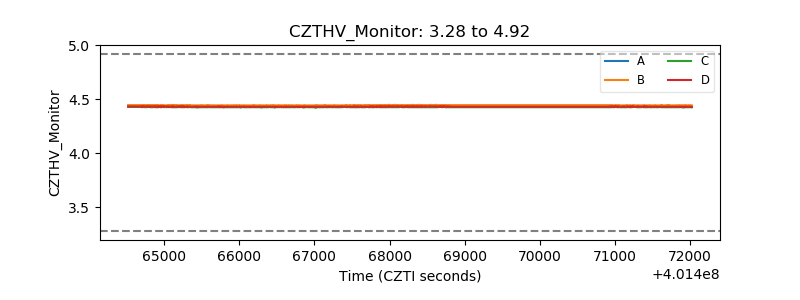 |
| D_VDD | 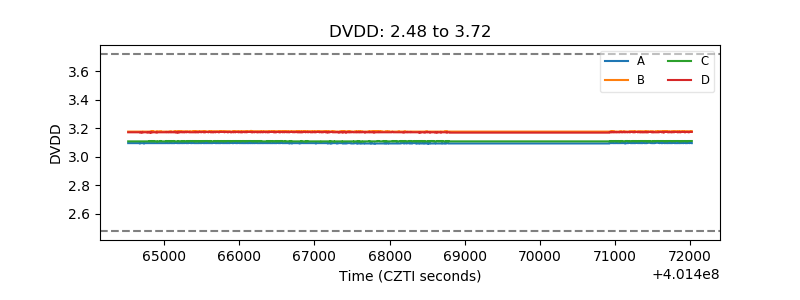 |
| Temperature 1 | 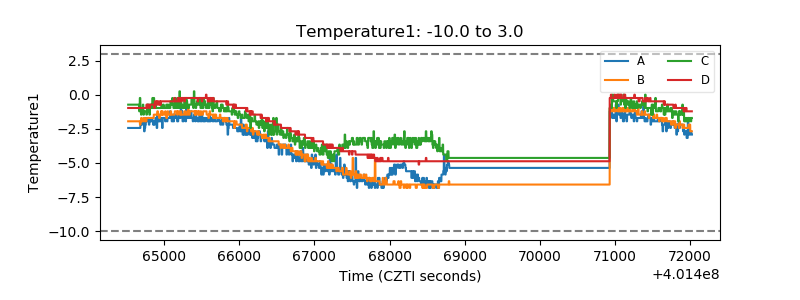 |
| Veto HV Monitor | 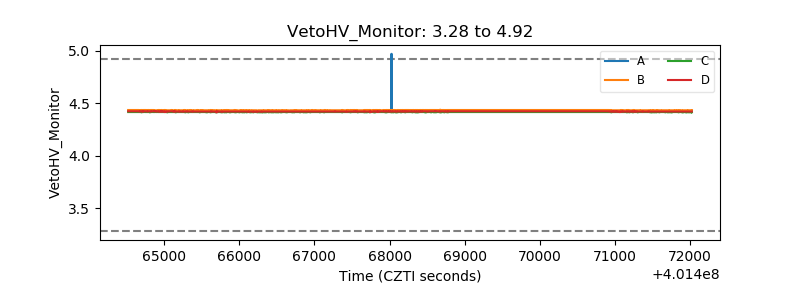 |
| Veto LLD | 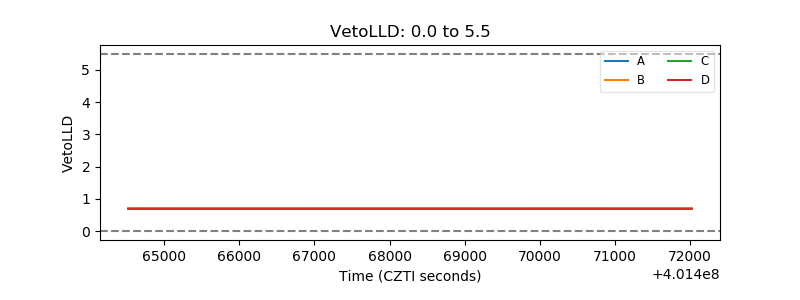 |
| Alpha Counter | 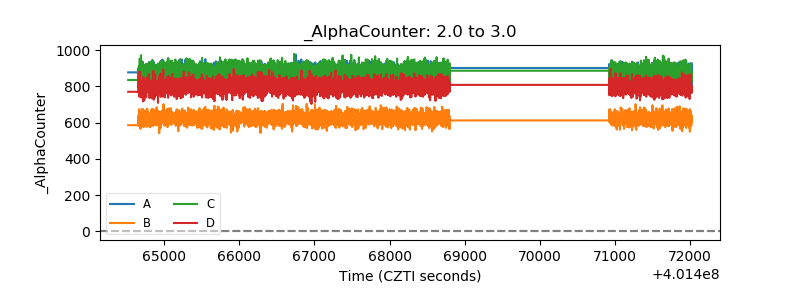 |
| _CPM_Rate | 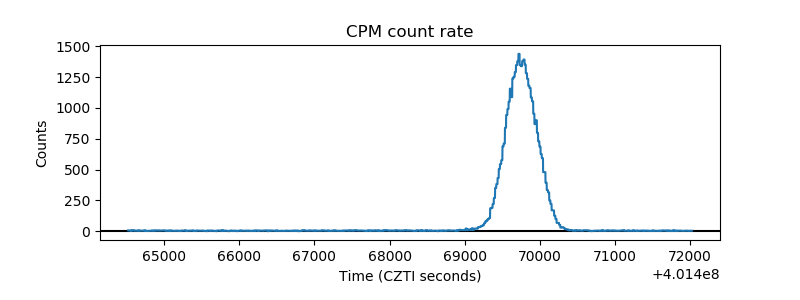 |
| CZT Counter | 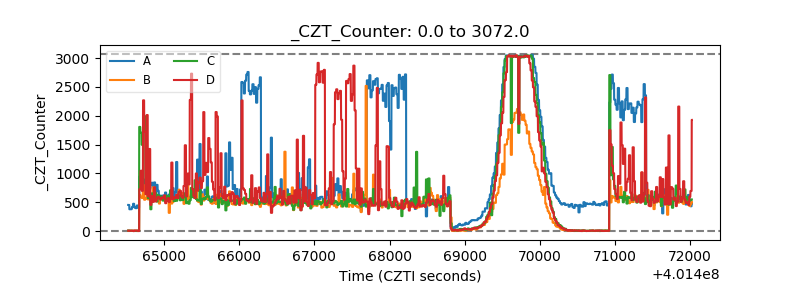 |
| +2.5 Volts monitor | 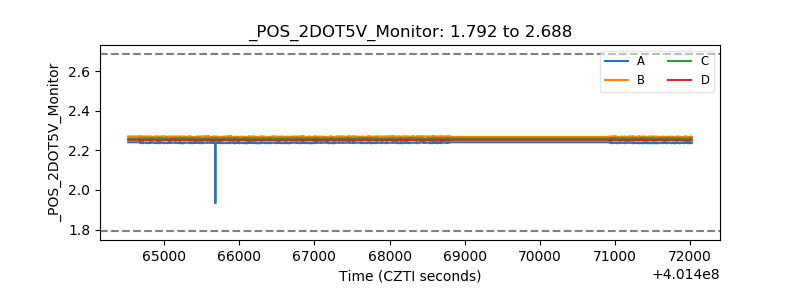 |
| +5 Volts monitor | 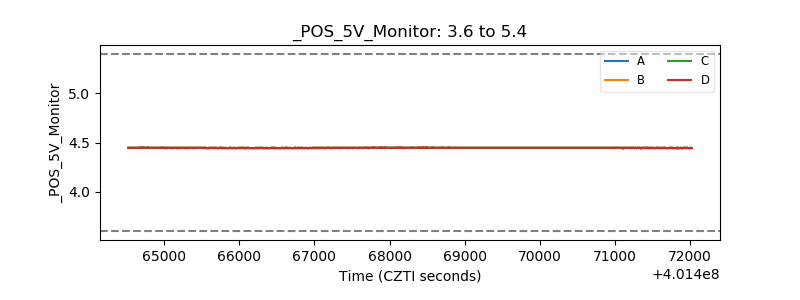 |
| _ROLL_ROT | 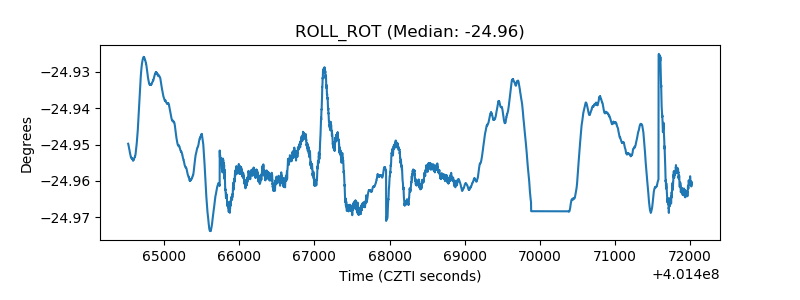 |
| _Roll_DEC | 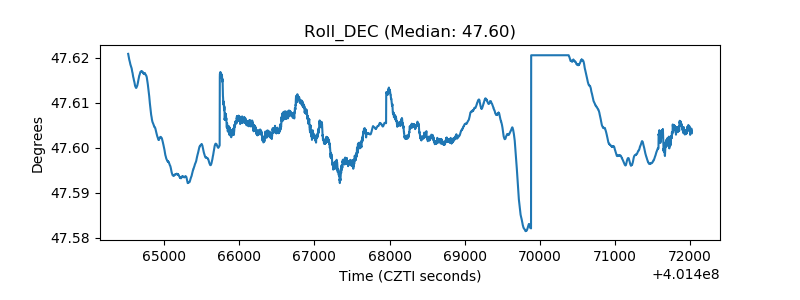 |
| _Roll_RA | 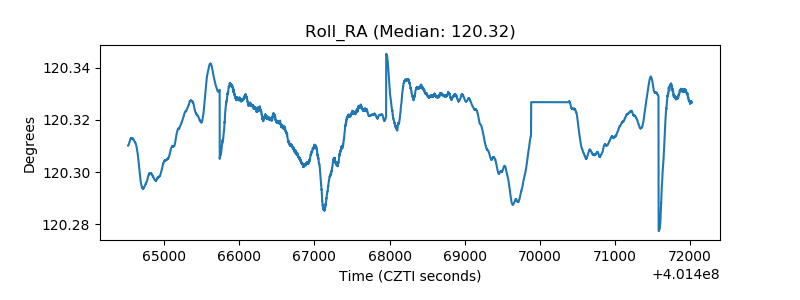 |
| Veto Counter | 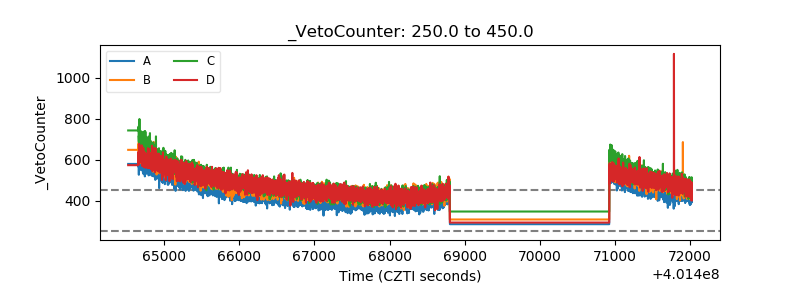 |