| Param | Original file | Final file |
|---|---|---|
| Filename | modeM0/AS1A11_106T02_9000005344_37755cztM0_level2.evt | modeM0/AS1A11_106T02_9000005344_37755cztM0_level2_quad_clean.evt |
| Size (bytes) | 655,467,840 | 52,061,760 |
| Size | 625.1 MB | 49.6 MB |
| Events in quadrant A | 9,950,098 | 64,428 |
| Events in quadrant B | 2,898,490 | 379,579 |
| Events in quadrant C | 2,739,350 | 393,127 |
| Events in quadrant D | 3,912,667 | 376,194 |
| Mode M9 | |||
|---|---|---|---|
| Quadrant | BADHDUFLAG | Total packets | Discarded packets |
| A | 0 | 28 | 0 |
| B | 0 | 28 | 0 |
| C | 0 | 28 | 0 |
| D | 0 | 29 | 0 |
| Mode SS | |||
|---|---|---|---|
| Quadrant | BADHDUFLAG | Total packets | Discarded packets |
| A | 0 | 106 | 0 |
| B | 0 | 106 | 0 |
| C | 0 | 106 | 0 |
| D | 0 | 106 | 0 |
| Mode M0 | |||
|---|---|---|---|
| Quadrant | BADHDUFLAG | Total packets | Discarded packets |
| A | 0 | 33104 | 3 |
| B | 0 | 11960 | 2 |
| C | 0 | 11175 | 2 |
| D | 0 | 15131 | 2 |
| Quadrant | Total seconds | Saturated seconds | Saturation percentage |
|---|---|---|---|
| A | 5154 | 4665 | 90.512224% |
| B | 5154 | 92 | 1.785021% |
| C | 5154 | 75 | 1.455180% |
| D | 5154 | 420 | 8.149010% |
Noise dominated data is calculated using 1-second bins in cleaned event files. If a bin has >2000 counts, and if more than 50% of those come from <1% of pixels, then it is considered to be noise-dominated and hence unusable.
| Quadrant | # 1 sec bins | Bins with >0 counts | Bins with >2000 counts | High rate bins dominated by noise | Noise dominated (total time) | Noise dominated (detector-on time) | Marked lightcurve |
|---|---|---|---|---|---|---|---|
| A | 7066 | 5153 | 2835 | 2835 | 40.12% | 55.02% | 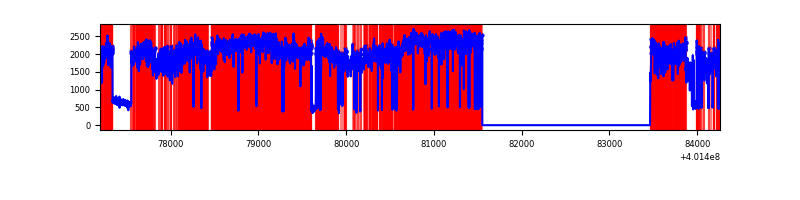 |
| B | 7067 | 5155 | 80 | 80 | 1.13% | 1.55% | 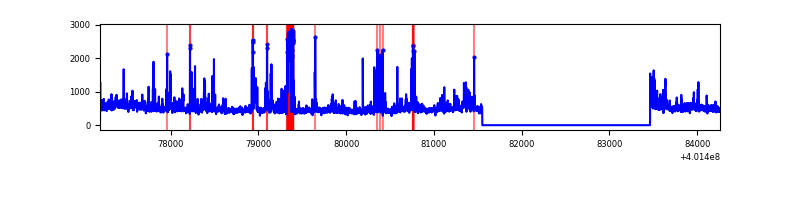 |
| C | 7067 | 5155 | 65 | 65 | 0.92% | 1.26% | 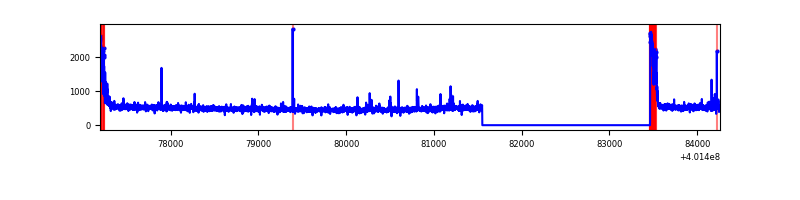 |
| D | 7067 | 5155 | 384 | 384 | 5.43% | 7.45% | 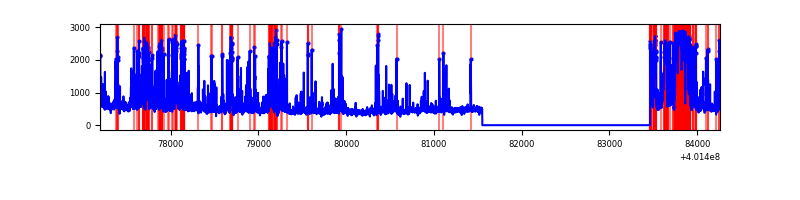 |
Top three noisy pixels from each quadrant. If the there are fewer than three noisy pixels in the level2.evt file, extra rows are filled as -1
| Pixel properties | Quadrant properties | ||||||
|---|---|---|---|---|---|---|---|
| Quadrant | DetID | PixID | Counts | Sigma | Mean | Median | Sigma |
| A | 15 | 222 | 9365965 | 346948.61 | 126 | 124 | 27.0 |
| A | 10 | 83 | 77063 | 2850.13 | 126 | 124 | 27.0 |
| A | 6 | 10 | 5227 | 189.04 | 126 | 124 | 27.0 |
| B | 4 | 81 | 243523 | 2194.97 | 577 | 562 | 110.7 |
| B | 5 | 255 | 144020 | 1296.04 | 577 | 562 | 110.7 |
| B | 0 | 229 | 89450 | 803.04 | 577 | 562 | 110.7 |
| C | 0 | 10 | 220202 | 1668.72 | 574 | 580 | 131.6 |
| C | 15 | 214 | 218469 | 1655.55 | 574 | 580 | 131.6 |
| C | 0 | 207 | 29274 | 218.02 | 574 | 580 | 131.6 |
| D | 13 | 249 | 616229 | 4586.98 | 551 | 537 | 134.2 |
| D | 2 | 249 | 459150 | 3416.72 | 551 | 537 | 134.2 |
| D | 2 | 250 | 357405 | 2658.71 | 551 | 537 | 134.2 |
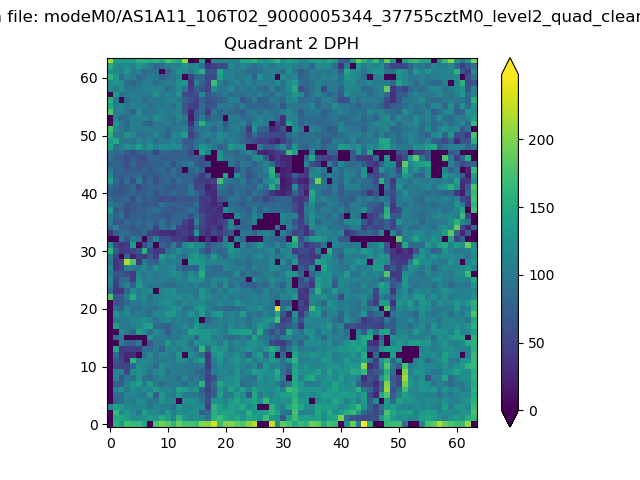
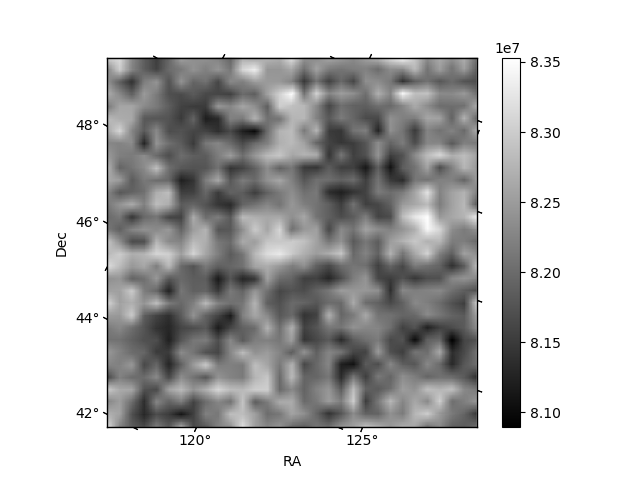
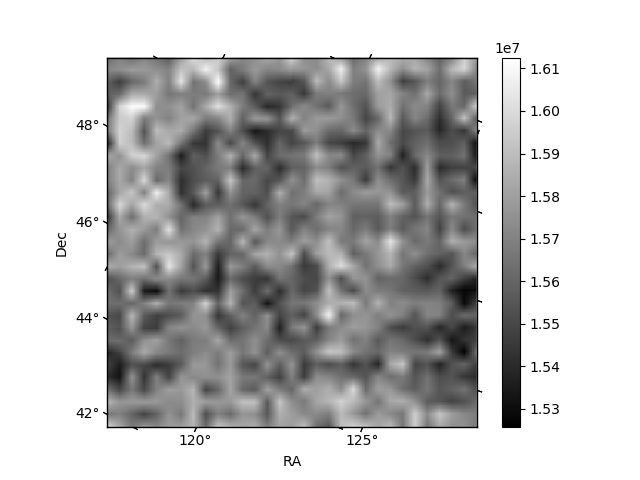
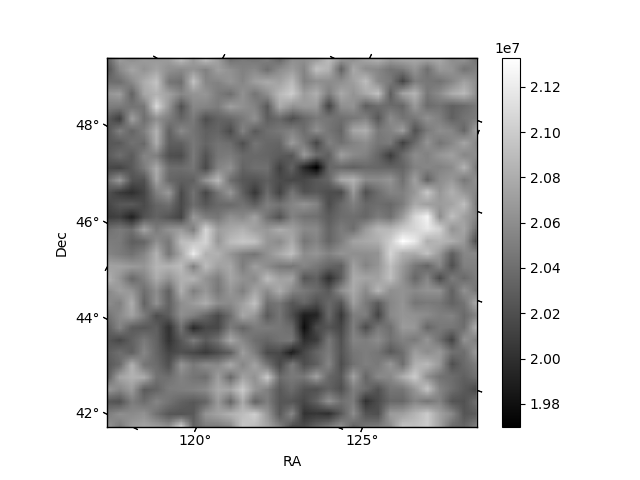
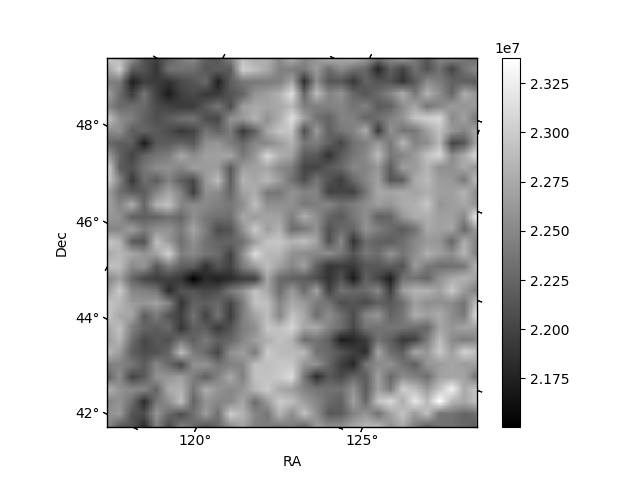
Histogram calculated using DETX and DETY for each event in the final _common_clean file
| Quadrant A | 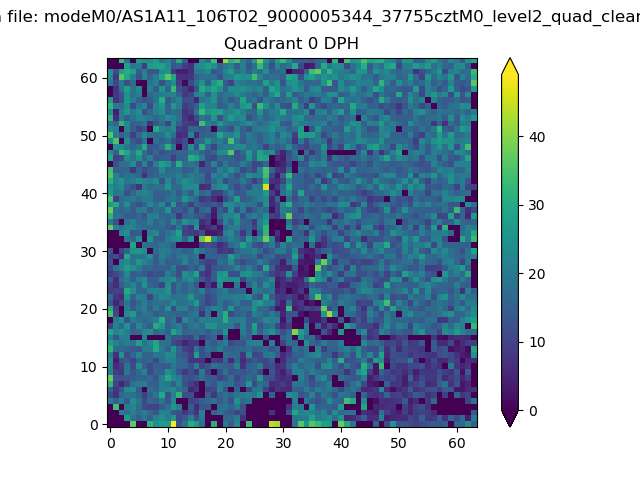 |
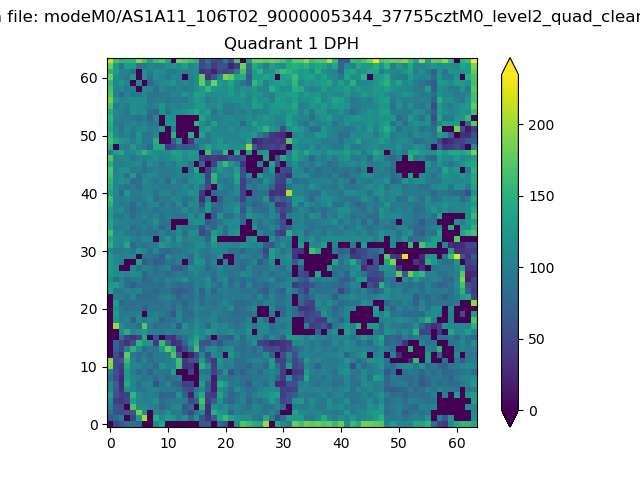 |
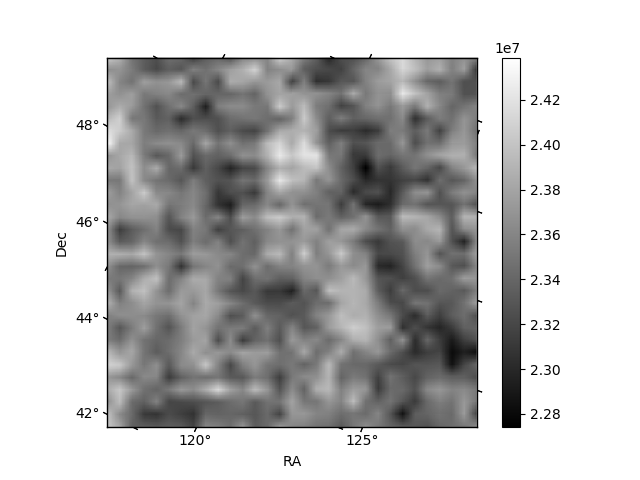
Quadrant B |
|---|---|---|---|
| Quadrant D | 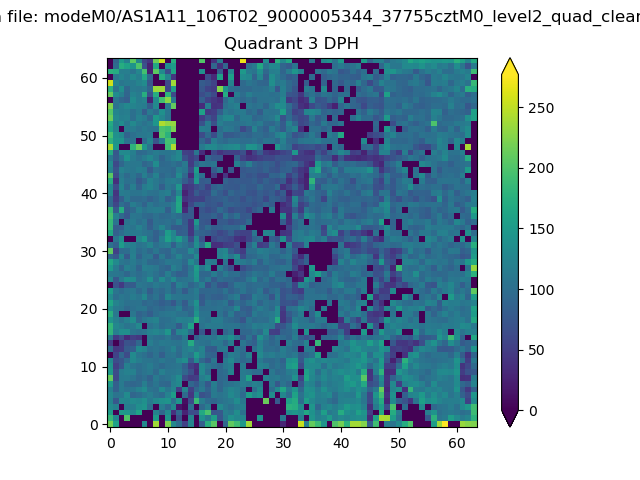 |
 |
Quadrant C |
| Plot type | Count rate plots | Images |
|---|---|---|
| Comparison with Poisson distribution Blue bars denote a histogram of data divided into 1 sec bins. Red curve is a Poisson curve with rate = median count rate of data. |
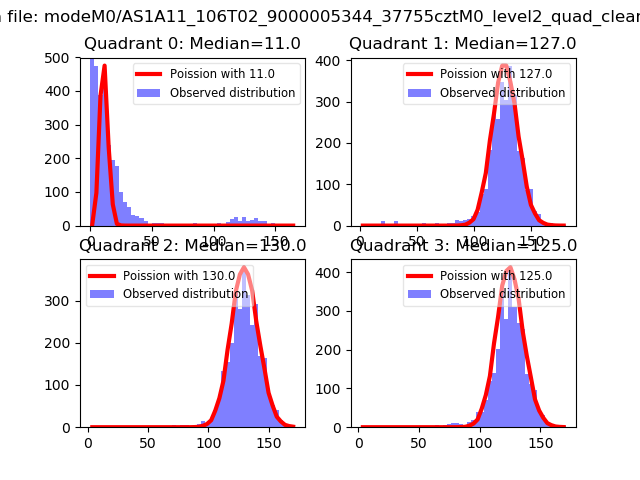 |
 |
| Quadrant-wise count rates Data is divided into 100 sec bins |
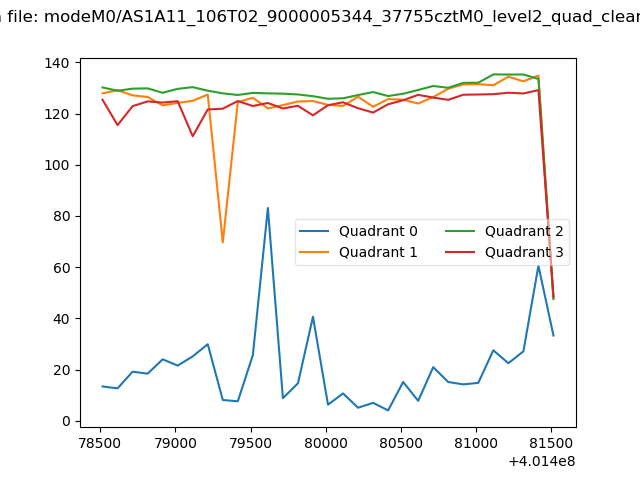 |
|
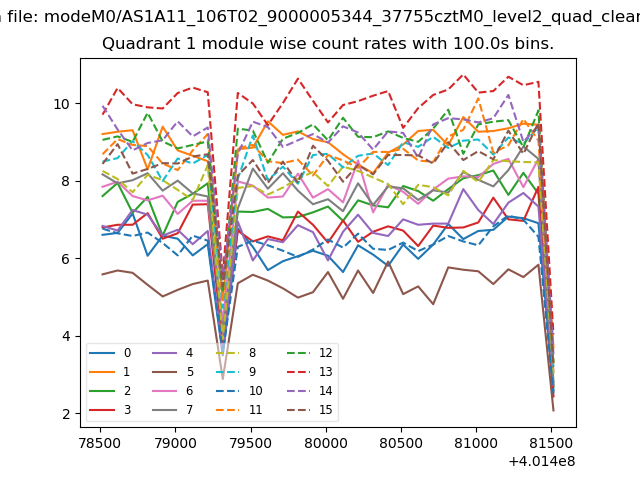
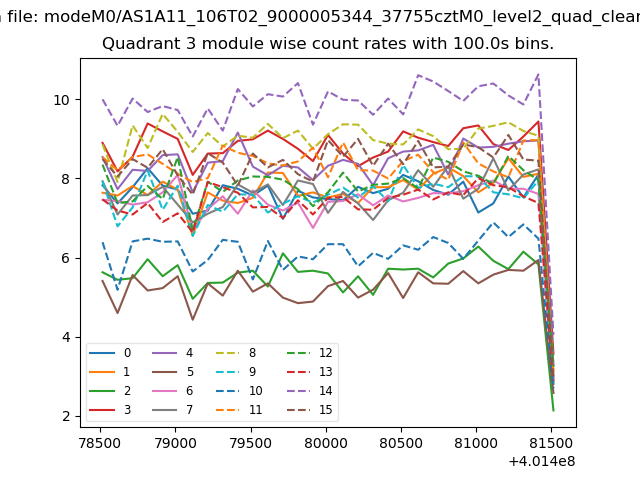
| Module-wise count rates for Quadrant A Data is divided into 100 sec bins |
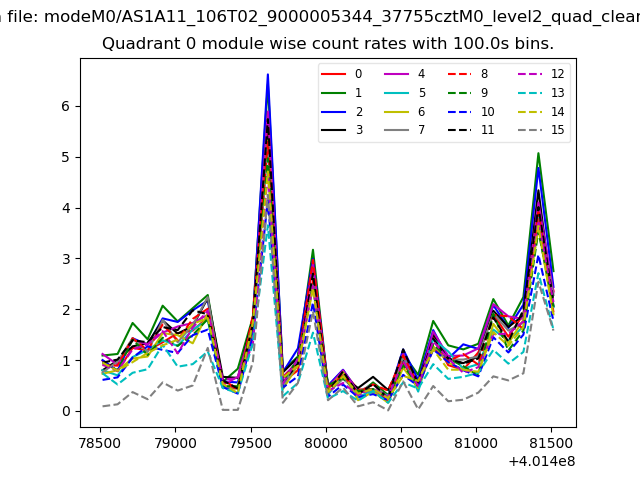 |
 |
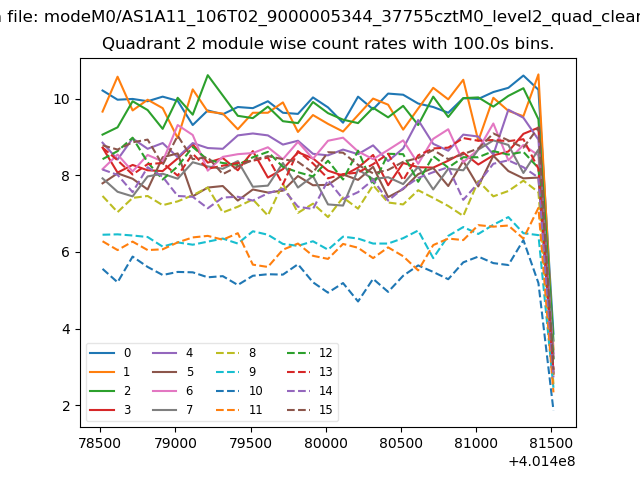
| Module-wise count rates for Quadrant B Data is divided into 100 sec bins |
 |
 |
| Module-wise count rates for Quadrant C Data is divided into 100 sec bins |
 |
 |
| Module-wise count rates for Quadrant D Data is divided into 100 sec bins |
 |
 |
| Parameter | Plot |
|---|---|
| CZT HV Monitor | 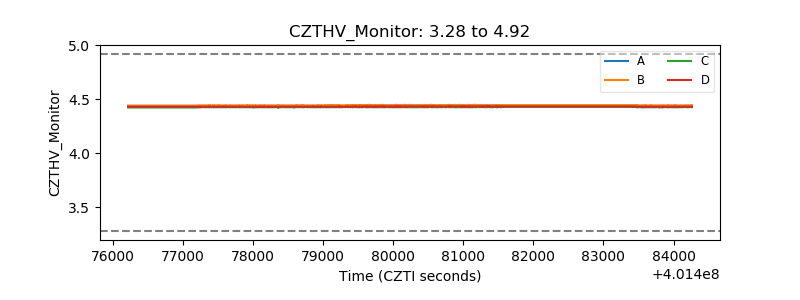 |
| D_VDD | 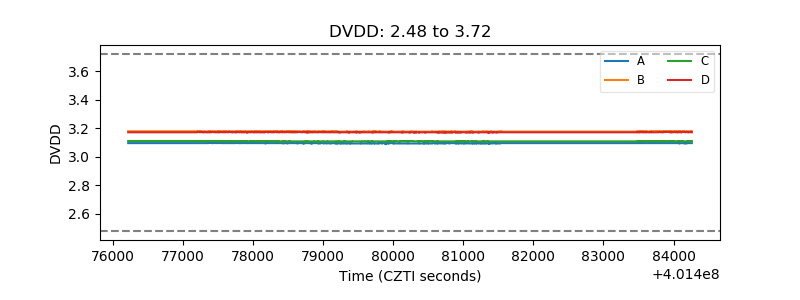 |
| Temperature 1 | 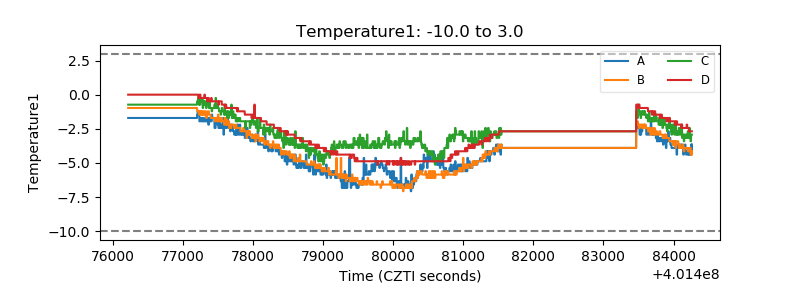 |
| Veto HV Monitor | 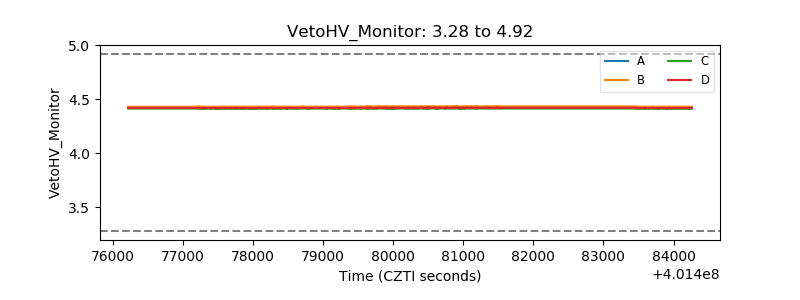 |
| Veto LLD | 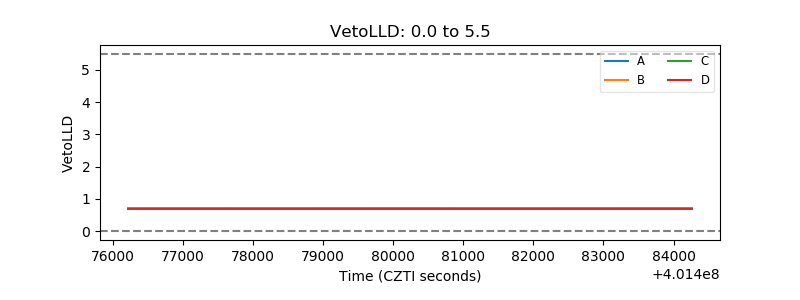 |
| Alpha Counter | 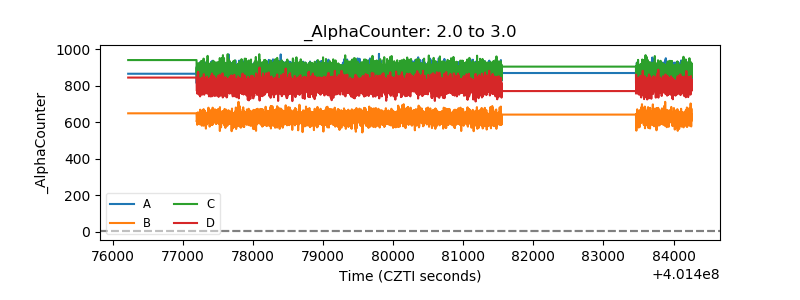 |
| _CPM_Rate | 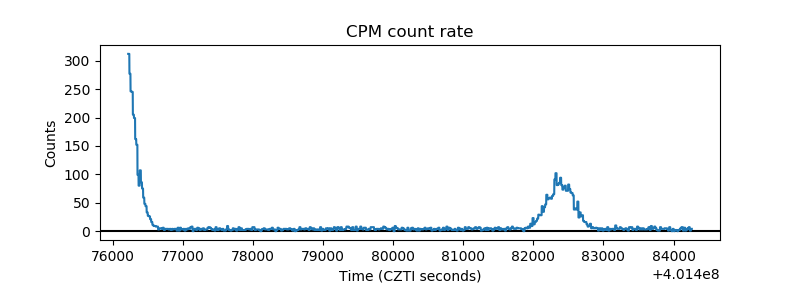 |
| CZT Counter | 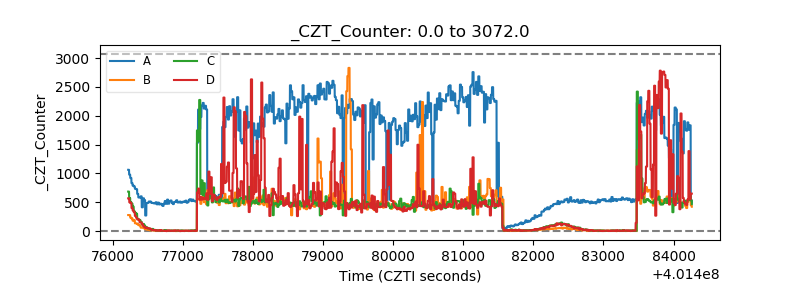 |
| +2.5 Volts monitor | 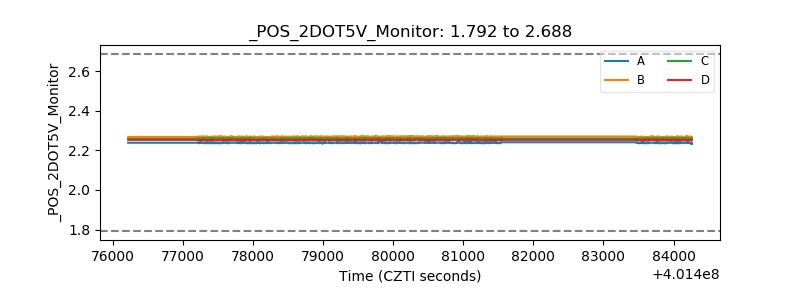 |
| +5 Volts monitor | 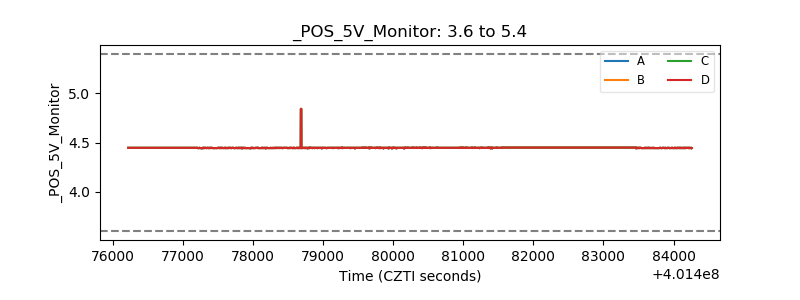 |
| _ROLL_ROT | 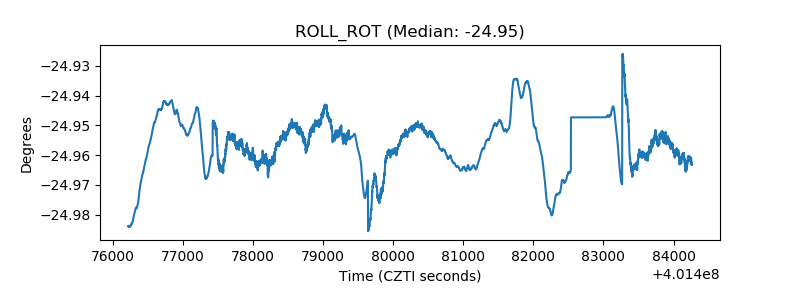 |
| _Roll_DEC | 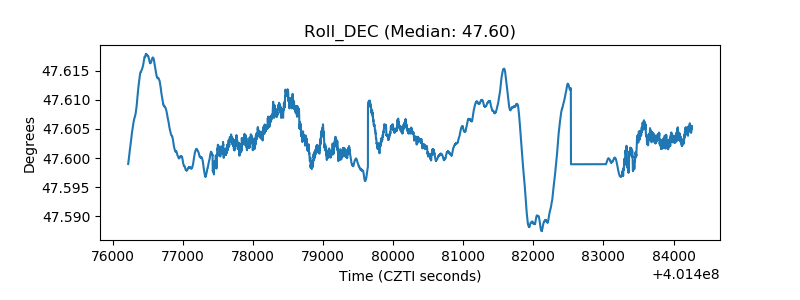 |
| _Roll_RA | 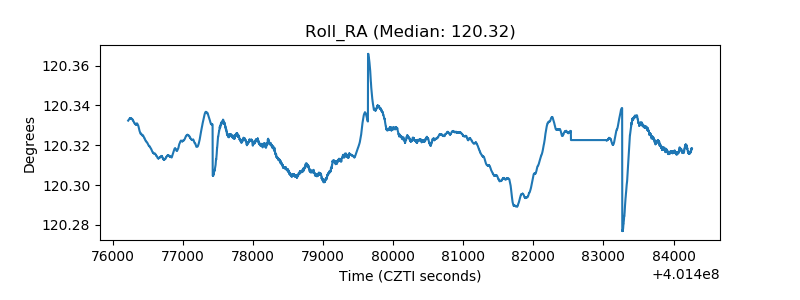 |
| Veto Counter | 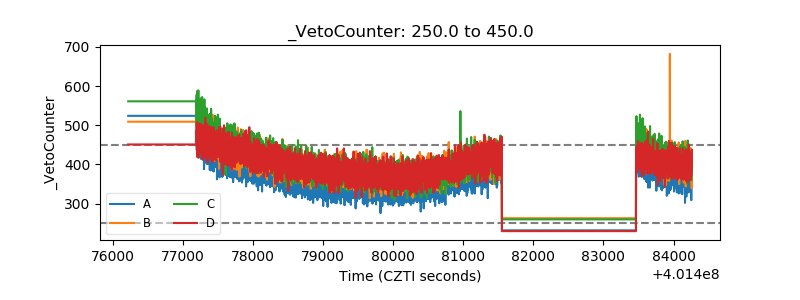 |