| Param | Original file | Final file |
|---|---|---|
| Filename | modeM0/AS1A11_106T02_9000005344_37756cztM0_level2.evt | modeM0/AS1A11_106T02_9000005344_37756cztM0_level2_quad_clean.evt |
| Size (bytes) | 497,649,600 | 78,598,080 |
| Size | 474.6 MB | 75.0 MB |
| Events in quadrant A | 4,561,286 | 495,248 |
| Events in quadrant B | 2,775,686 | 507,558 |
| Events in quadrant C | 3,042,944 | 514,070 |
| Events in quadrant D | 4,318,469 | 478,845 |
| Mode M9 | |||
|---|---|---|---|
| Quadrant | BADHDUFLAG | Total packets | Discarded packets |
| A | 0 | 19 | 0 |
| B | 0 | 19 | 0 |
| C | 0 | 19 | 0 |
| D | 0 | 20 | 0 |
| Mode SS | |||
|---|---|---|---|
| Quadrant | BADHDUFLAG | Total packets | Discarded packets |
| A | 0 | 112 | 0 |
| B | 0 | 112 | 0 |
| C | 0 | 112 | 0 |
| D | 0 | 112 | 0 |
| Mode M0 | |||
|---|---|---|---|
| Quadrant | BADHDUFLAG | Total packets | Discarded packets |
| A | 0 | 17151 | 3 |
| B | 0 | 11869 | 2 |
| C | 0 | 12424 | 2 |
| D | 0 | 16625 | 2 |
| Quadrant | Total seconds | Saturated seconds | Saturation percentage |
|---|---|---|---|
| A | 5491 | 924 | 16.827536% |
| B | 5491 | 33 | 0.600983% |
| C | 5491 | 99 | 1.802950% |
| D | 5491 | 533 | 9.706793% |
Noise dominated data is calculated using 1-second bins in cleaned event files. If a bin has >2000 counts, and if more than 50% of those come from <1% of pixels, then it is considered to be noise-dominated and hence unusable.
| Quadrant | # 1 sec bins | Bins with >0 counts | Bins with >2000 counts | High rate bins dominated by noise | Noise dominated (total time) | Noise dominated (detector-on time) | Marked lightcurve |
|---|---|---|---|---|---|---|---|
| A | 7074 | 5492 | 334 | 334 | 4.72% | 6.08% | 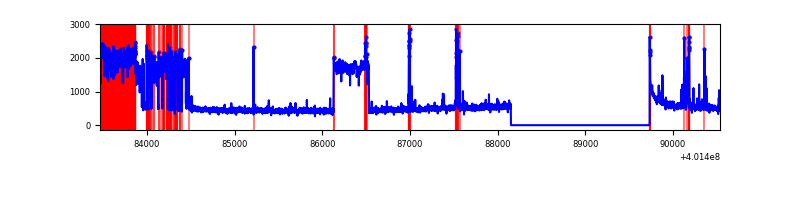 |
| B | 7074 | 5492 | 27 | 27 | 0.38% | 0.49% | 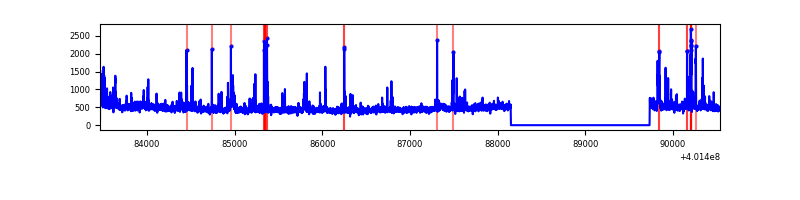 |
| C | 7074 | 5492 | 88 | 88 | 1.24% | 1.60% | 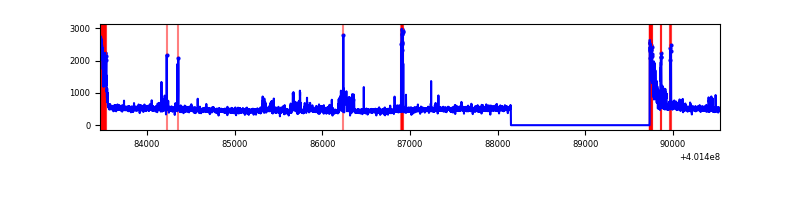 |
| D | 7074 | 5492 | 490 | 490 | 6.93% | 8.92% | 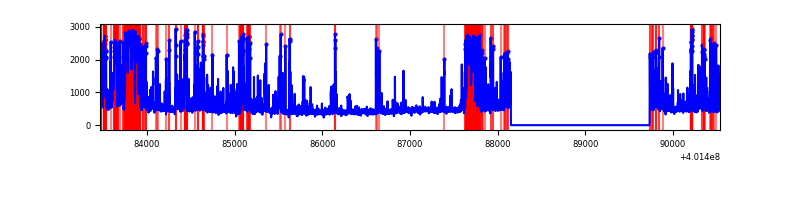 |
Top three noisy pixels from each quadrant. If the there are fewer than three noisy pixels in the level2.evt file, extra rows are filled as -1
| Pixel properties | Quadrant properties | ||||||
|---|---|---|---|---|---|---|---|
| Quadrant | DetID | PixID | Counts | Sigma | Mean | Median | Sigma |
| A | 15 | 222 | 2094578 | 19869.49 | 517 | 508 | 105.4 |
| A | 10 | 83 | 249821 | 2365.59 | 517 | 508 | 105.4 |
| A | 9 | 143 | 121341 | 1146.51 | 517 | 508 | 105.4 |
| B | 4 | 81 | 96257 | 822.04 | 606 | 591 | 116.4 |
| B | 5 | 255 | 75425 | 643.03 | 606 | 591 | 116.4 |
| B | 0 | 229 | 58615 | 498.59 | 606 | 591 | 116.4 |
| C | 15 | 214 | 229592 | 1649.69 | 598 | 603 | 138.8 |
| C | 0 | 10 | 210498 | 1512.13 | 598 | 603 | 138.8 |
| C | 0 | 207 | 183902 | 1320.53 | 598 | 603 | 138.8 |
| D | 2 | 250 | 722852 | 5237.03 | 567 | 553 | 137.9 |
| D | 13 | 249 | 722594 | 5235.16 | 567 | 553 | 137.9 |
| D | 7 | 223 | 266928 | 1931.35 | 567 | 553 | 137.9 |
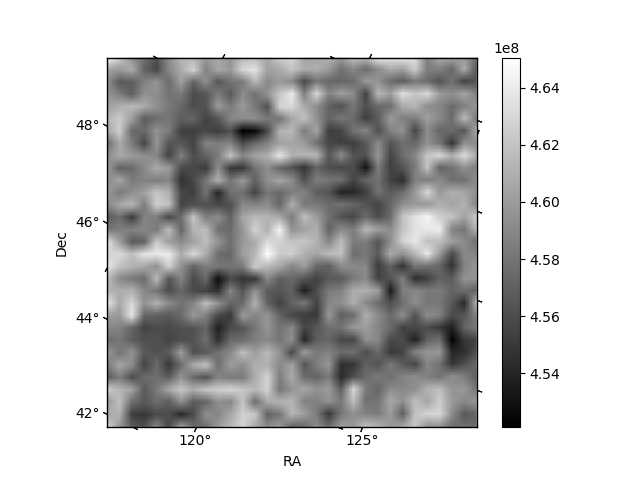
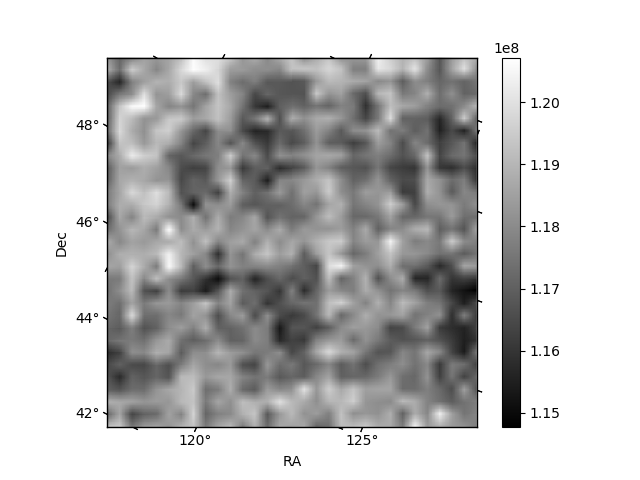
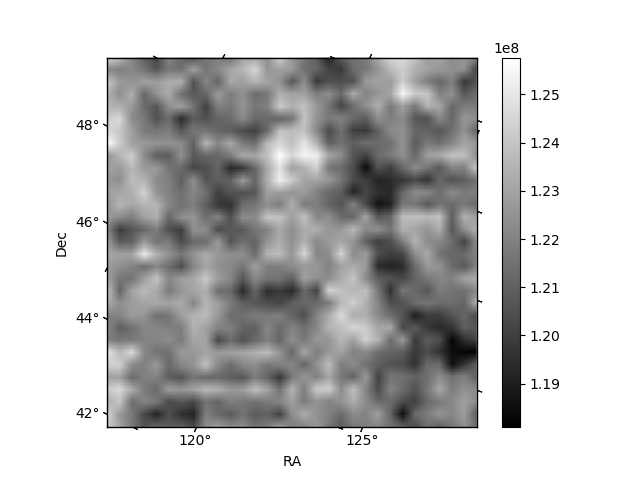
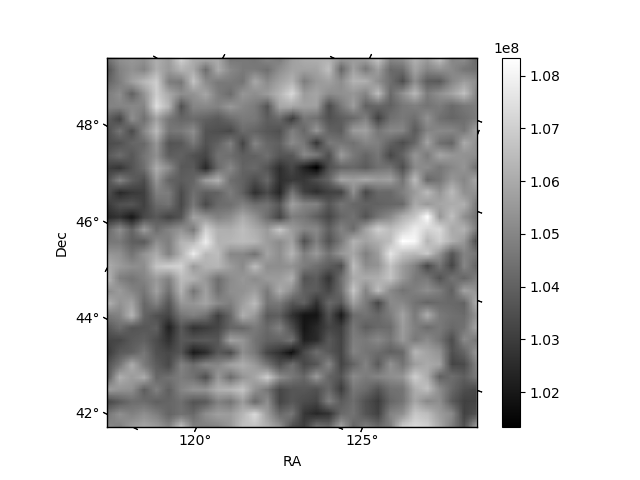
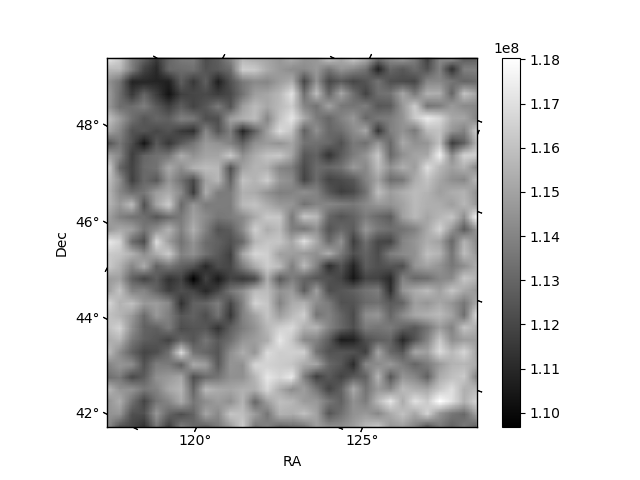
Histogram calculated using DETX and DETY for each event in the final _common_clean file
| Quadrant A | 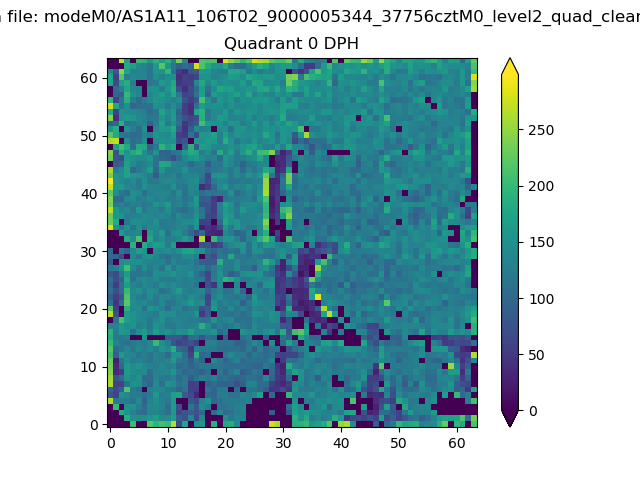 |
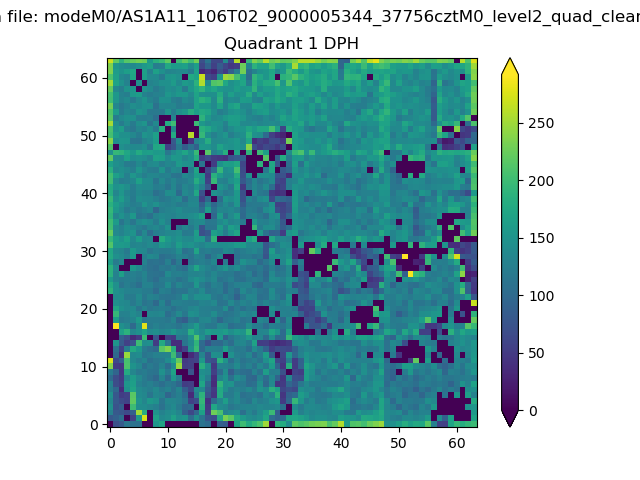 |
Quadrant B |
|---|---|---|---|
| Quadrant D | 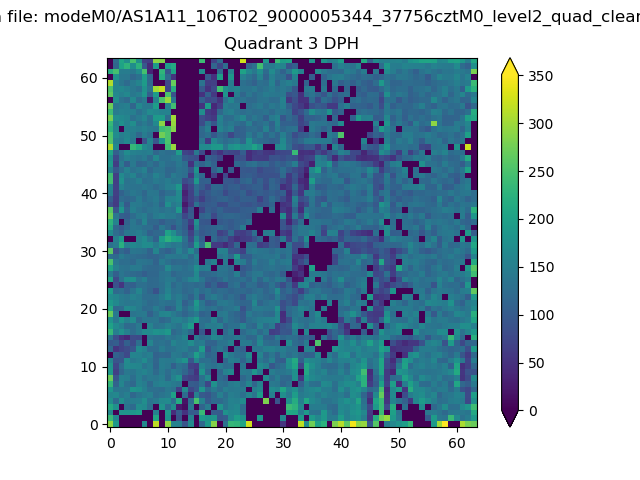 |
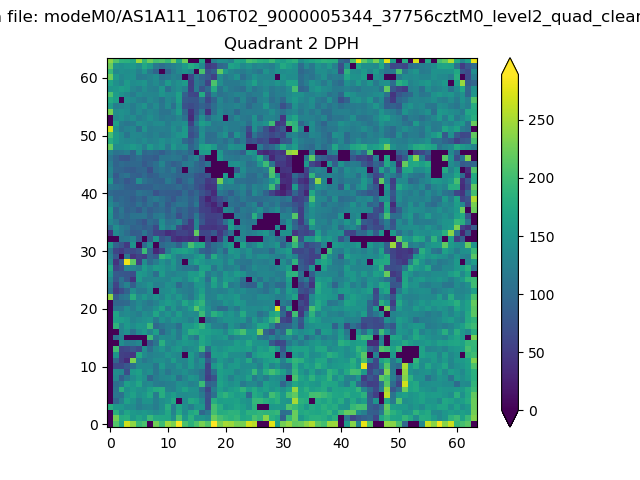 |
Quadrant C |
| Plot type | Count rate plots | Images |
|---|---|---|
| Comparison with Poisson distribution Blue bars denote a histogram of data divided into 1 sec bins. Red curve is a Poisson curve with rate = median count rate of data. |
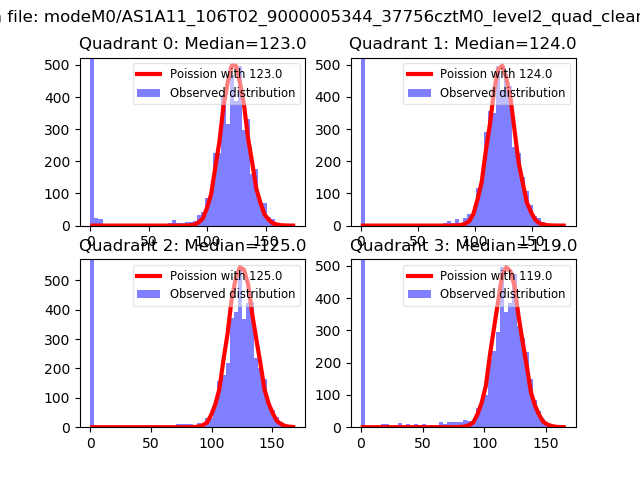 |
 |
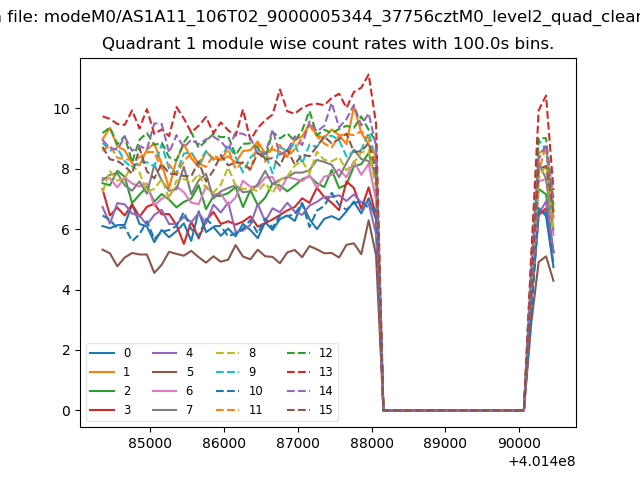
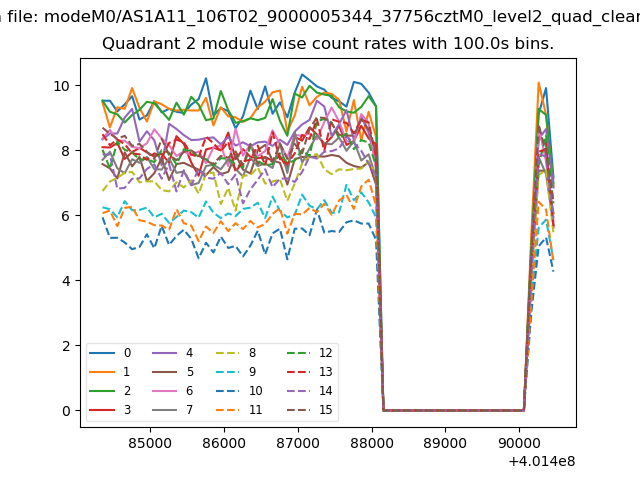
| Quadrant-wise count rates Data is divided into 100 sec bins |
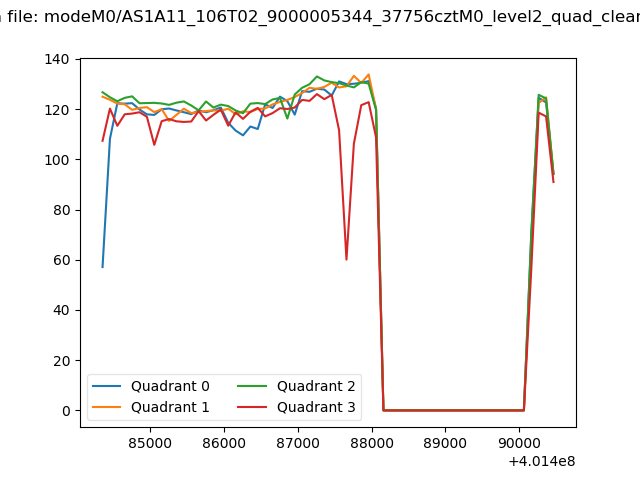 |
|
| Module-wise count rates for Quadrant A Data is divided into 100 sec bins |
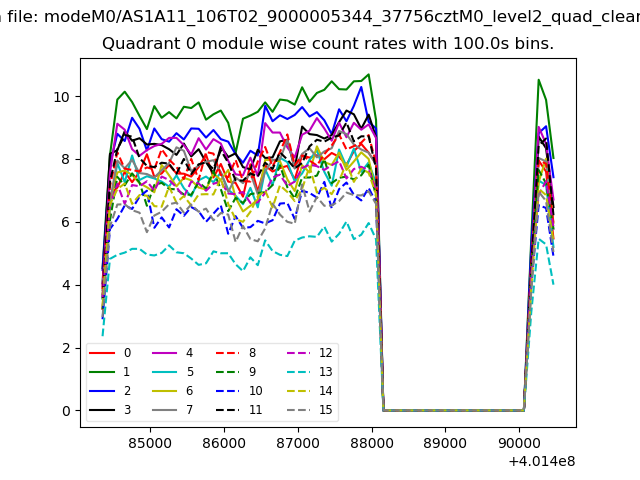 |
 |
| Module-wise count rates for Quadrant B Data is divided into 100 sec bins |
 |
 |
| Module-wise count rates for Quadrant C Data is divided into 100 sec bins |
 |
 |
| Module-wise count rates for Quadrant D Data is divided into 100 sec bins |
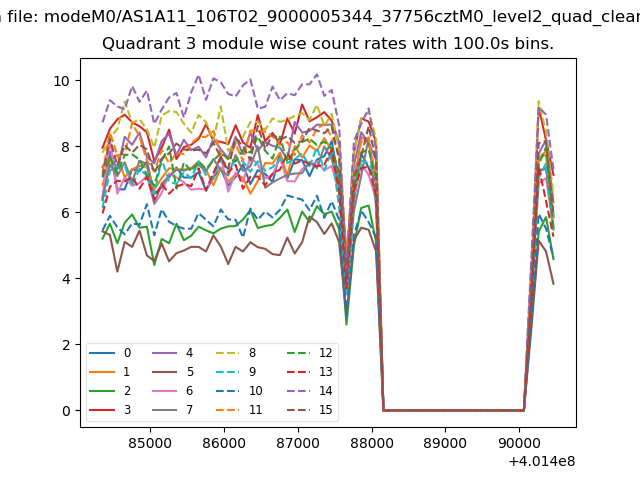 |
 |
| Parameter | Plot |
|---|---|
| CZT HV Monitor | 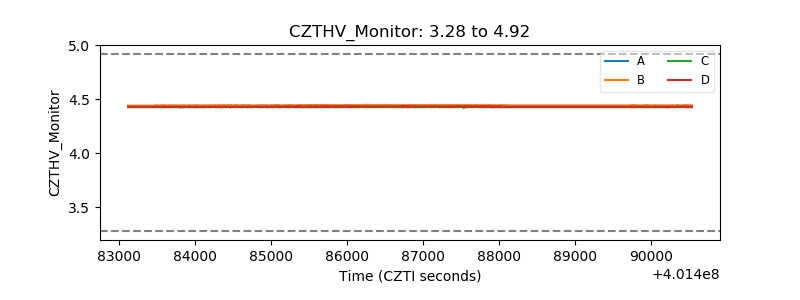 |
| D_VDD | 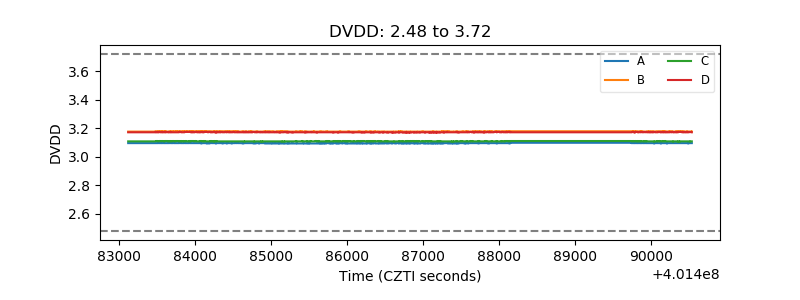 |
| Temperature 1 | 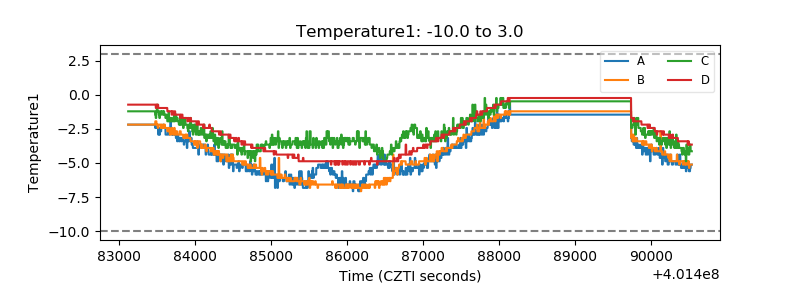 |
| Veto HV Monitor | 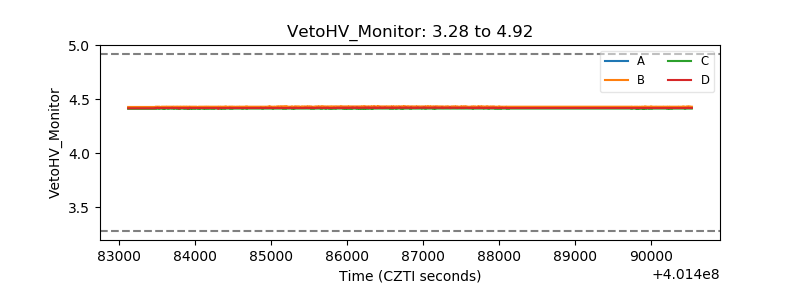 |
| Veto LLD | 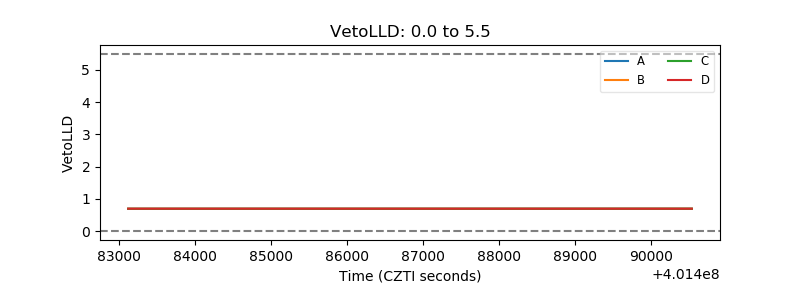 |
| Alpha Counter | 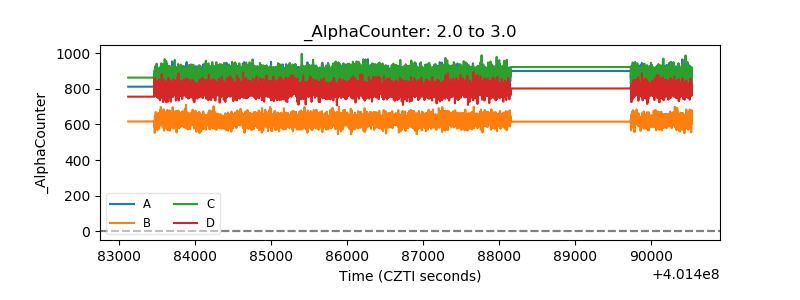 |
| _CPM_Rate | 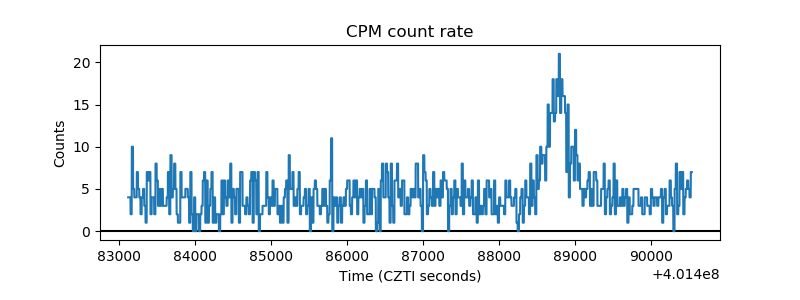 |
| CZT Counter | 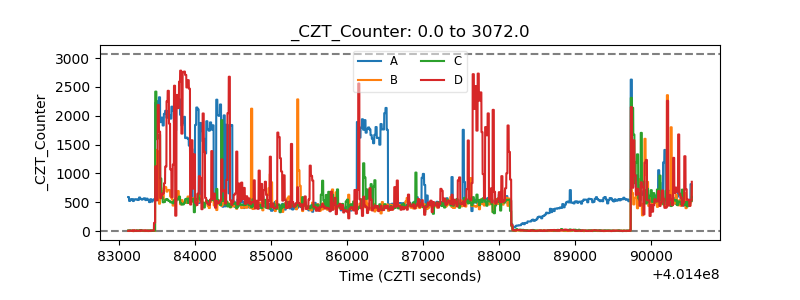 |
| +2.5 Volts monitor | 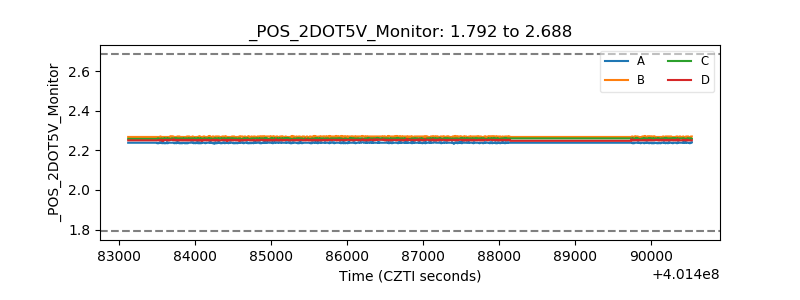 |
| +5 Volts monitor | 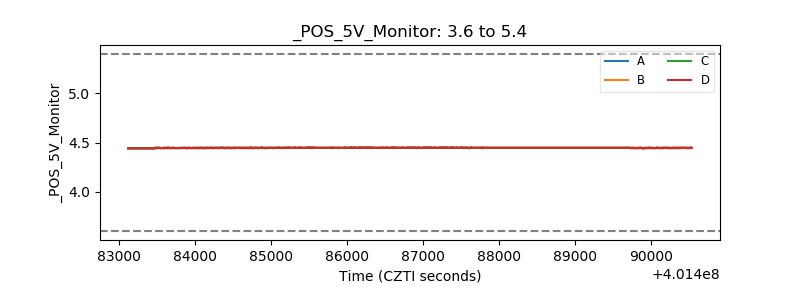 |
| _ROLL_ROT | 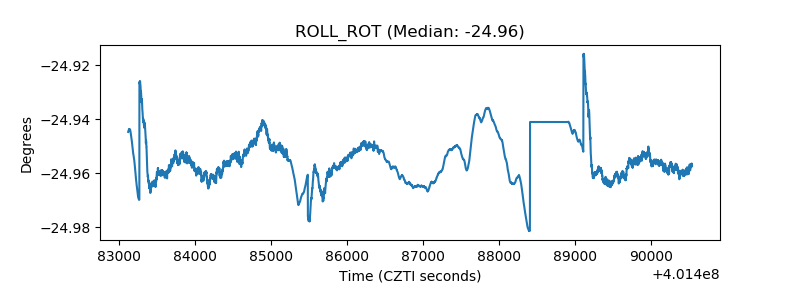 |
| _Roll_DEC | 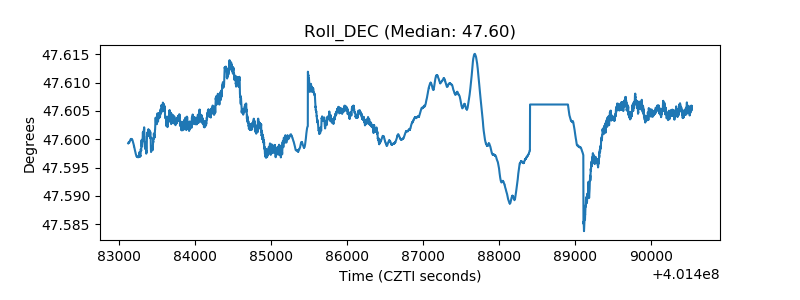 |
| _Roll_RA | 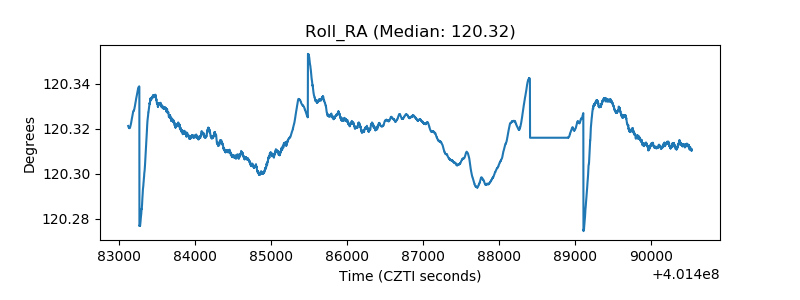 |
| Veto Counter | 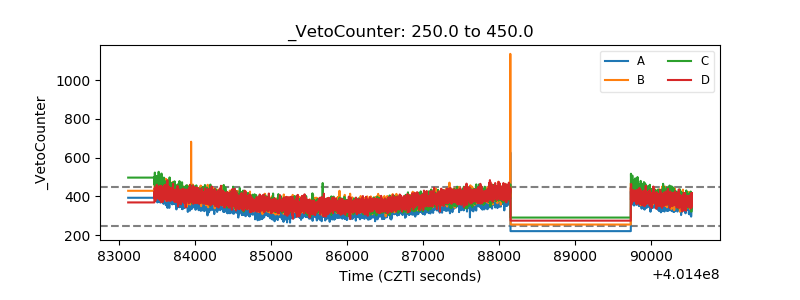 |