| Param | Original file | Final file |
|---|---|---|
| Filename | modeM0/AS1A11_106T02_9000005344_37757cztM0_level2.evt | modeM0/AS1A11_106T02_9000005344_37757cztM0_level2_quad_clean.evt |
| Size (bytes) | 484,413,120 | 89,628,480 |
| Size | 462.0 MB | 85.5 MB |
| Events in quadrant A | 3,105,890 | 585,874 |
| Events in quadrant B | 3,258,304 | 578,265 |
| Events in quadrant C | 3,786,475 | 592,607 |
| Events in quadrant D | 4,126,546 | 552,107 |
| Mode M9 | |||
|---|---|---|---|
| Quadrant | BADHDUFLAG | Total packets | Discarded packets |
| A | 0 | 21 | 0 |
| B | 0 | 21 | 0 |
| C | 0 | 21 | 0 |
| D | 0 | 22 | 0 |
| Mode SS | |||
|---|---|---|---|
| Quadrant | BADHDUFLAG | Total packets | Discarded packets |
| A | 0 | 118 | 0 |
| B | 0 | 118 | 0 |
| C | 0 | 118 | 0 |
| D | 0 | 118 | 0 |
| Mode M0 | |||
|---|---|---|---|
| Quadrant | BADHDUFLAG | Total packets | Discarded packets |
| A | 0 | 12996 | 3 |
| B | 0 | 13678 | 2 |
| C | 0 | 15118 | 2 |
| D | 0 | 16362 | 2 |
| Quadrant | Total seconds | Saturated seconds | Saturation percentage |
|---|---|---|---|
| A | 5796 | 36 | 0.621118% |
| B | 5796 | 176 | 3.036577% |
| C | 5796 | 60 | 1.035197% |
| D | 5796 | 345 | 5.952381% |
Noise dominated data is calculated using 1-second bins in cleaned event files. If a bin has >2000 counts, and if more than 50% of those come from <1% of pixels, then it is considered to be noise-dominated and hence unusable.
| Quadrant | # 1 sec bins | Bins with >0 counts | Bins with >2000 counts | High rate bins dominated by noise | Noise dominated (total time) | Noise dominated (detector-on time) | Marked lightcurve |
|---|---|---|---|---|---|---|---|
| A | 7139 | 5797 | 28 | 28 | 0.39% | 0.48% | 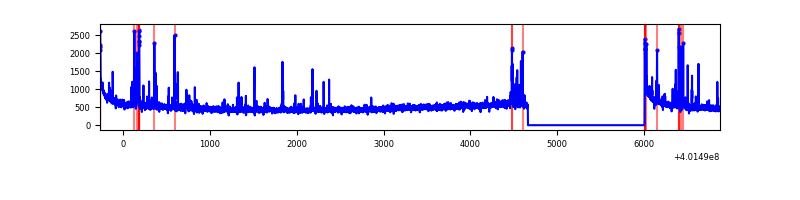 |
| B | 7139 | 5797 | 146 | 146 | 2.05% | 2.52% | 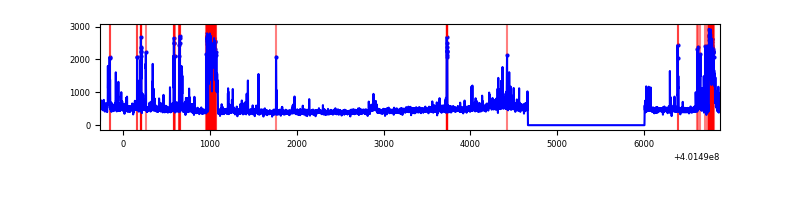 |
| C | 7139 | 5797 | 52 | 52 | 0.73% | 0.90% | 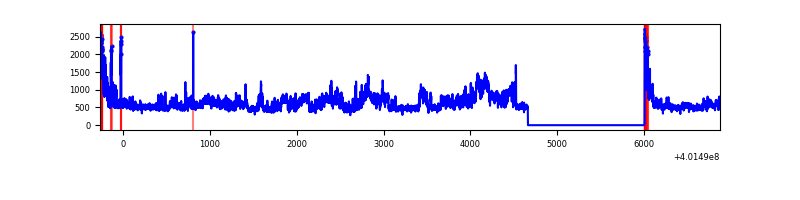 |
| D | 7139 | 5797 | 364 | 364 | 5.10% | 6.28% | 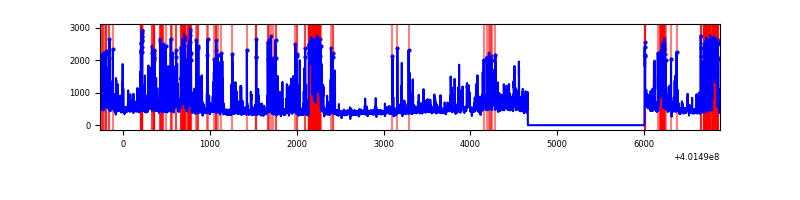 |
Top three noisy pixels from each quadrant. If the there are fewer than three noisy pixels in the level2.evt file, extra rows are filled as -1
| Pixel properties | Quadrant properties | ||||||
|---|---|---|---|---|---|---|---|
| Quadrant | DetID | PixID | Counts | Sigma | Mean | Median | Sigma |
| A | 10 | 83 | 351604 | 2687.16 | 642 | 629 | 130.6 |
| A | 15 | 254 | 180323 | 1375.79 | 642 | 629 | 130.6 |
| A | 9 | 143 | 46646 | 352.32 | 642 | 629 | 130.6 |
| B | 4 | 81 | 406355 | 3342.1 | 631 | 615 | 121.4 |
| B | 5 | 255 | 129695 | 1063.24 | 631 | 615 | 121.4 |
| B | 0 | 229 | 59167 | 482.3 | 631 | 615 | 121.4 |
| C | 0 | 207 | 894936 | 6153.32 | 625 | 629 | 145.3 |
| C | 15 | 214 | 244228 | 1676.09 | 625 | 629 | 145.3 |
| C | 0 | 10 | 150615 | 1031.99 | 625 | 629 | 145.3 |
| D | 2 | 250 | 1114017 | 7424.98 | 614 | 597 | 150.0 |
| D | 7 | 223 | 162849 | 1082.0 | 614 | 597 | 150.0 |
| D | 2 | 249 | 111575 | 740.07 | 614 | 597 | 150.0 |
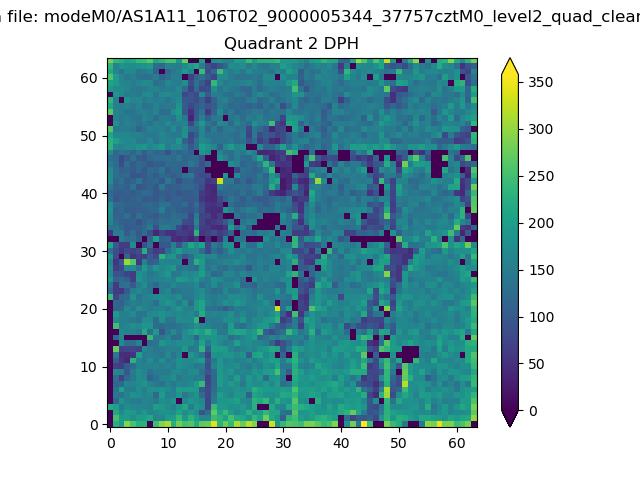
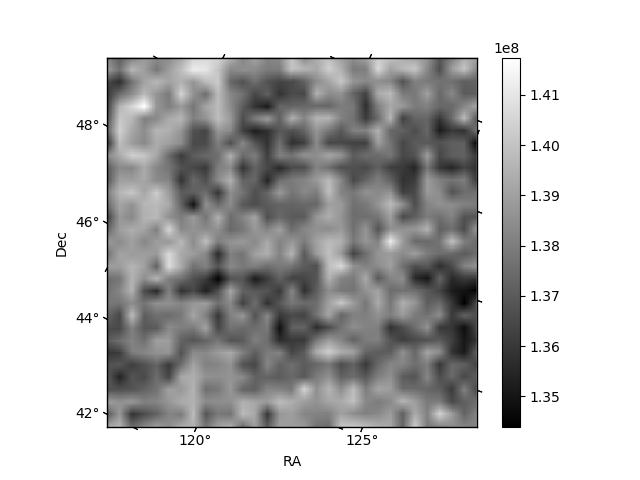
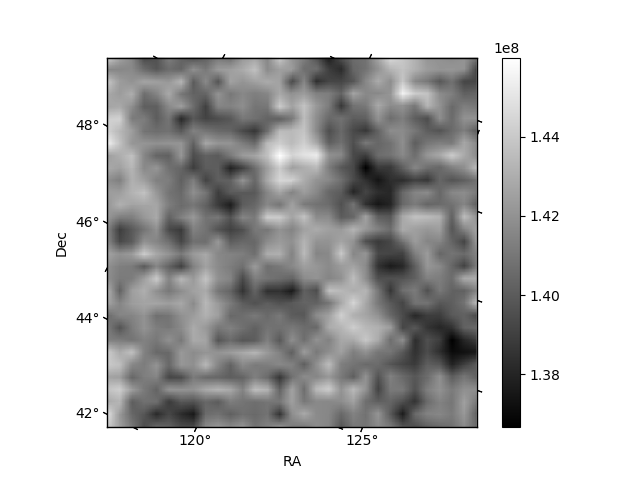
Histogram calculated using DETX and DETY for each event in the final _common_clean file
| Quadrant A | 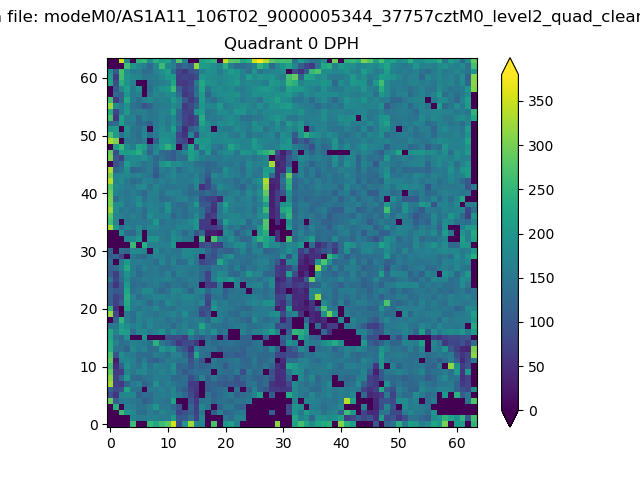 |
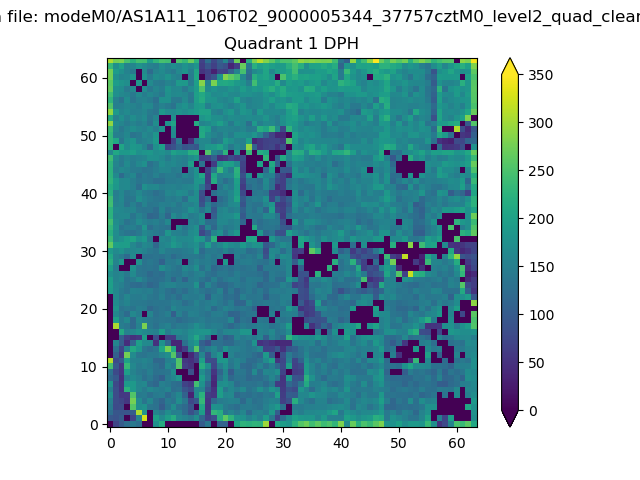 |
Quadrant B |
|---|---|---|---|
| Quadrant D | 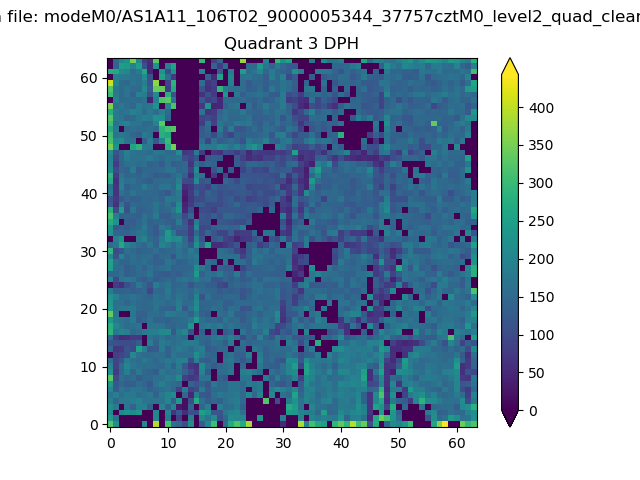 |
 |
Quadrant C |
| Plot type | Count rate plots | Images |
|---|---|---|
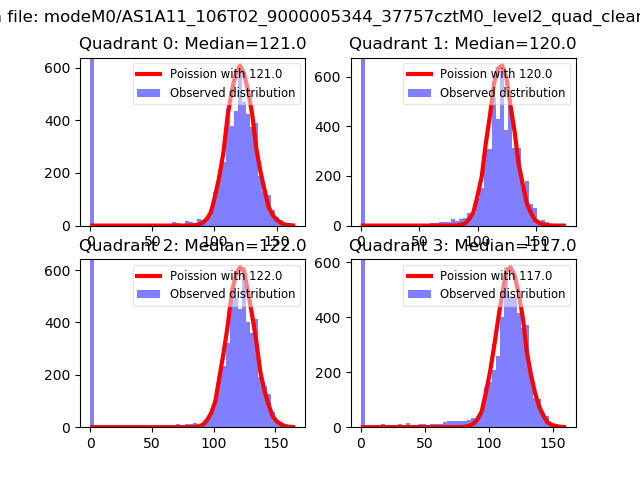
| Comparison with Poisson distribution Blue bars denote a histogram of data divided into 1 sec bins. Red curve is a Poisson curve with rate = median count rate of data. |
 |
 |
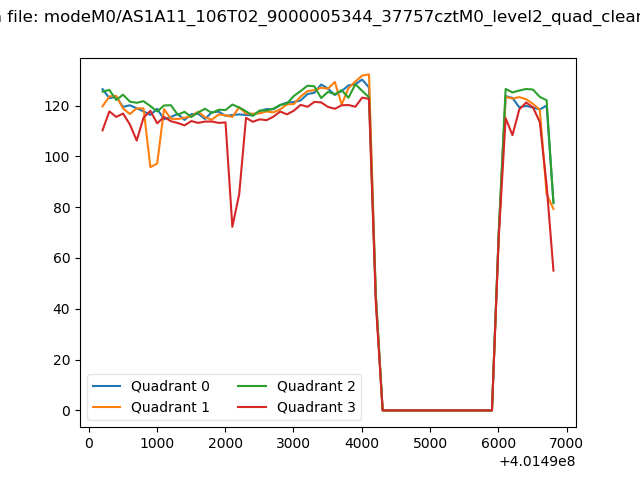
| Quadrant-wise count rates Data is divided into 100 sec bins |
 |
|
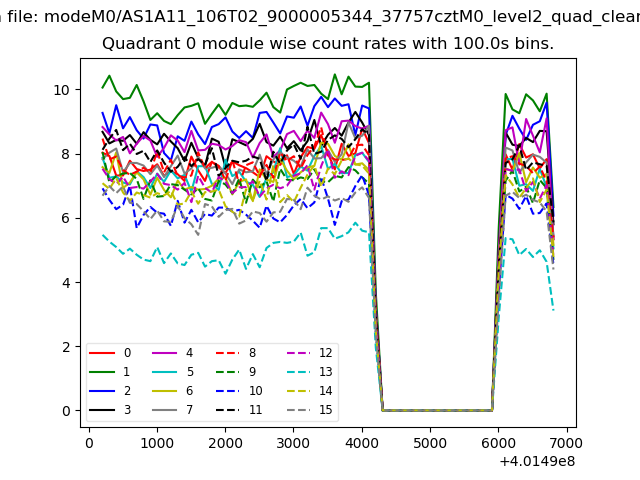
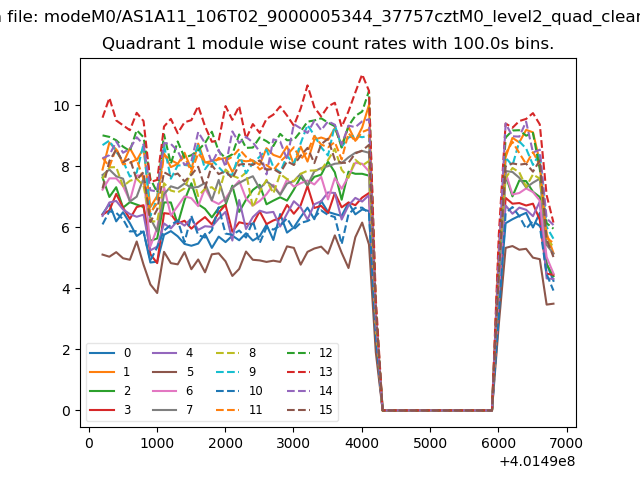
| Module-wise count rates for Quadrant A Data is divided into 100 sec bins |
 |
 |
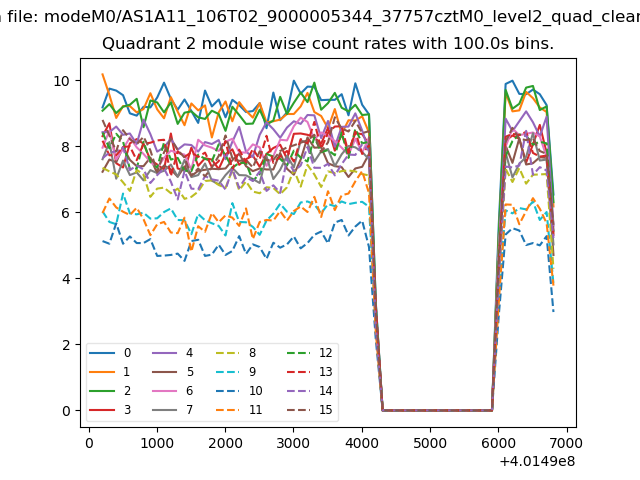
| Module-wise count rates for Quadrant B Data is divided into 100 sec bins |
 |
 |
| Module-wise count rates for Quadrant C Data is divided into 100 sec bins |
 |
 |
| Module-wise count rates for Quadrant D Data is divided into 100 sec bins |
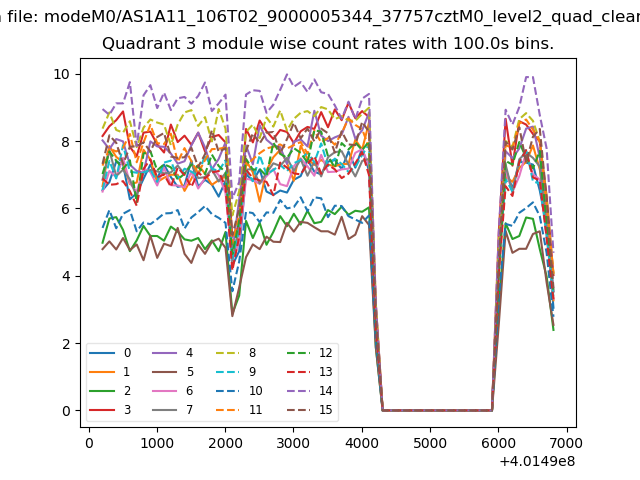 |
 |
| Parameter | Plot |
|---|---|
| CZT HV Monitor | 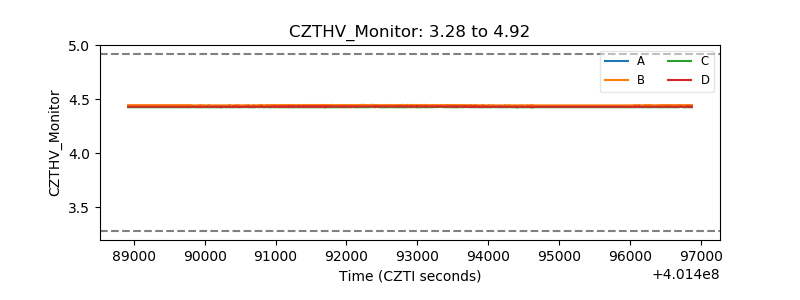 |
| D_VDD | 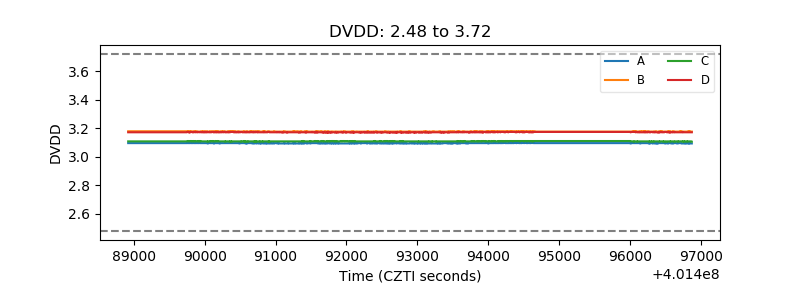 |
| Temperature 1 | 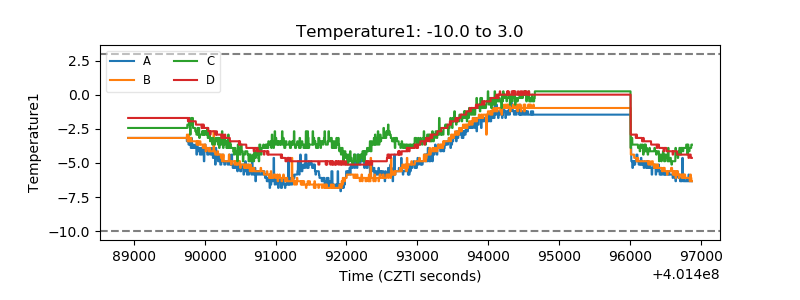 |
| Veto HV Monitor | 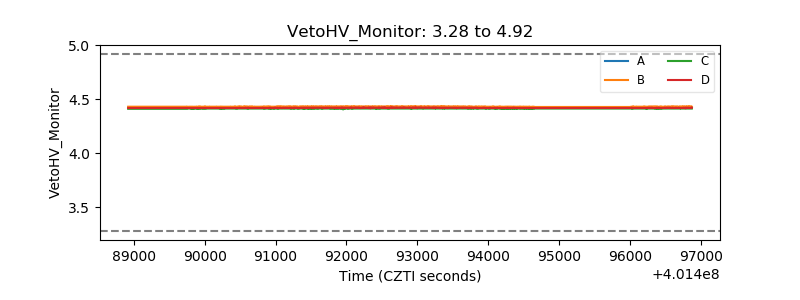 |
| Veto LLD | 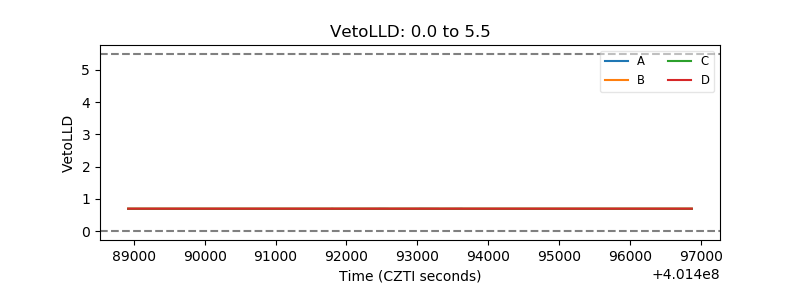 |
| Alpha Counter | 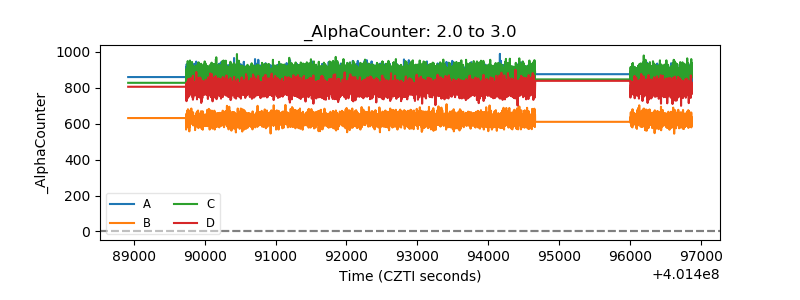 |
| _CPM_Rate | 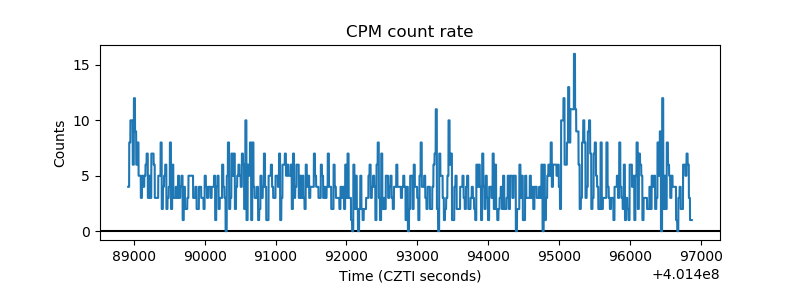 |
| CZT Counter | 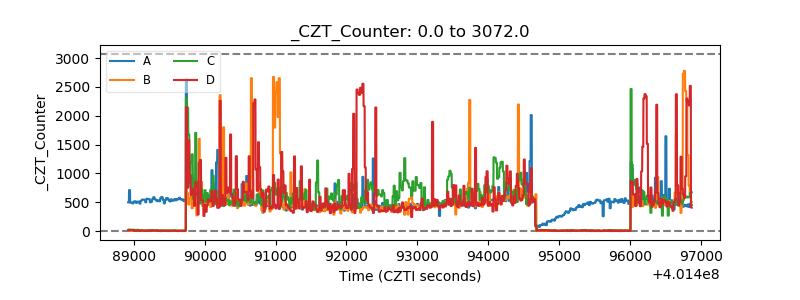 |
| +2.5 Volts monitor | 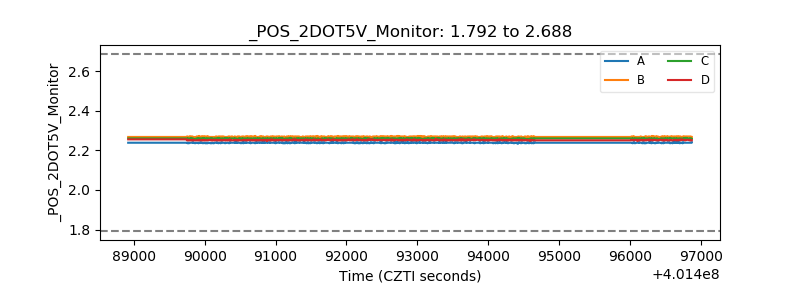 |
| +5 Volts monitor | 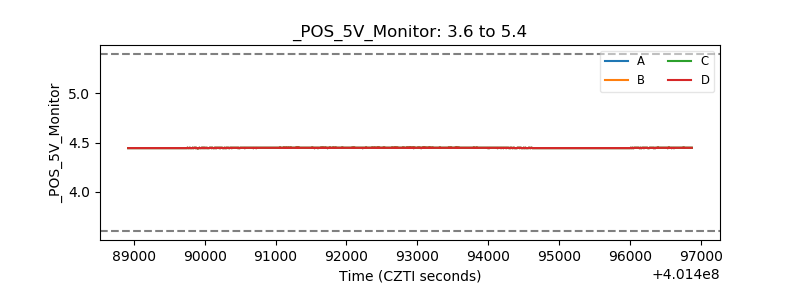 |
| _ROLL_ROT | 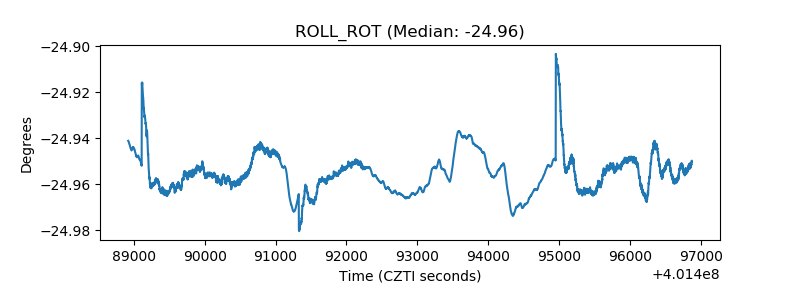 |
| _Roll_DEC | 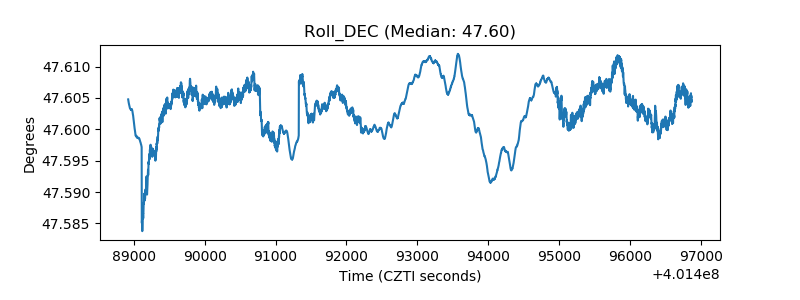 |
| _Roll_RA | 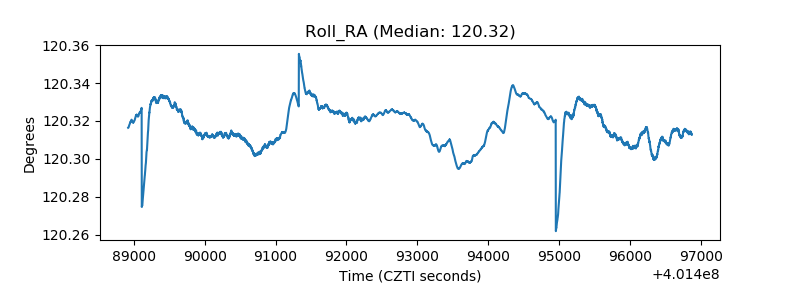 |
| Veto Counter | 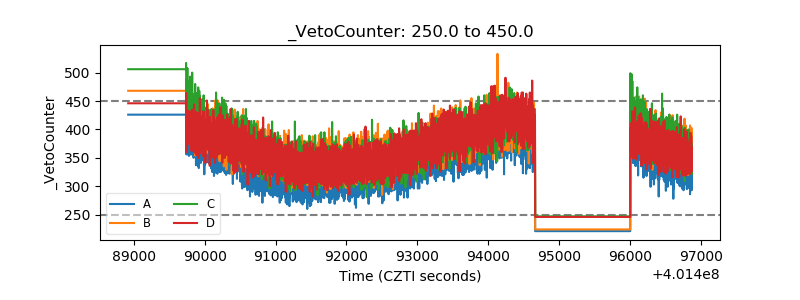 |