| Param | Original file | Final file |
|---|---|---|
| Filename | modeM0/AS1A11_106T02_9000005344_37758cztM0_level2.evt | modeM0/AS1A11_106T02_9000005344_37758cztM0_level2_quad_clean.evt |
| Size (bytes) | 493,896,960 | 91,572,480 |
| Size | 471.0 MB | 87.3 MB |
| Events in quadrant A | 3,099,328 | 597,534 |
| Events in quadrant B | 3,351,642 | 590,539 |
| Events in quadrant C | 3,783,297 | 589,701 |
| Events in quadrant D | 4,316,149 | 576,272 |
| Mode M9 | |||
|---|---|---|---|
| Quadrant | BADHDUFLAG | Total packets | Discarded packets |
| A | 0 | 24 | 0 |
| B | 0 | 24 | 0 |
| C | 0 | 24 | 0 |
| D | 0 | 25 | 0 |
| Mode SS | |||
|---|---|---|---|
| Quadrant | BADHDUFLAG | Total packets | Discarded packets |
| A | 0 | 122 | 0 |
| B | 0 | 122 | 0 |
| C | 0 | 122 | 0 |
| D | 0 | 122 | 0 |
| Mode M0 | |||
|---|---|---|---|
| Quadrant | BADHDUFLAG | Total packets | Discarded packets |
| A | 0 | 13217 | 3 |
| B | 0 | 14108 | 2 |
| C | 0 | 15133 | 2 |
| D | 0 | 17230 | 2 |
| Quadrant | Total seconds | Saturated seconds | Saturation percentage |
|---|---|---|---|
| A | 5997 | 40 | 0.667000% |
| B | 5997 | 176 | 2.934801% |
| C | 5997 | 296 | 4.935801% |
| D | 5997 | 523 | 8.721027% |
Noise dominated data is calculated using 1-second bins in cleaned event files. If a bin has >2000 counts, and if more than 50% of those come from <1% of pixels, then it is considered to be noise-dominated and hence unusable.
| Quadrant | # 1 sec bins | Bins with >0 counts | Bins with >2000 counts | High rate bins dominated by noise | Noise dominated (total time) | Noise dominated (detector-on time) | Marked lightcurve |
|---|---|---|---|---|---|---|---|
| A | 7280 | 5998 | 29 | 29 | 0.40% | 0.48% | 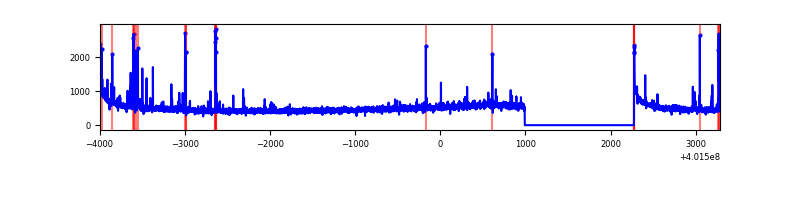 |
| B | 7280 | 5998 | 151 | 151 | 2.07% | 2.52% | 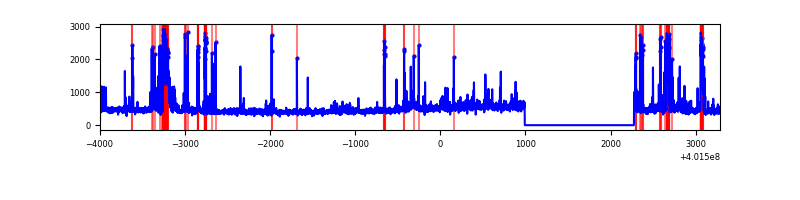 |
| C | 7280 | 5998 | 298 | 298 | 4.09% | 4.97% | 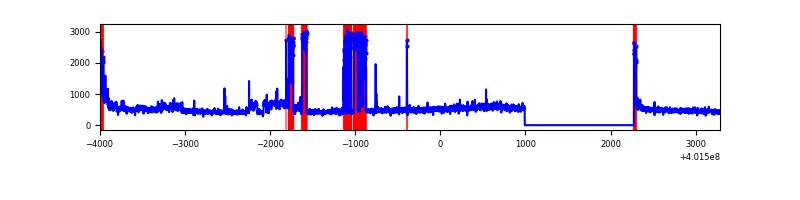 |
| D | 7280 | 5998 | 494 | 494 | 6.79% | 8.24% | 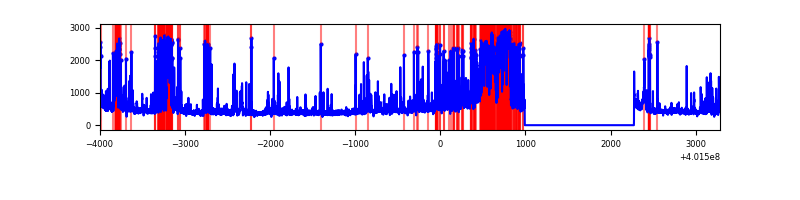 |
Top three noisy pixels from each quadrant. If the there are fewer than three noisy pixels in the level2.evt file, extra rows are filled as -1
| Pixel properties | Quadrant properties | ||||||
|---|---|---|---|---|---|---|---|
| Quadrant | DetID | PixID | Counts | Sigma | Mean | Median | Sigma |
| A | 10 | 83 | 366423 | 2745.46 | 659 | 645 | 133.2 |
| A | 9 | 143 | 102775 | 766.57 | 659 | 645 | 133.2 |
| A | 15 | 254 | 38861 | 286.84 | 659 | 645 | 133.2 |
| B | 5 | 255 | 294061 | 2341.69 | 649 | 634 | 125.3 |
| B | 4 | 81 | 253839 | 2020.7 | 649 | 634 | 125.3 |
| B | 5 | 172 | 78974 | 625.19 | 649 | 634 | 125.3 |
| C | 1 | 23 | 719761 | 4884.39 | 631 | 636 | 147.2 |
| C | 15 | 214 | 248977 | 1686.76 | 631 | 636 | 147.2 |
| C | 0 | 207 | 175588 | 1188.3 | 631 | 636 | 147.2 |
| D | 12 | 227 | 628333 | 4117.3 | 619 | 600 | 152.5 |
| D | 2 | 250 | 504532 | 3305.29 | 619 | 600 | 152.5 |
| D | 2 | 249 | 243596 | 1593.81 | 619 | 600 | 152.5 |
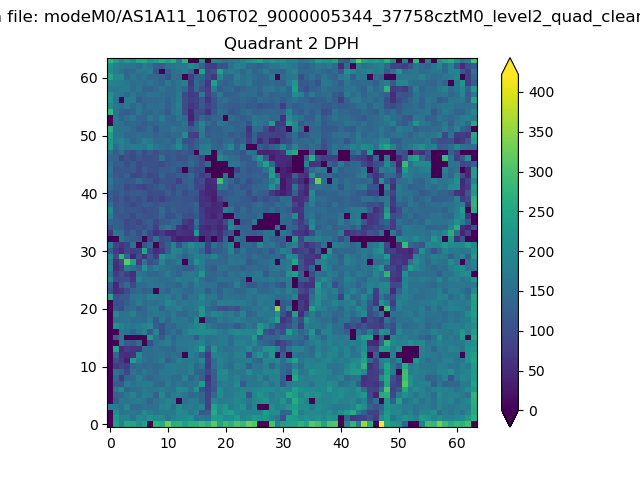
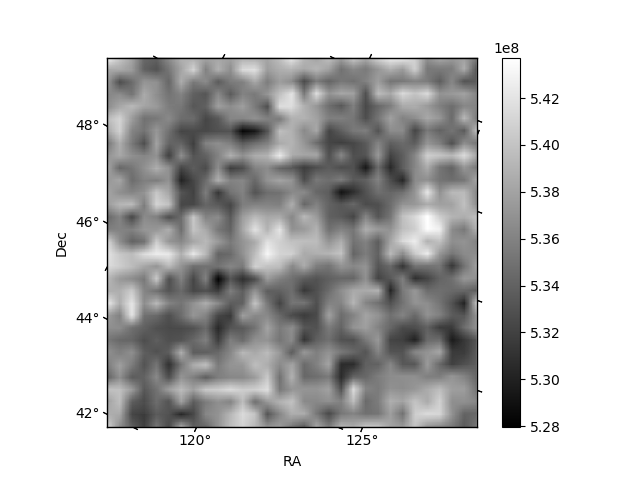
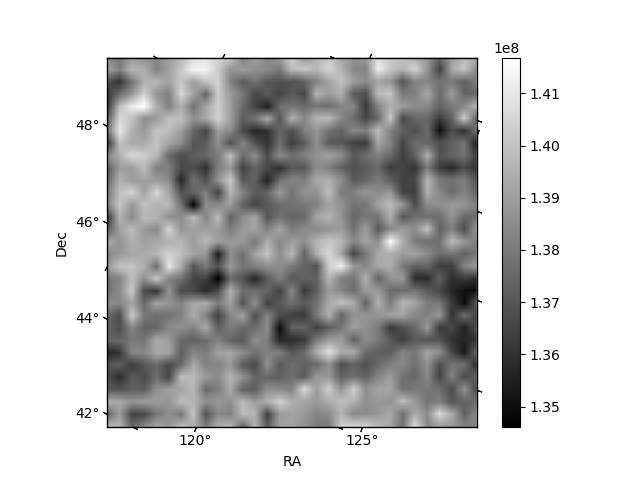
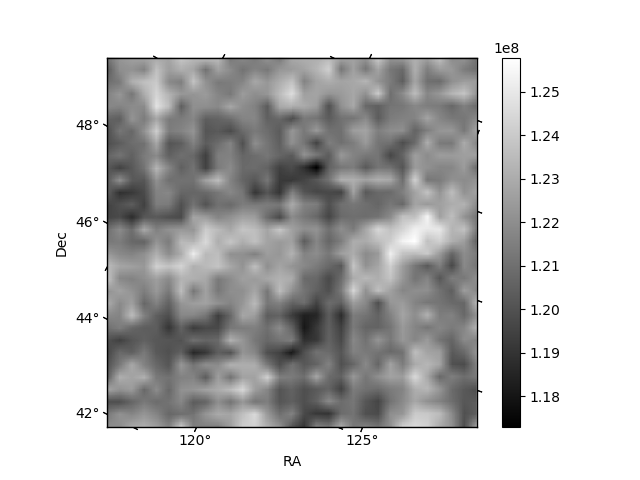
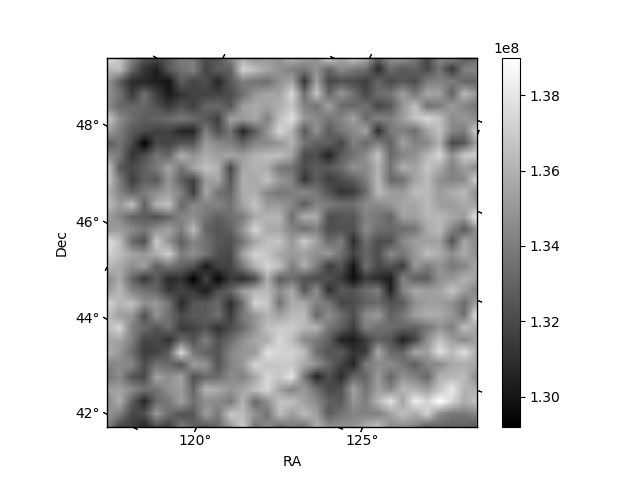
Histogram calculated using DETX and DETY for each event in the final _common_clean file
| Quadrant A | 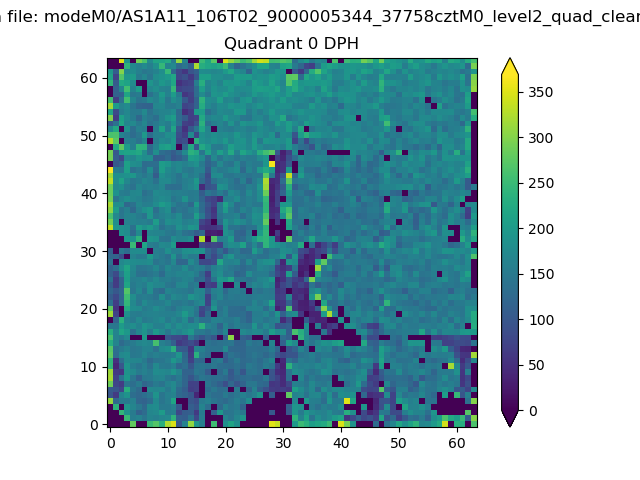 |
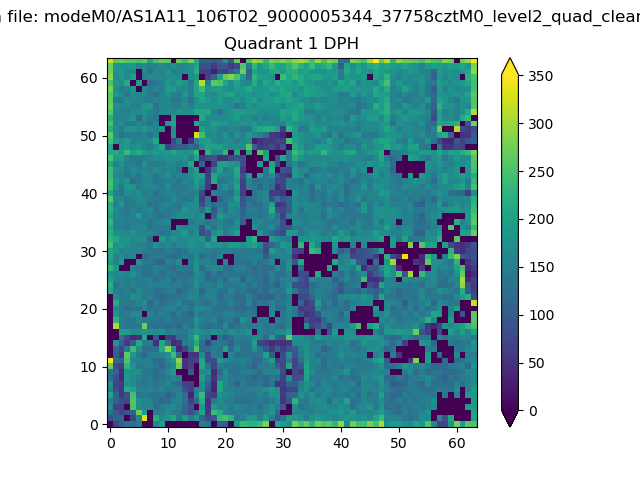 |
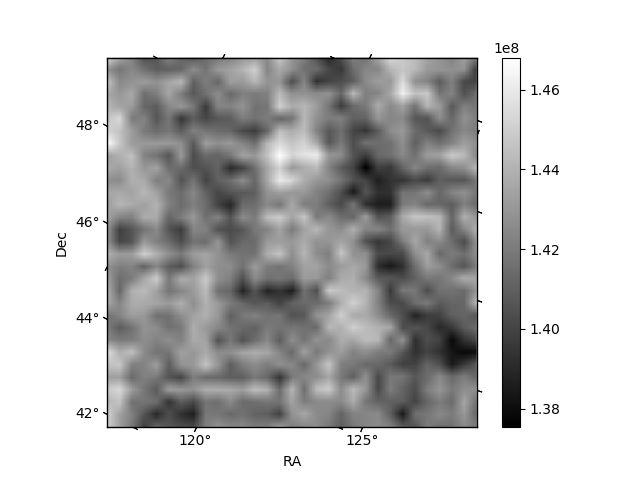
Quadrant B |
|---|---|---|---|
| Quadrant D | 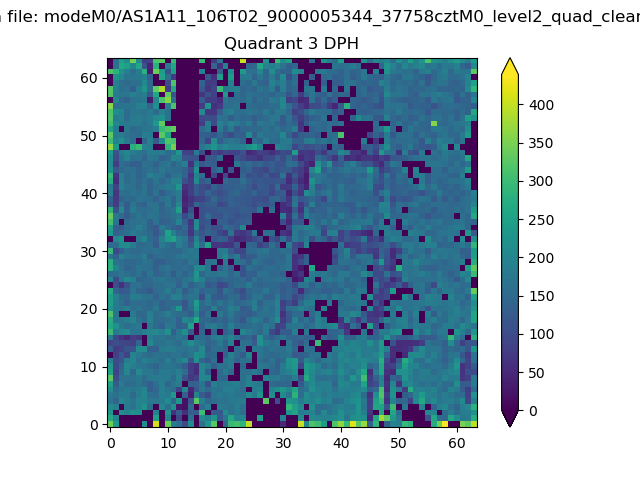 |
 |
Quadrant C |
| Plot type | Count rate plots | Images |
|---|---|---|
| Comparison with Poisson distribution Blue bars denote a histogram of data divided into 1 sec bins. Red curve is a Poisson curve with rate = median count rate of data. |
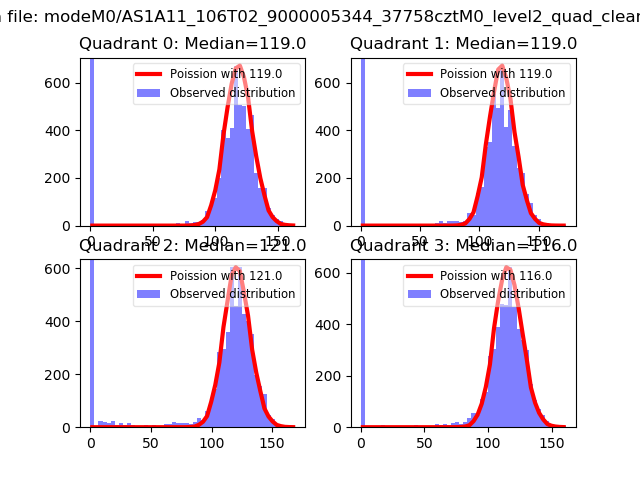 |
 |
| Quadrant-wise count rates Data is divided into 100 sec bins |
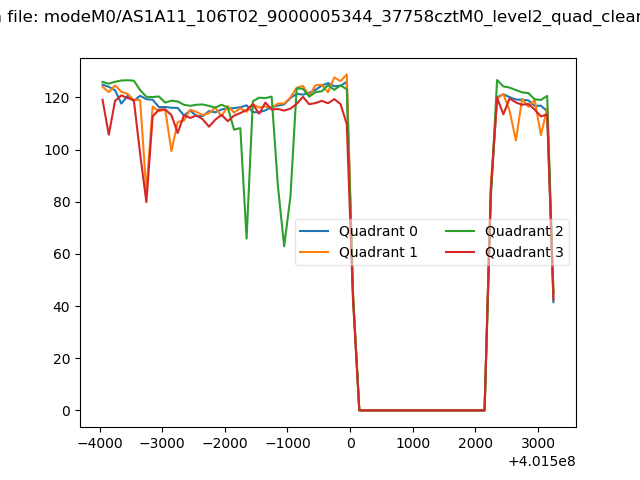 |
|
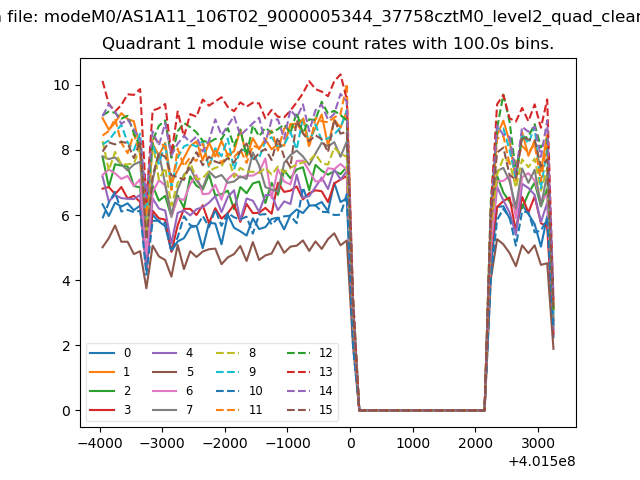
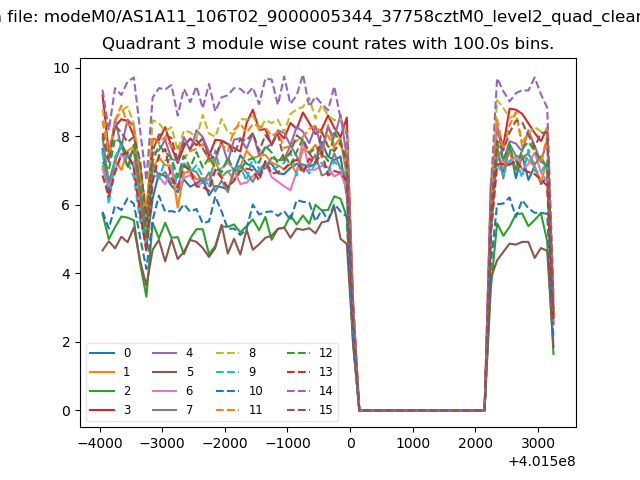
| Module-wise count rates for Quadrant A Data is divided into 100 sec bins |
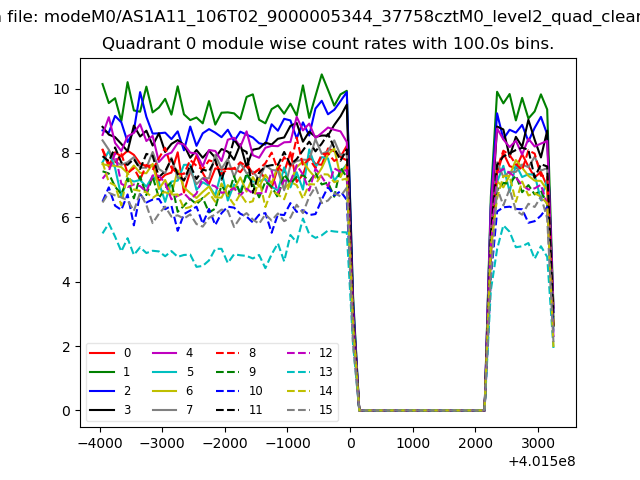 |
 |
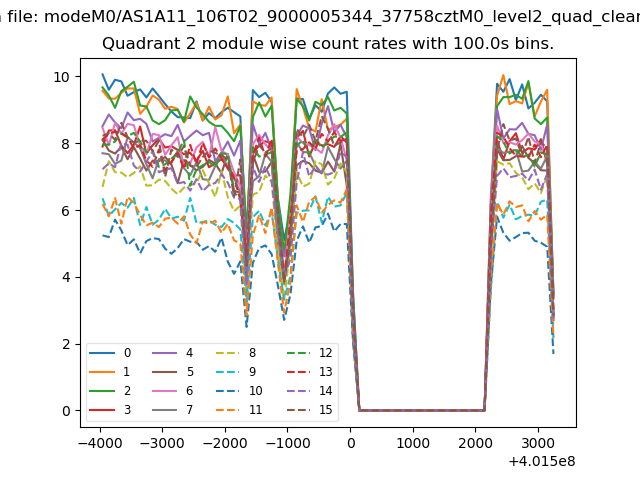
| Module-wise count rates for Quadrant B Data is divided into 100 sec bins |
 |
 |
| Module-wise count rates for Quadrant C Data is divided into 100 sec bins |
 |
 |
| Module-wise count rates for Quadrant D Data is divided into 100 sec bins |
 |
 |
| Parameter | Plot |
|---|---|
| CZT HV Monitor | 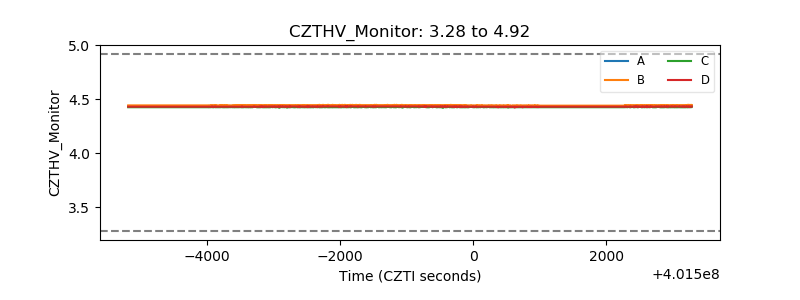 |
| D_VDD |  |
| Temperature 1 | 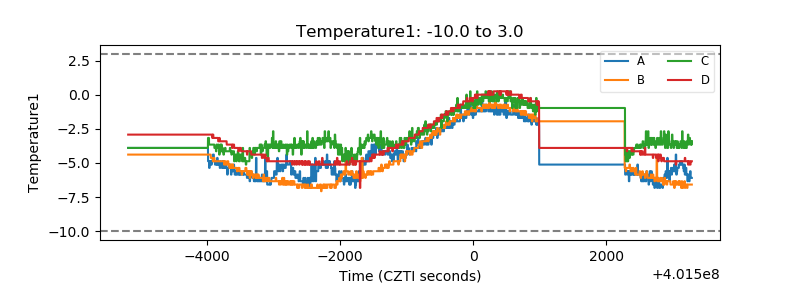 |
| Veto HV Monitor |  |
| Veto LLD | 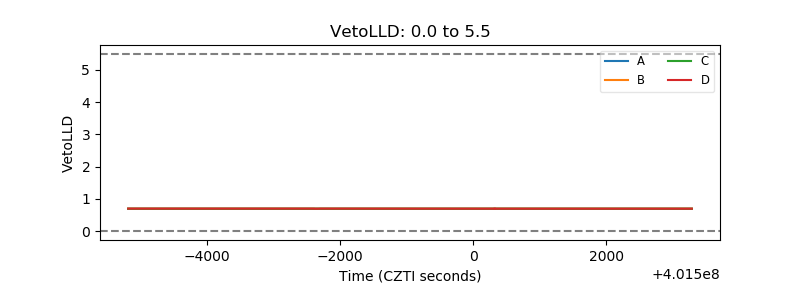 |
| Alpha Counter | 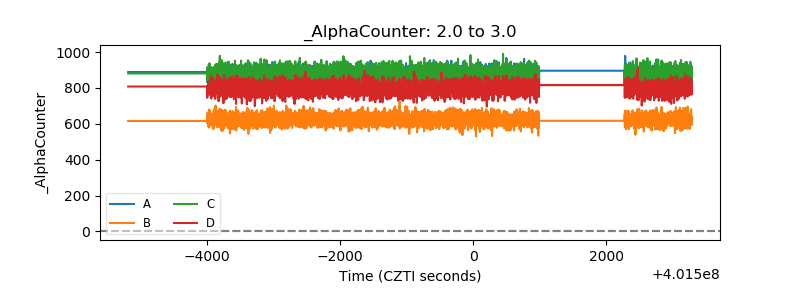 |
| _CPM_Rate | 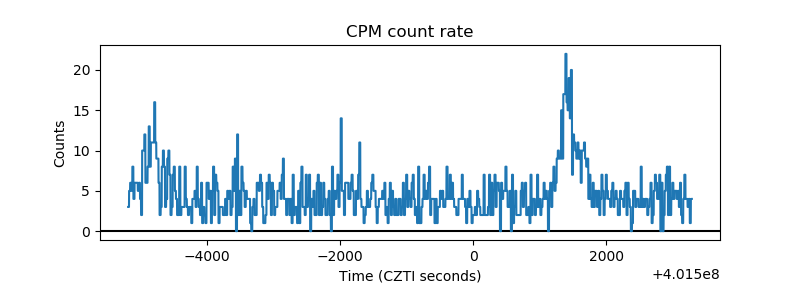 |
| CZT Counter | 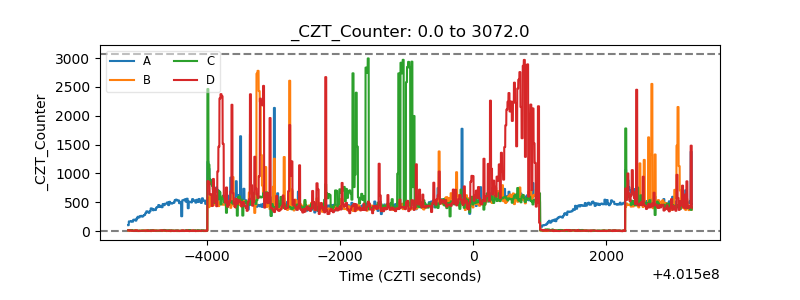 |
| +2.5 Volts monitor |  |
| +5 Volts monitor | 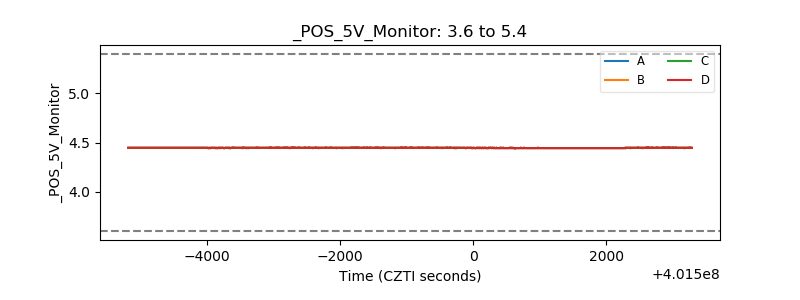 |
| _ROLL_ROT | 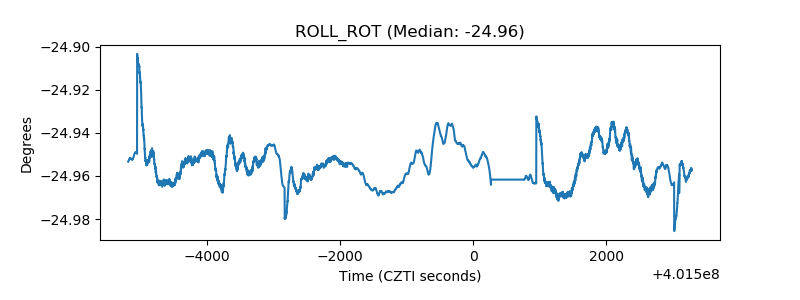 |
| _Roll_DEC | 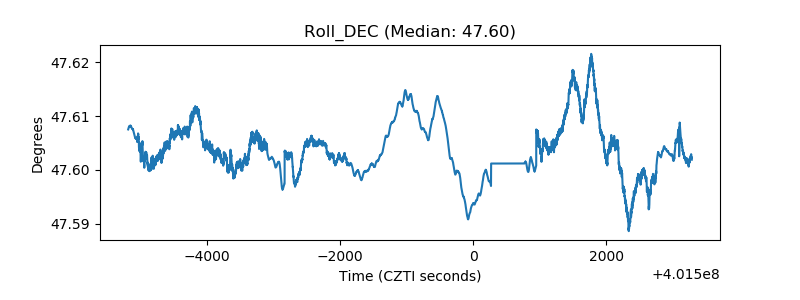 |
| _Roll_RA | 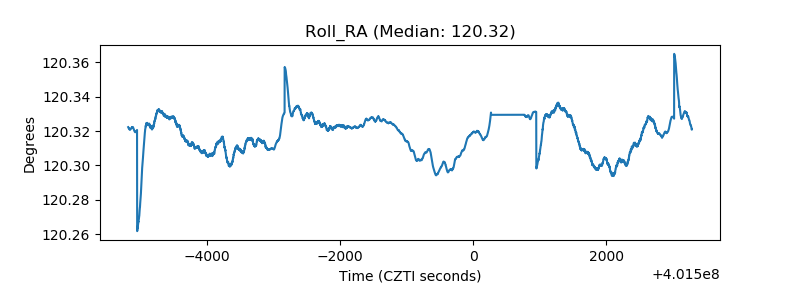 |
| Veto Counter | 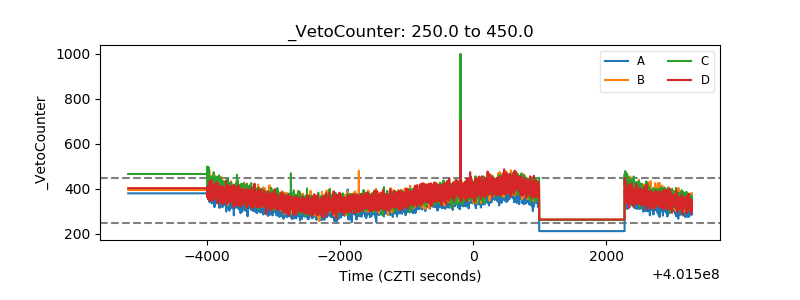 |