| Param | Original file | Final file |
|---|---|---|
| Filename | modeM0/AS1A11_106T02_9000005344_37760cztM0_level2.evt | modeM0/AS1A11_106T02_9000005344_37760cztM0_level2_quad_clean.evt |
| Size (bytes) | 827,150,400 | 145,307,520 |
| Size | 788.8 MB | 138.6 MB |
| Events in quadrant A | 5,898,240 | 910,836 |
| Events in quadrant B | 5,786,893 | 917,796 |
| Events in quadrant C | 5,243,613 | 934,511 |
| Events in quadrant D | 7,378,446 | 877,458 |
| Mode M9 | |||
|---|---|---|---|
| Quadrant | BADHDUFLAG | Total packets | Discarded packets |
| A | 0 | 41 | 0 |
| B | 0 | 41 | 0 |
| C | 0 | 41 | 0 |
| D | 0 | 41 | 0 |
| Mode SS | |||
|---|---|---|---|
| Quadrant | BADHDUFLAG | Total packets | Discarded packets |
| A | 0 | 224 | 0 |
| B | 0 | 224 | 0 |
| C | 0 | 224 | 0 |
| D | 0 | 224 | 0 |
| Mode M0 | |||
|---|---|---|---|
| Quadrant | BADHDUFLAG | Total packets | Discarded packets |
| A | 0 | 24684 | 4 |
| B | 0 | 24824 | 3 |
| C | 0 | 22702 | 3 |
| D | 0 | 29668 | 3 |
| Quadrant | Total seconds | Saturated seconds | Saturation percentage |
|---|---|---|---|
| A | 10987 | 137 | 1.246928% |
| B | 10987 | 194 | 1.765723% |
| C | 10987 | 34 | 0.309457% |
| D | 10987 | 528 | 4.805679% |
Noise dominated data is calculated using 1-second bins in cleaned event files. If a bin has >2000 counts, and if more than 50% of those come from <1% of pixels, then it is considered to be noise-dominated and hence unusable.
| Quadrant | # 1 sec bins | Bins with >0 counts | Bins with >2000 counts | High rate bins dominated by noise | Noise dominated (total time) | Noise dominated (detector-on time) | Marked lightcurve |
|---|---|---|---|---|---|---|---|
| A | 15046 | 10990 | 114 | 114 | 0.76% | 1.04% | 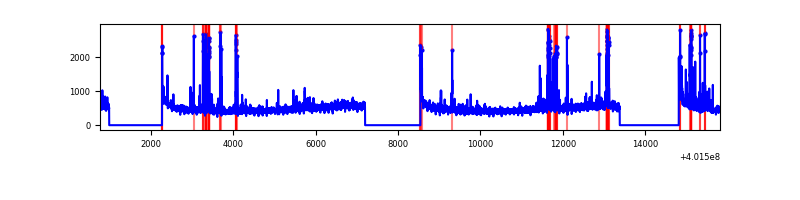 |
| B | 15046 | 10990 | 161 | 161 | 1.07% | 1.46% | 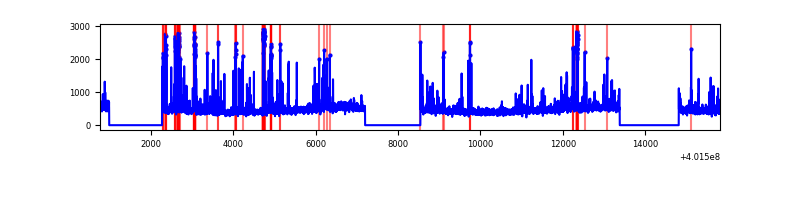 |
| C | 15046 | 10990 | 26 | 26 | 0.17% | 0.24% | 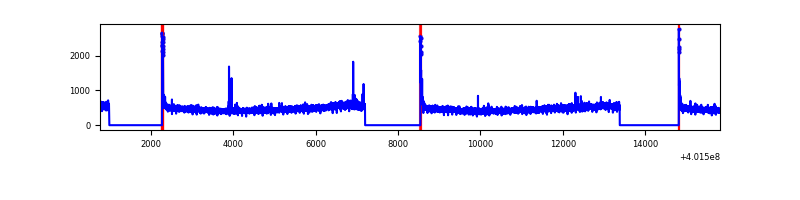 |
| D | 15046 | 10990 | 510 | 510 | 3.39% | 4.64% | 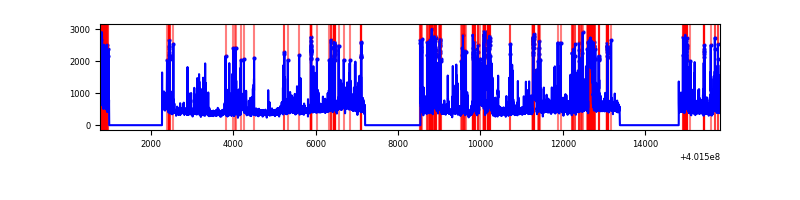 |
Top three noisy pixels from each quadrant. If the there are fewer than three noisy pixels in the level2.evt file, extra rows are filled as -1
| Pixel properties | Quadrant properties | ||||||
|---|---|---|---|---|---|---|---|
| Quadrant | DetID | PixID | Counts | Sigma | Mean | Median | Sigma |
| A | 10 | 83 | 611439 | 2515.06 | 1205 | 1181 | 242.6 |
| A | 9 | 143 | 549604 | 2260.22 | 1205 | 1181 | 242.6 |
| A | 12 | 189 | 30627 | 121.36 | 1205 | 1181 | 242.6 |
| B | 5 | 255 | 482023 | 2122.24 | 1193 | 1163 | 226.6 |
| B | 5 | 172 | 190790 | 836.9 | 1193 | 1163 | 226.6 |
| B | 4 | 81 | 98577 | 429.93 | 1193 | 1163 | 226.6 |
| C | 15 | 214 | 465317 | 1701.78 | 1178 | 1184 | 272.7 |
| C | 0 | 10 | 130421 | 473.86 | 1178 | 1184 | 272.7 |
| C | 3 | 233 | 22084 | 76.63 | 1178 | 1184 | 272.7 |
| D | 2 | 249 | 796509 | 2843.48 | 1152 | 1118 | 279.7 |
| D | 2 | 250 | 668292 | 2385.11 | 1152 | 1118 | 279.7 |
| D | 7 | 223 | 488709 | 1743.11 | 1152 | 1118 | 279.7 |
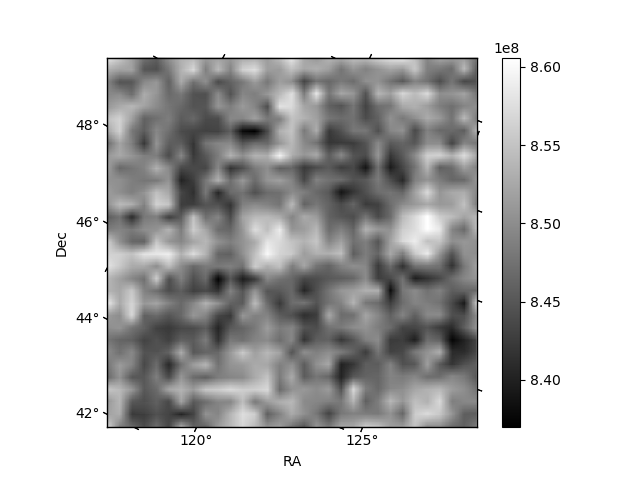
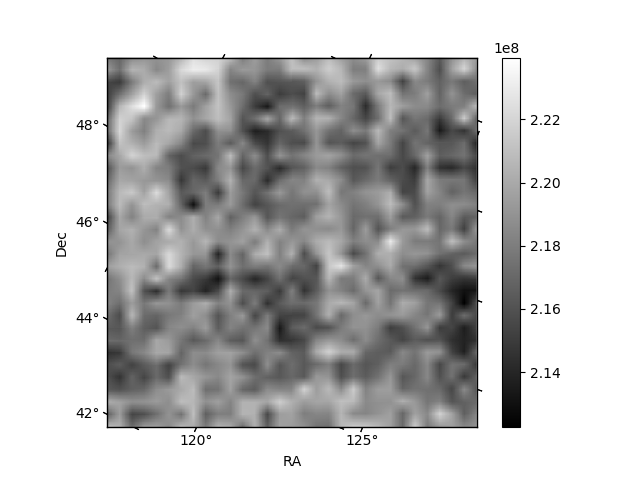
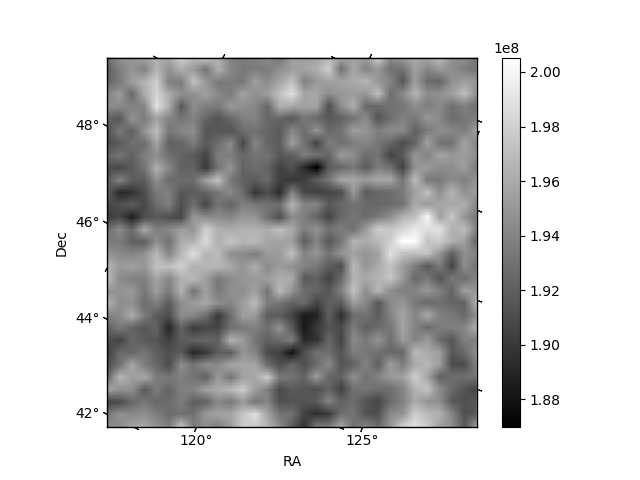
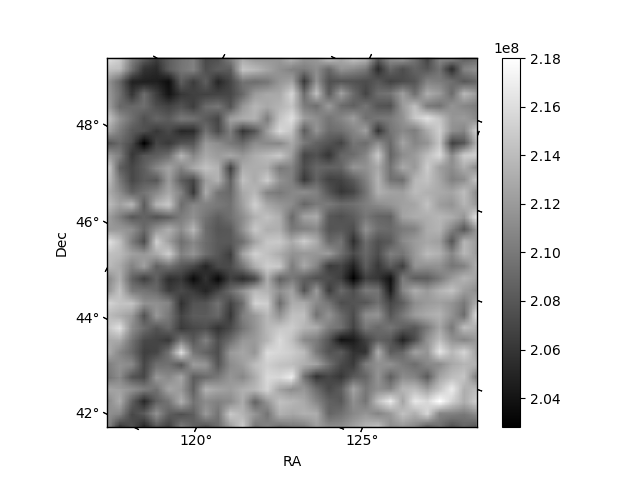
Histogram calculated using DETX and DETY for each event in the final _common_clean file
| Quadrant A | 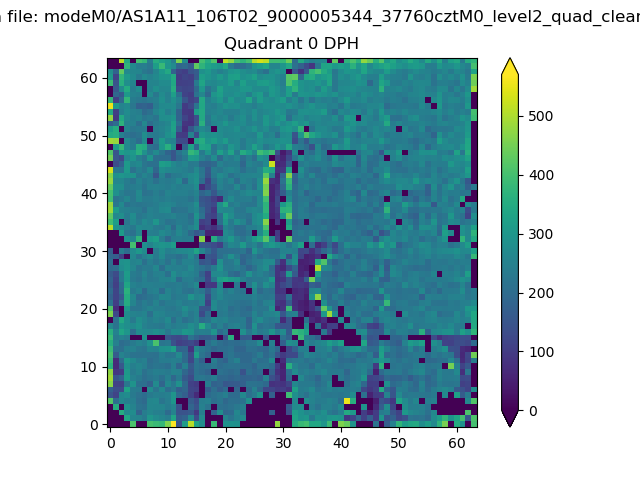 |
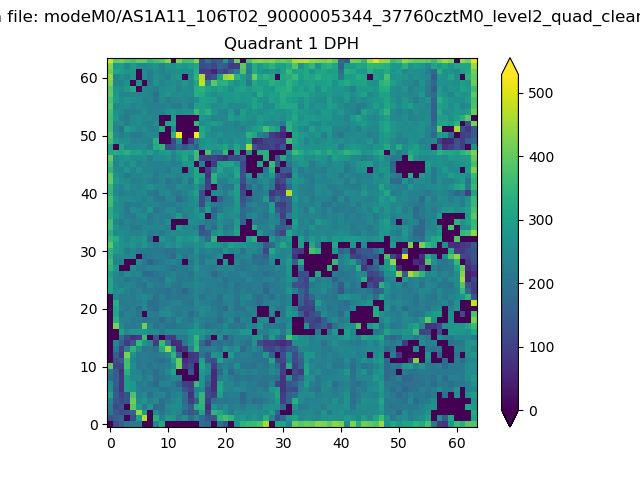 |
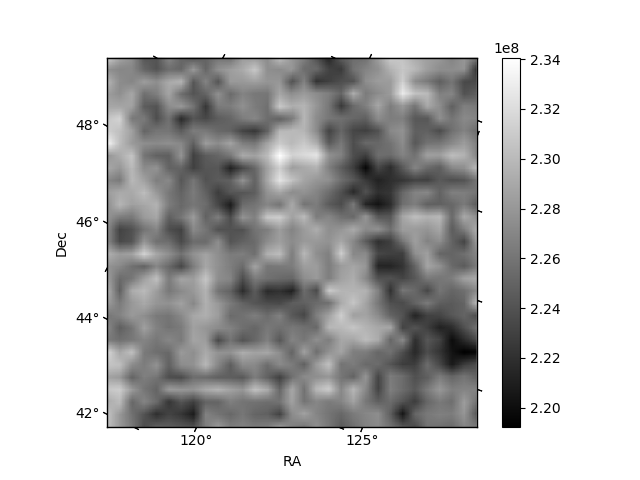
Quadrant B |
|---|---|---|---|
| Quadrant D | 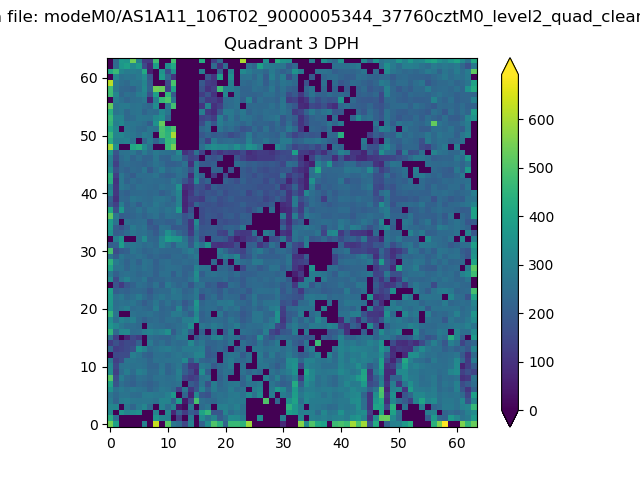 |
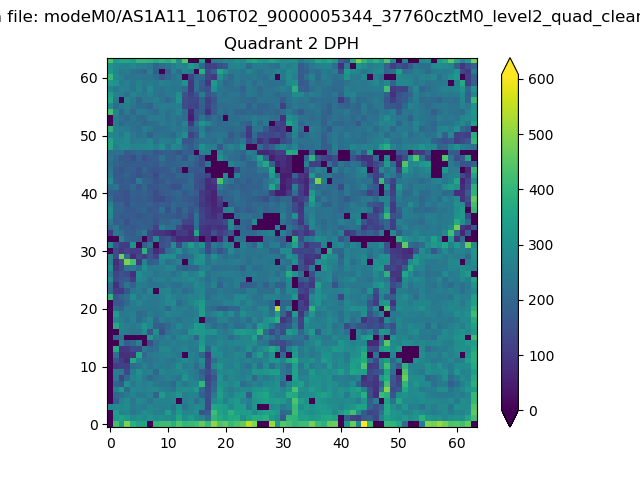 |
Quadrant C |
| Plot type | Count rate plots | Images |
|---|---|---|
| Comparison with Poisson distribution Blue bars denote a histogram of data divided into 1 sec bins. Red curve is a Poisson curve with rate = median count rate of data. |
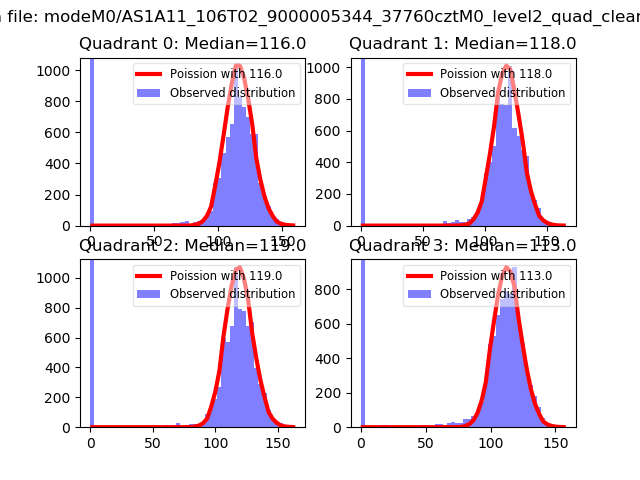 |
 |
| Quadrant-wise count rates Data is divided into 100 sec bins |
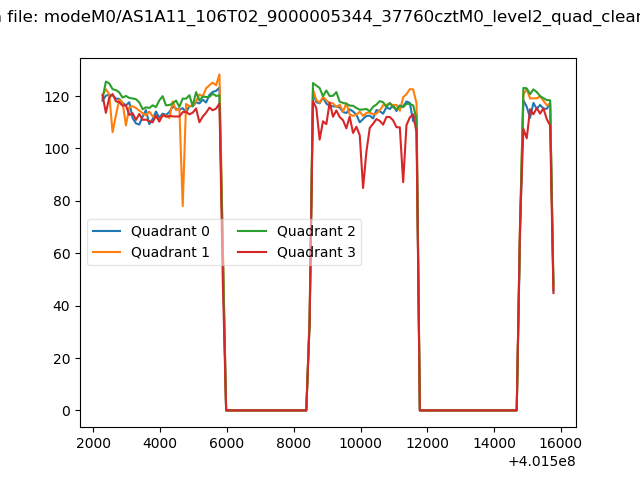 |
|
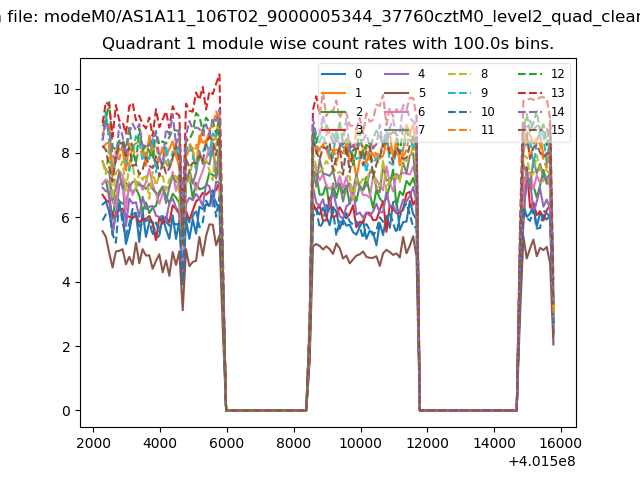
| Module-wise count rates for Quadrant A Data is divided into 100 sec bins |
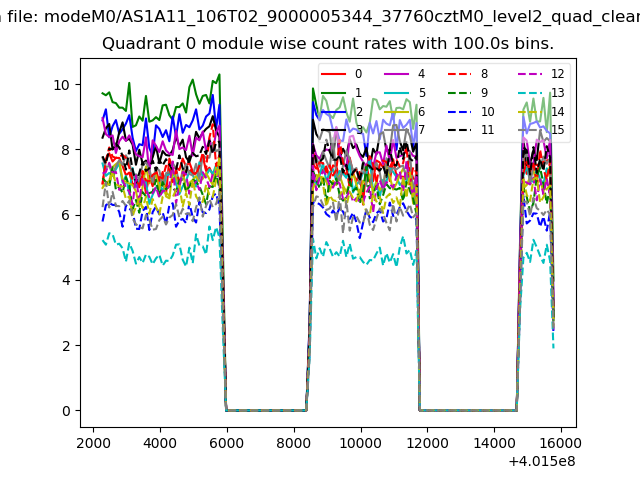 |
 |
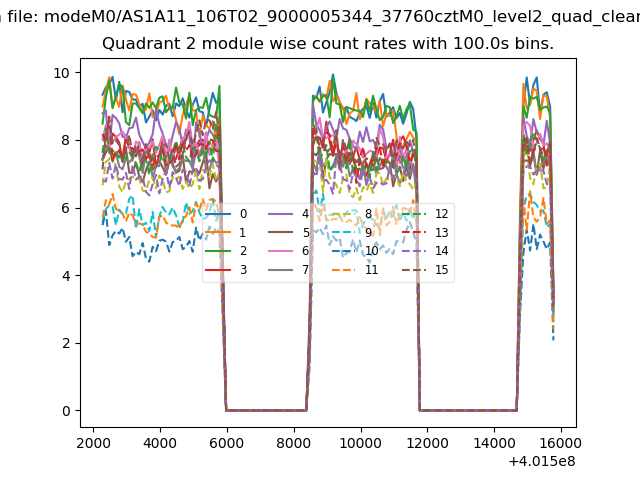
| Module-wise count rates for Quadrant B Data is divided into 100 sec bins |
 |
 |
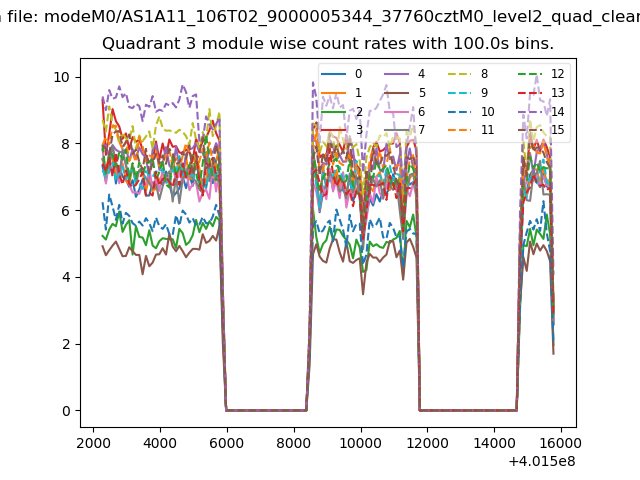
| Module-wise count rates for Quadrant C Data is divided into 100 sec bins |
 |
 |
| Module-wise count rates for Quadrant D Data is divided into 100 sec bins |
 |
 |
| Parameter | Plot |
|---|---|
| CZT HV Monitor | 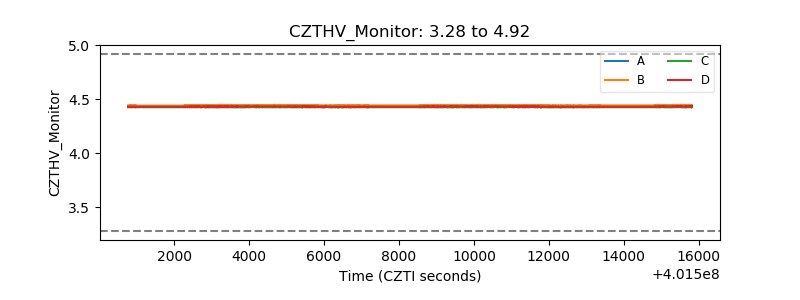 |
| D_VDD |  |
| Temperature 1 | 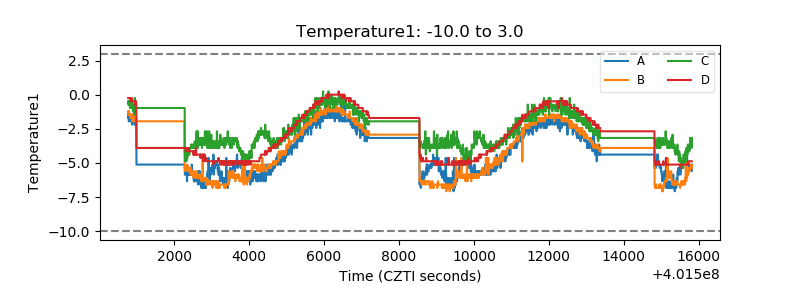 |
| Veto HV Monitor |  |
| Veto LLD | 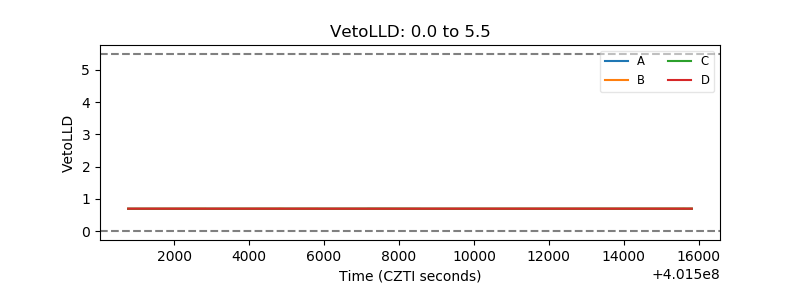 |
| Alpha Counter | 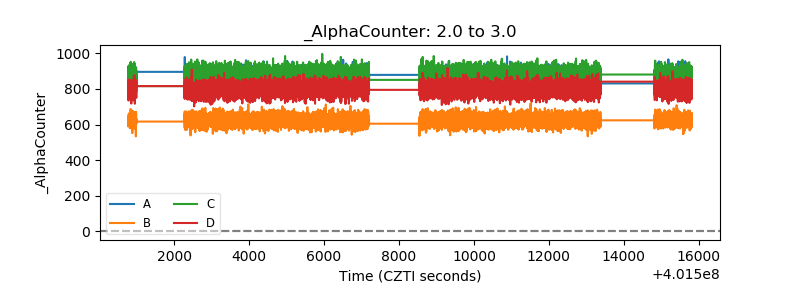 |
| _CPM_Rate | 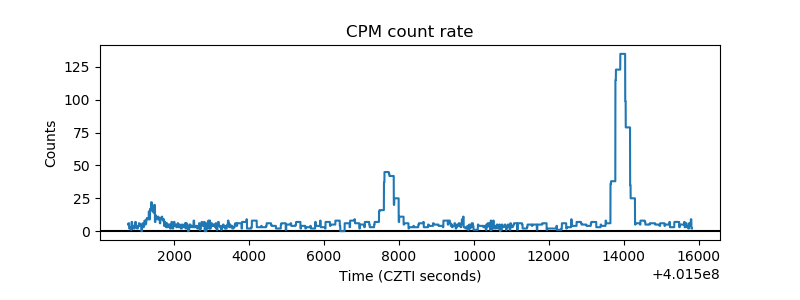 |
| CZT Counter | 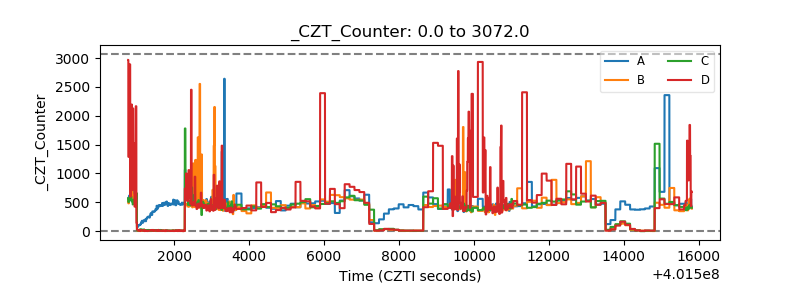 |
| +2.5 Volts monitor | 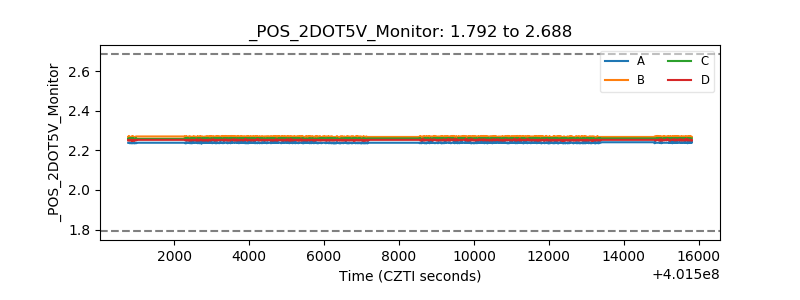 |
| +5 Volts monitor | 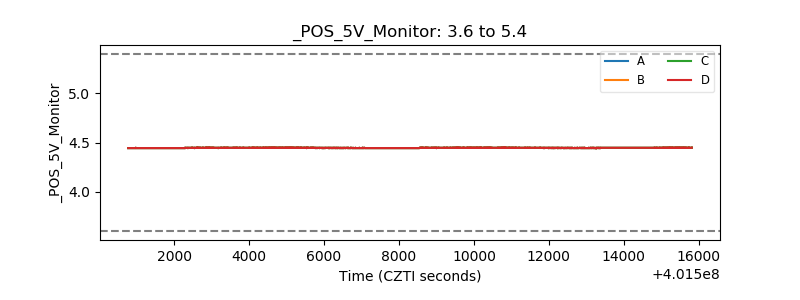 |
| _ROLL_ROT | 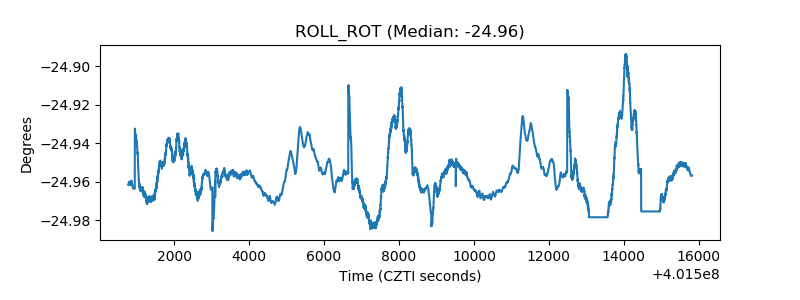 |
| _Roll_DEC | 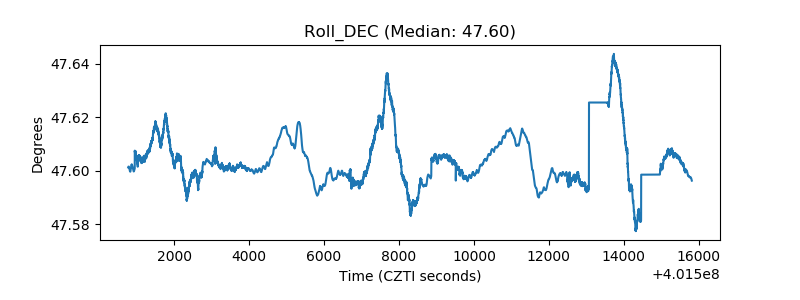 |
| _Roll_RA | 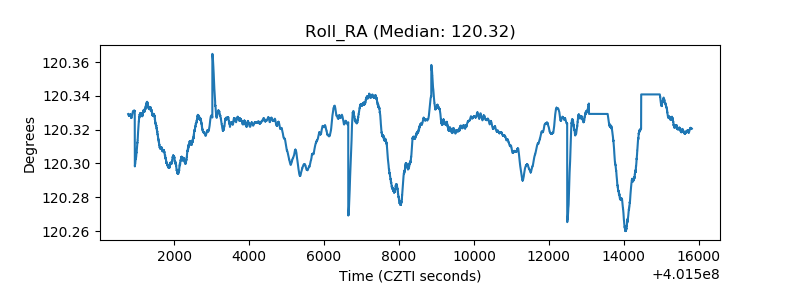 |
| Veto Counter | 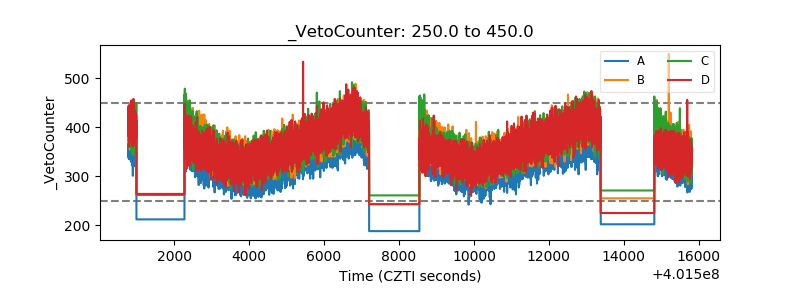 |