| Param | Original file | Final file |
|---|---|---|
| Filename | modeM0/AS1A11_106T02_9000005344_37762cztM0_level2.evt | modeM0/AS1A11_106T02_9000005344_37762cztM0_level2_quad_clean.evt |
| Size (bytes) | 448,767,360 | 71,435,520 |
| Size | 428.0 MB | 68.1 MB |
| Events in quadrant A | 3,233,090 | 448,201 |
| Events in quadrant B | 2,733,920 | 459,832 |
| Events in quadrant C | 2,721,110 | 459,172 |
| Events in quadrant D | 4,526,132 | 407,564 |
| Mode M9 | |||
|---|---|---|---|
| Quadrant | BADHDUFLAG | Total packets | Discarded packets |
| A | 0 | 18 | 0 |
| B | 0 | 18 | 0 |
| C | 0 | 18 | 0 |
| D | 0 | 19 | 0 |
| Mode SS | |||
|---|---|---|---|
| Quadrant | BADHDUFLAG | Total packets | Discarded packets |
| A | 0 | 112 | 0 |
| B | 0 | 112 | 0 |
| C | 0 | 112 | 0 |
| D | 0 | 112 | 0 |
| Mode M0 | |||
|---|---|---|---|
| Quadrant | BADHDUFLAG | Total packets | Discarded packets |
| A | 0 | 13038 | 3 |
| B | 0 | 11883 | 2 |
| C | 0 | 11614 | 2 |
| D | 0 | 17217 | 2 |
| Quadrant | Total seconds | Saturated seconds | Saturation percentage |
|---|---|---|---|
| A | 5549 | 82 | 1.477744% |
| B | 5549 | 23 | 0.414489% |
| C | 5549 | 33 | 0.594702% |
| D | 5549 | 547 | 9.857632% |
Noise dominated data is calculated using 1-second bins in cleaned event files. If a bin has >2000 counts, and if more than 50% of those come from <1% of pixels, then it is considered to be noise-dominated and hence unusable.
| Quadrant | # 1 sec bins | Bins with >0 counts | Bins with >2000 counts | High rate bins dominated by noise | Noise dominated (total time) | Noise dominated (detector-on time) | Marked lightcurve |
|---|---|---|---|---|---|---|---|
| A | 7222 | 5550 | 89 | 89 | 1.23% | 1.60% | 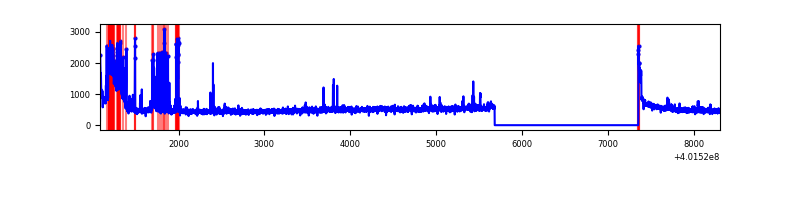 |
| B | 7222 | 5550 | 17 | 17 | 0.24% | 0.31% | 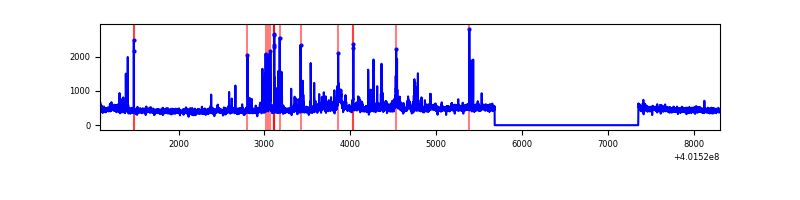 |
| C | 7222 | 5550 | 31 | 31 | 0.43% | 0.56% | 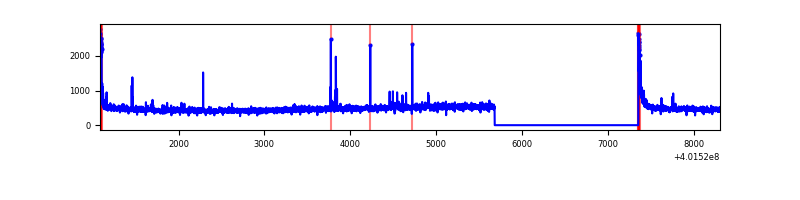 |
| D | 7222 | 5550 | 590 | 590 | 8.17% | 10.63% | 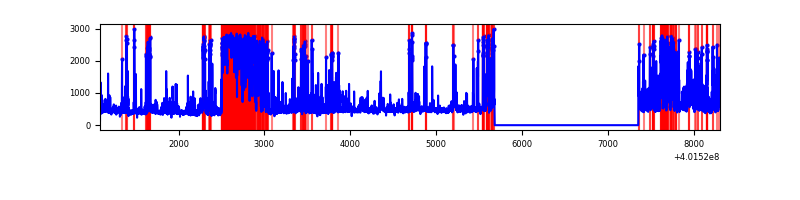 |
Top three noisy pixels from each quadrant. If the there are fewer than three noisy pixels in the level2.evt file, extra rows are filled as -1
| Pixel properties | Quadrant properties | ||||||
|---|---|---|---|---|---|---|---|
| Quadrant | DetID | PixID | Counts | Sigma | Mean | Median | Sigma |
| A | 10 | 83 | 342924 | 2777.99 | 613 | 602 | 123.2 |
| A | 15 | 254 | 331378 | 2684.3 | 613 | 602 | 123.2 |
| A | 9 | 143 | 81095 | 653.21 | 613 | 602 | 123.2 |
| B | 0 | 229 | 97408 | 827.47 | 610 | 594 | 117.0 |
| B | 5 | 255 | 76371 | 647.66 | 610 | 594 | 117.0 |
| B | 5 | 172 | 64815 | 548.9 | 610 | 594 | 117.0 |
| C | 15 | 214 | 238189 | 1715.0 | 597 | 602 | 138.5 |
| C | 0 | 10 | 108962 | 782.18 | 597 | 602 | 138.5 |
| C | 1 | 23 | 19007 | 132.85 | 597 | 602 | 138.5 |
| D | 2 | 249 | 1755842 | 12469.27 | 577 | 562 | 140.8 |
| D | 2 | 250 | 196603 | 1392.65 | 577 | 562 | 140.8 |
| D | 10 | 199 | 103282 | 729.71 | 577 | 562 | 140.8 |
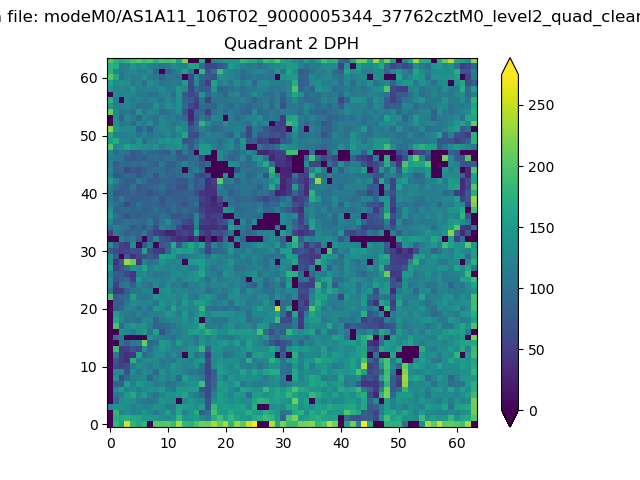
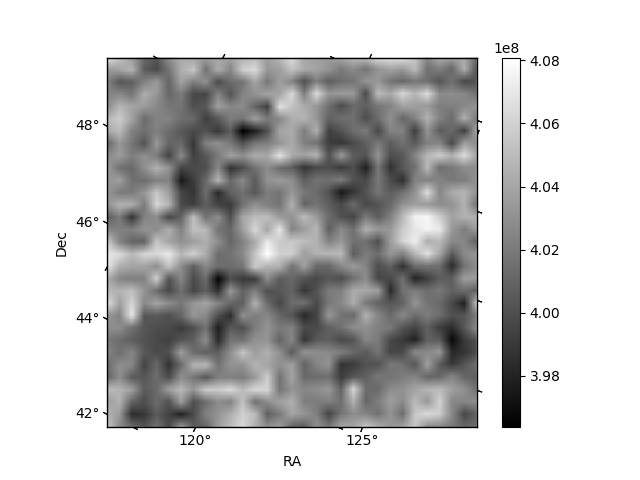
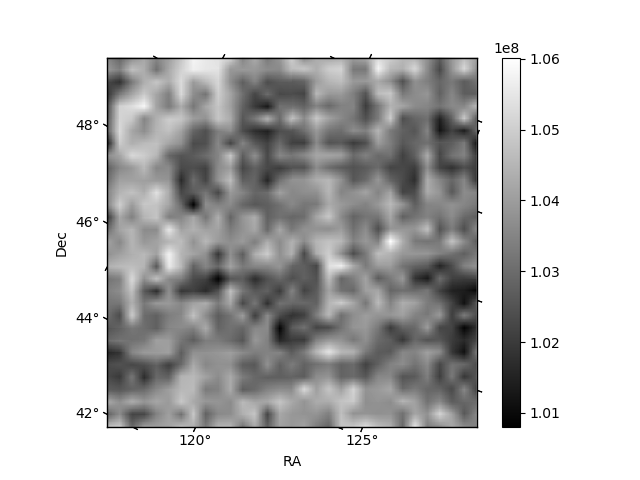
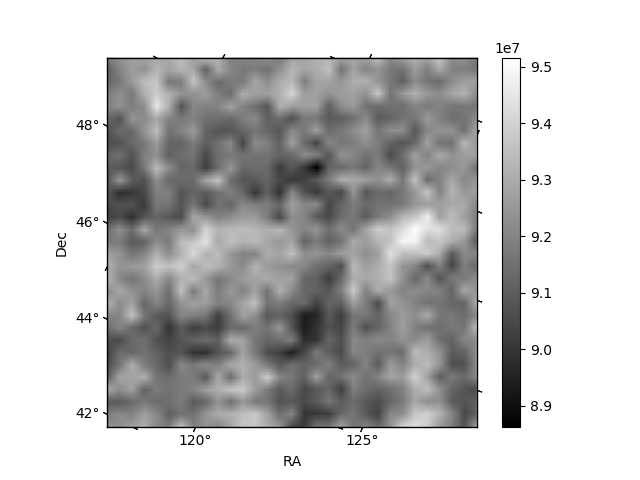
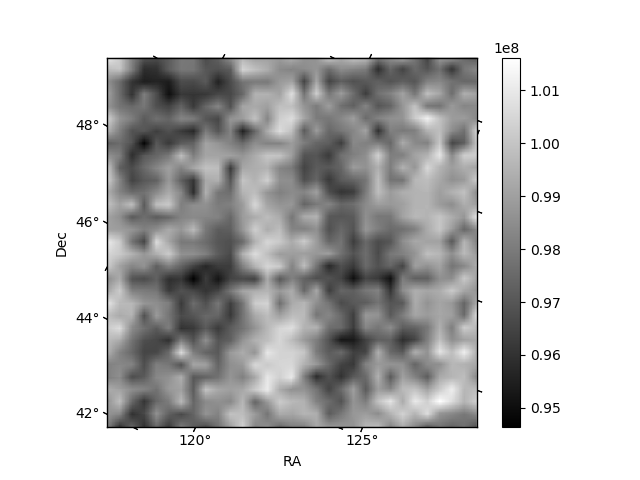
Histogram calculated using DETX and DETY for each event in the final _common_clean file
| Quadrant A | 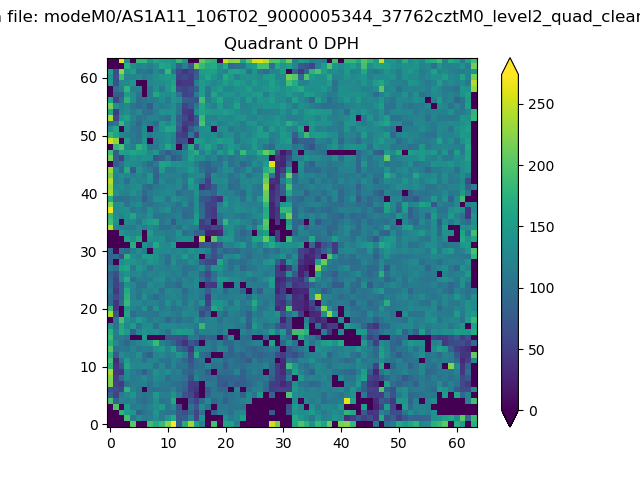 |
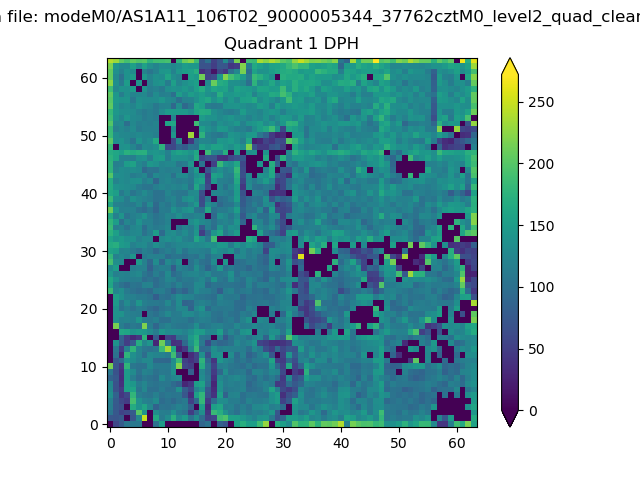 |
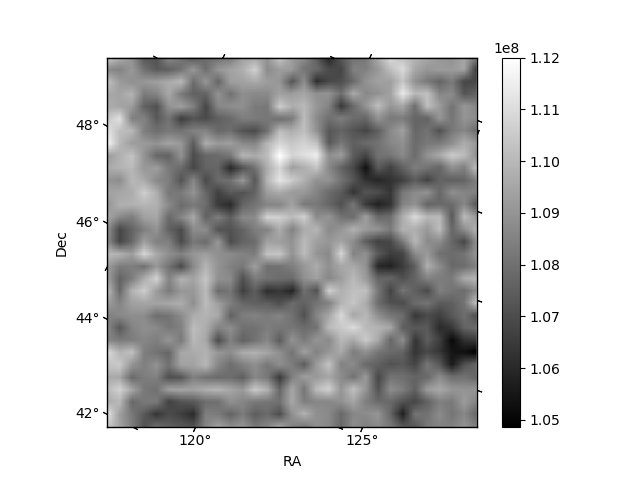
Quadrant B |
|---|---|---|---|
| Quadrant D | 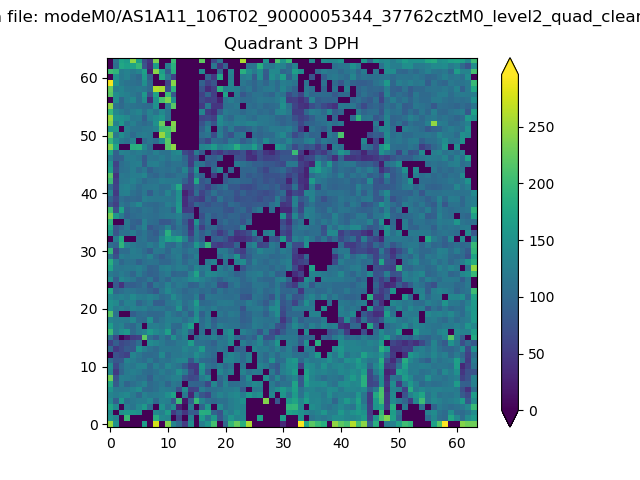 |
 |
Quadrant C |
| Plot type | Count rate plots | Images |
|---|---|---|
| Comparison with Poisson distribution Blue bars denote a histogram of data divided into 1 sec bins. Red curve is a Poisson curve with rate = median count rate of data. |
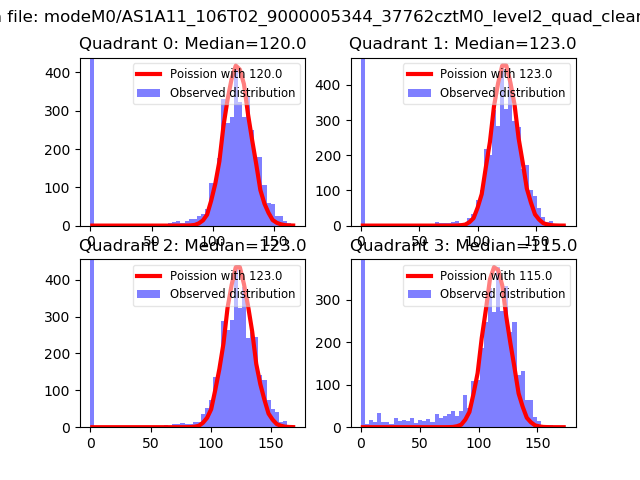 |
 |
| Quadrant-wise count rates Data is divided into 100 sec bins |
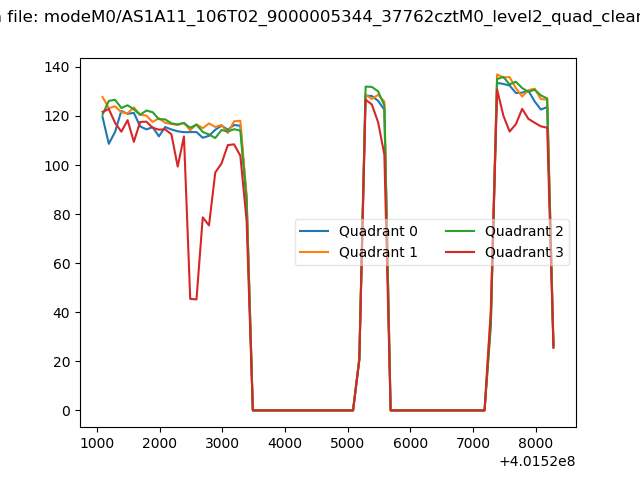 |
|
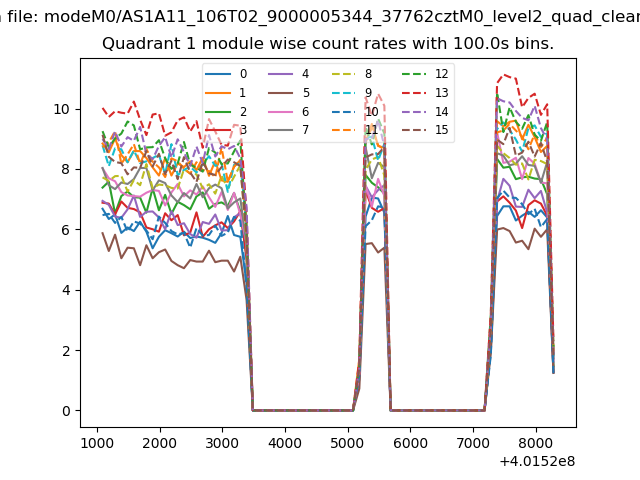
| Module-wise count rates for Quadrant A Data is divided into 100 sec bins |
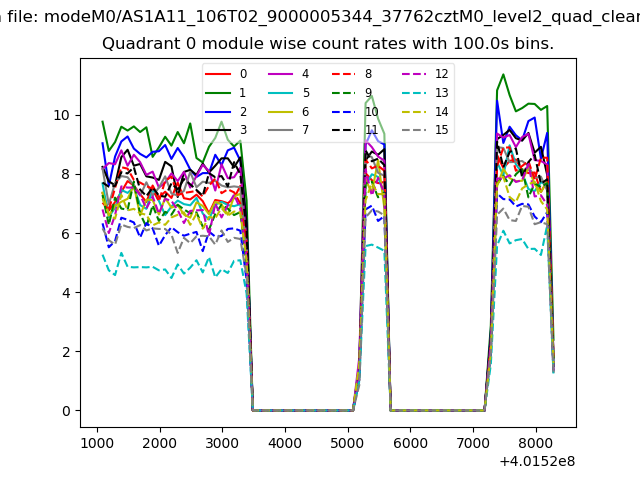 |
 |
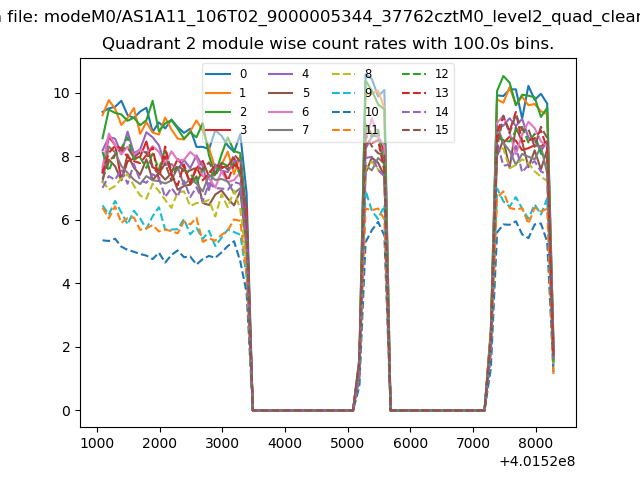
| Module-wise count rates for Quadrant B Data is divided into 100 sec bins |
 |
 |
| Module-wise count rates for Quadrant C Data is divided into 100 sec bins |
 |
 |
| Module-wise count rates for Quadrant D Data is divided into 100 sec bins |
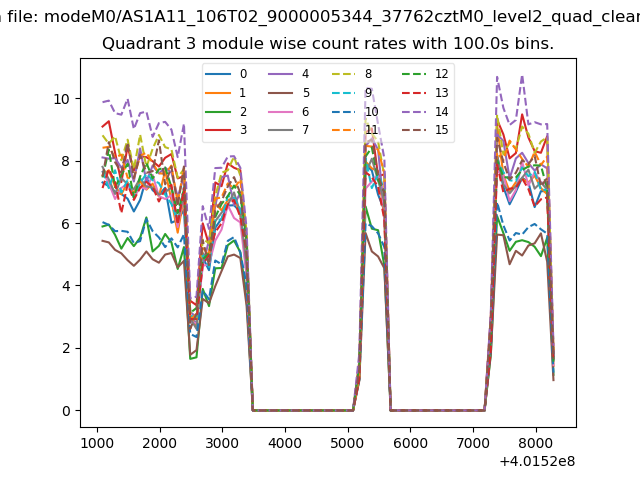 |
 |
| Parameter | Plot |
|---|---|
| CZT HV Monitor | 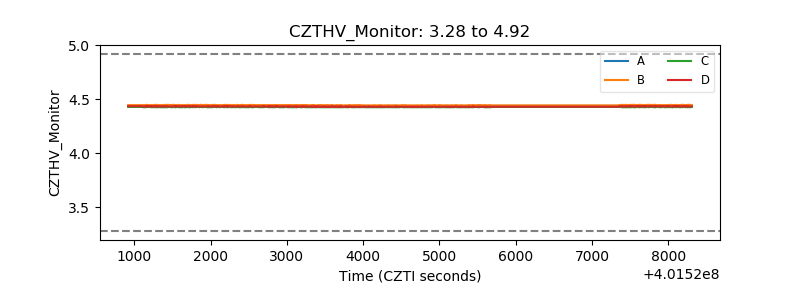 |
| D_VDD | 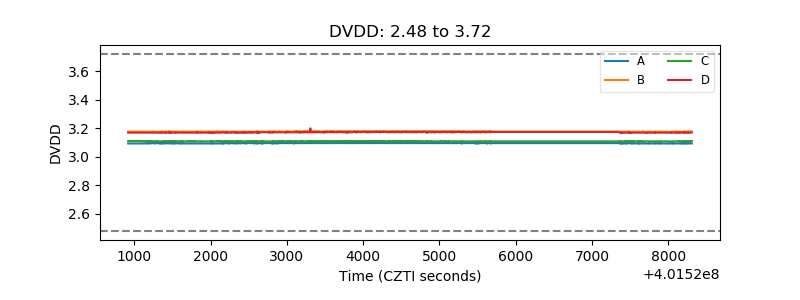 |
| Temperature 1 | 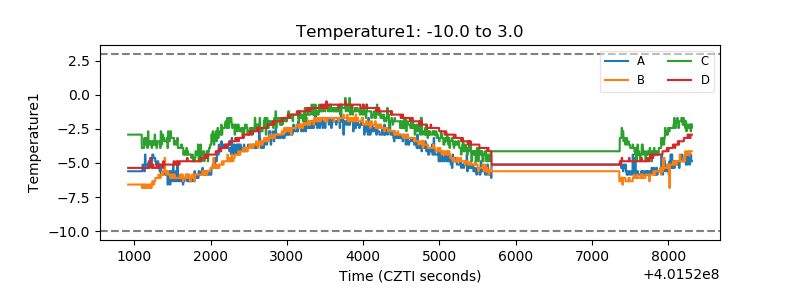 |
| Veto HV Monitor | 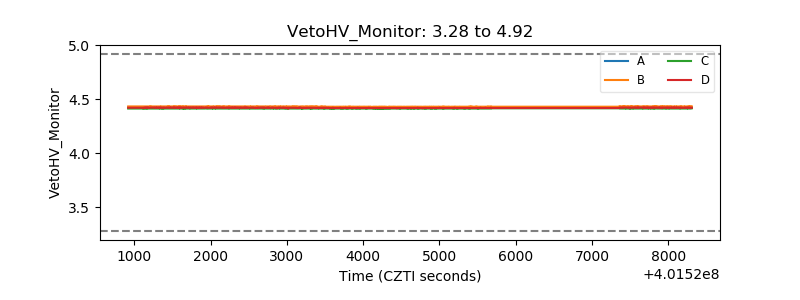 |
| Veto LLD | 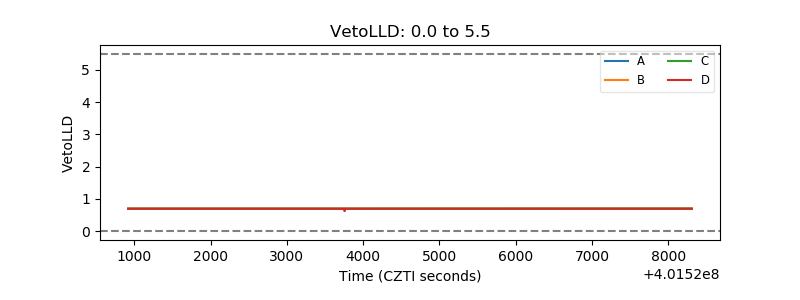 |
| Alpha Counter | 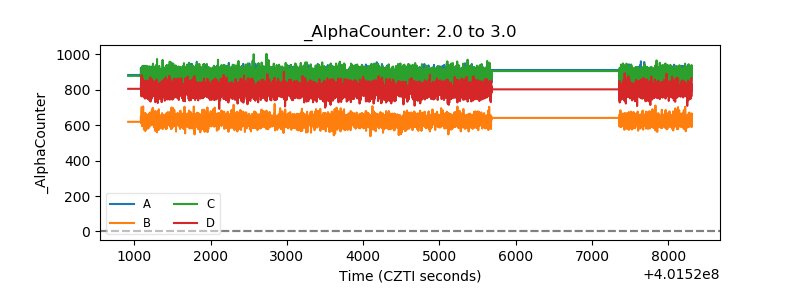 |
| _CPM_Rate | 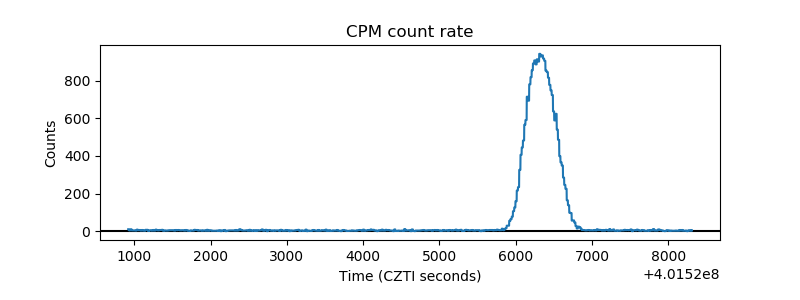 |
| CZT Counter | 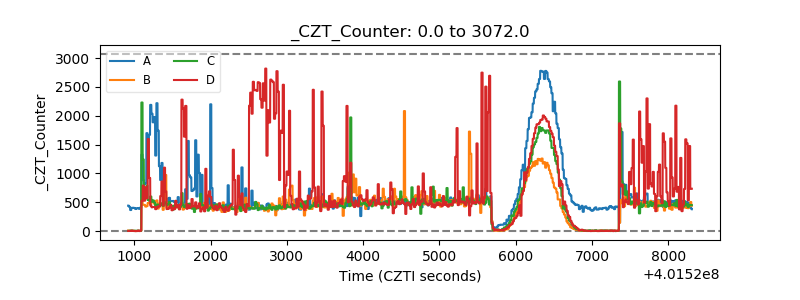 |
| +2.5 Volts monitor | 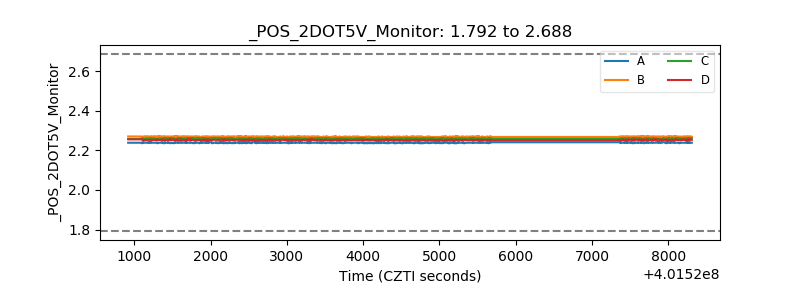 |
| +5 Volts monitor | 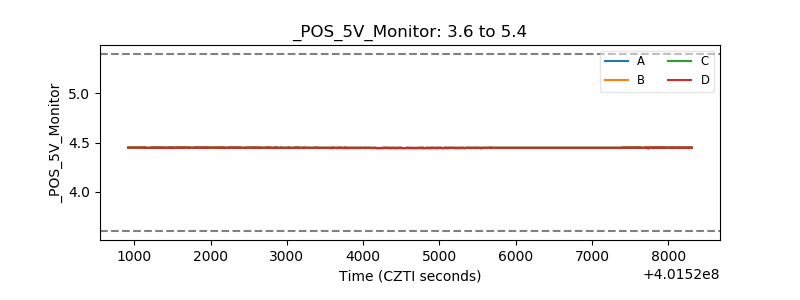 |
| _ROLL_ROT | 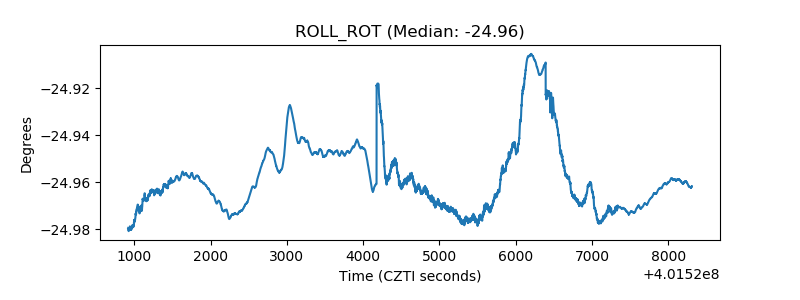 |
| _Roll_DEC | 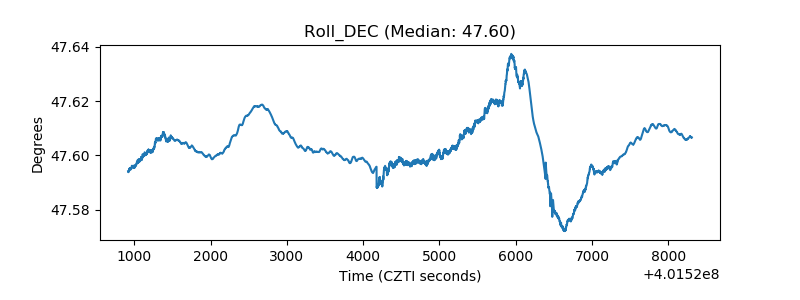 |
| _Roll_RA | 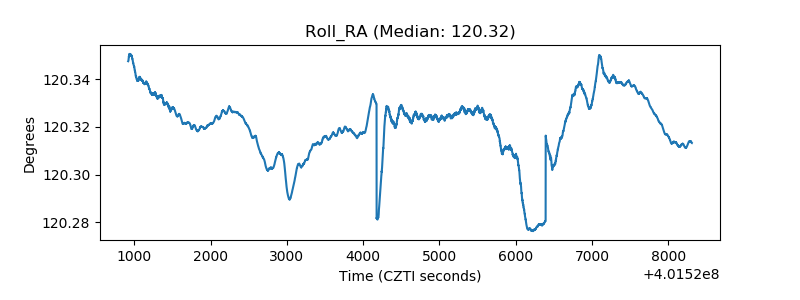 |
| Veto Counter | 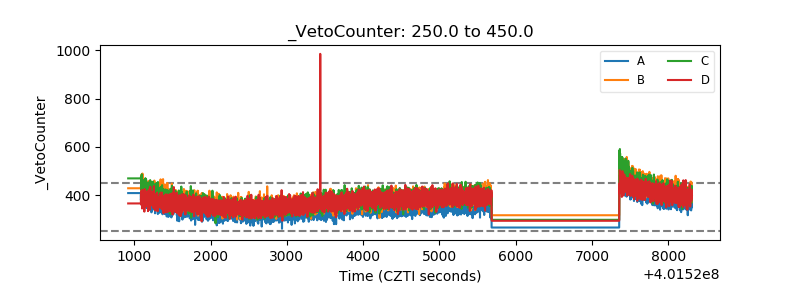 |