| Param | Original file | Final file |
|---|---|---|
| Filename | modeM0/AS1A11_106T02_9000005344_37764cztM0_level2.evt | modeM0/AS1A11_106T02_9000005344_37764cztM0_level2_quad_clean.evt |
| Size (bytes) | 459,400,320 | 71,386,560 |
| Size | 438.1 MB | 68.1 MB |
| Events in quadrant A | 2,815,092 | 453,689 |
| Events in quadrant B | 2,674,708 | 460,449 |
| Events in quadrant C | 2,734,992 | 457,887 |
| Events in quadrant D | 5,328,552 | 418,296 |
| Mode M9 | |||
|---|---|---|---|
| Quadrant | BADHDUFLAG | Total packets | Discarded packets |
| A | 0 | 24 | 0 |
| B | 0 | 24 | 0 |
| C | 0 | 24 | 0 |
| D | 0 | 25 | 0 |
| Mode SS | |||
|---|---|---|---|
| Quadrant | BADHDUFLAG | Total packets | Discarded packets |
| A | 0 | 106 | 0 |
| B | 0 | 106 | 0 |
| C | 0 | 106 | 0 |
| D | 0 | 106 | 0 |
| Mode M0 | |||
|---|---|---|---|
| Quadrant | BADHDUFLAG | Total packets | Discarded packets |
| A | 0 | 11510 | 3 |
| B | 0 | 11386 | 2 |
| C | 0 | 11301 | 2 |
| D | 0 | 19512 | 2 |
| Quadrant | Total seconds | Saturated seconds | Saturation percentage |
|---|---|---|---|
| A | 5308 | 20 | 0.376790% |
| B | 5308 | 40 | 0.753580% |
| C | 5308 | 22 | 0.414469% |
| D | 5308 | 462 | 8.703843% |
Noise dominated data is calculated using 1-second bins in cleaned event files. If a bin has >2000 counts, and if more than 50% of those come from <1% of pixels, then it is considered to be noise-dominated and hence unusable.
| Quadrant | # 1 sec bins | Bins with >0 counts | Bins with >2000 counts | High rate bins dominated by noise | Noise dominated (total time) | Noise dominated (detector-on time) | Marked lightcurve |
|---|---|---|---|---|---|---|---|
| A | 7131 | 5309 | 10 | 10 | 0.14% | 0.19% | 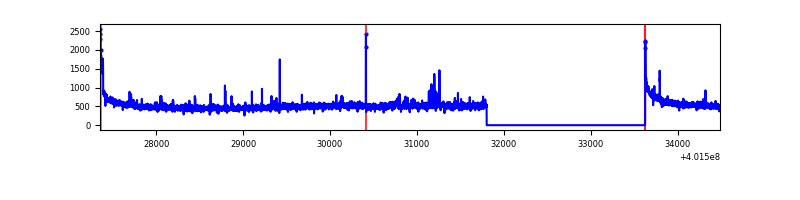 |
| B | 7131 | 5309 | 22 | 22 | 0.31% | 0.41% | 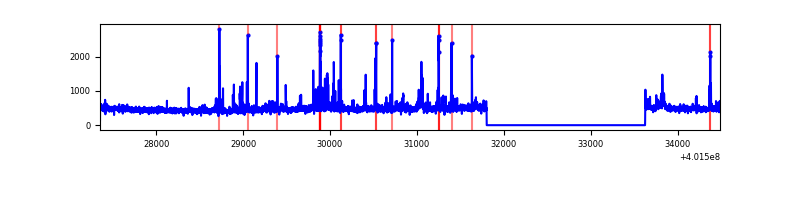 |
| C | 7131 | 5309 | 26 | 26 | 0.36% | 0.49% | 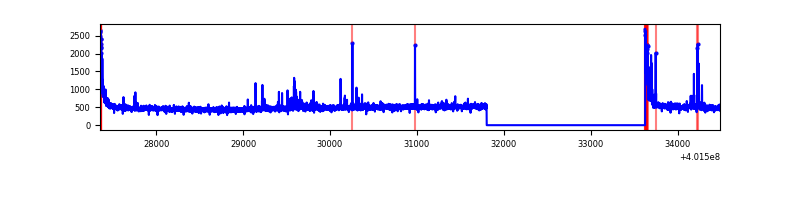 |
| D | 7131 | 5309 | 482 | 482 | 6.76% | 9.08% |  |
Top three noisy pixels from each quadrant. If the there are fewer than three noisy pixels in the level2.evt file, extra rows are filled as -1
| Pixel properties | Quadrant properties | ||||||
|---|---|---|---|---|---|---|---|
| Quadrant | DetID | PixID | Counts | Sigma | Mean | Median | Sigma |
| A | 10 | 83 | 335601 | 2731.18 | 610 | 599 | 122.7 |
| A | 15 | 222 | 27215 | 216.99 | 610 | 599 | 122.7 |
| A | 15 | 254 | 27107 | 216.11 | 610 | 599 | 122.7 |
| B | 0 | 229 | 128860 | 1123.29 | 601 | 584 | 114.2 |
| B | 5 | 255 | 67209 | 583.42 | 601 | 584 | 114.2 |
| B | 5 | 172 | 44956 | 388.56 | 601 | 584 | 114.2 |
| C | 15 | 214 | 230842 | 1690.12 | 588 | 592 | 136.2 |
| C | 0 | 10 | 128734 | 940.61 | 588 | 592 | 136.2 |
| C | 14 | 254 | 40293 | 291.42 | 588 | 592 | 136.2 |
| D | 12 | 235 | 1191609 | 8457.34 | 577 | 563 | 140.8 |
| D | 2 | 249 | 781724 | 5546.84 | 577 | 563 | 140.8 |
| D | 2 | 250 | 462624 | 3280.99 | 577 | 563 | 140.8 |
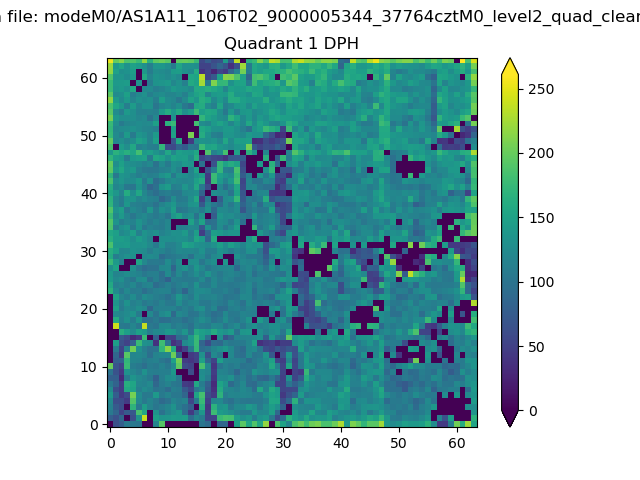
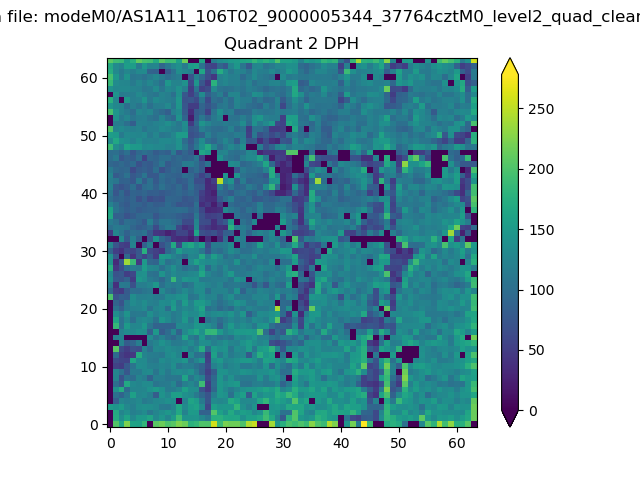
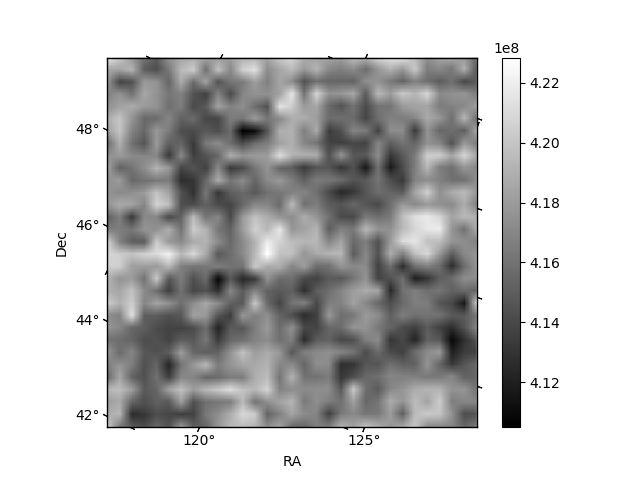
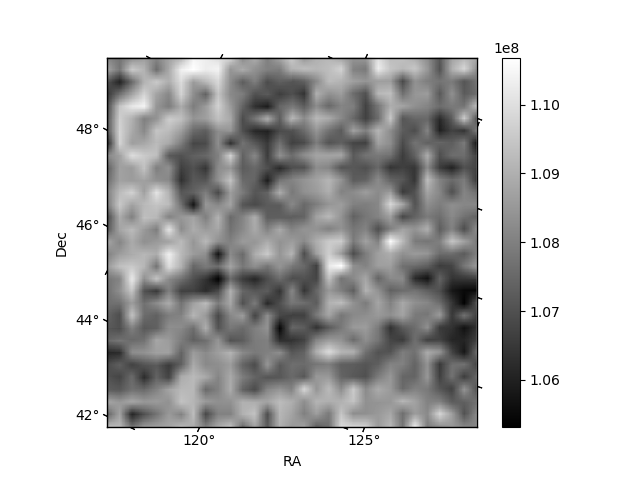
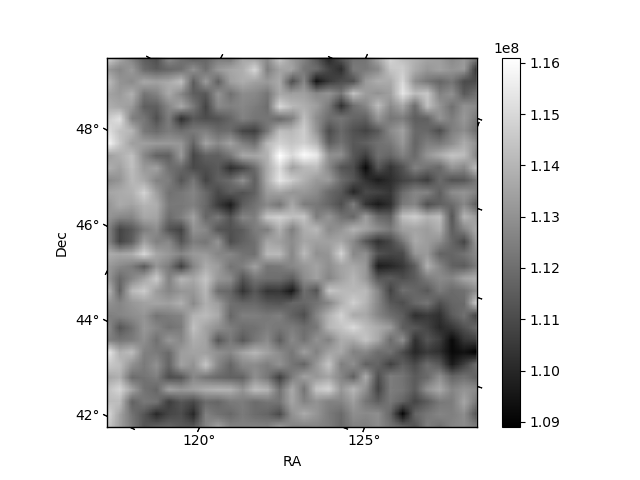
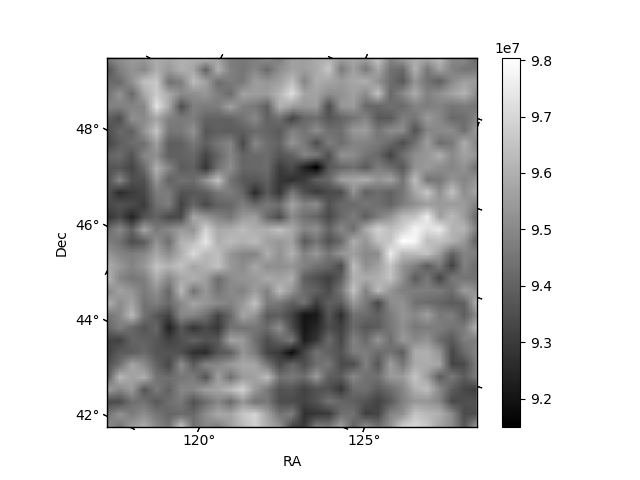
Histogram calculated using DETX and DETY for each event in the final _common_clean file
| Quadrant A | 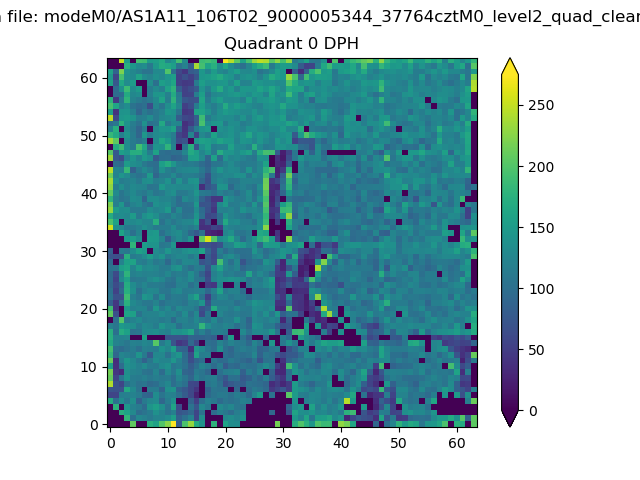 |
 |
Quadrant B |
|---|---|---|---|
| Quadrant D | 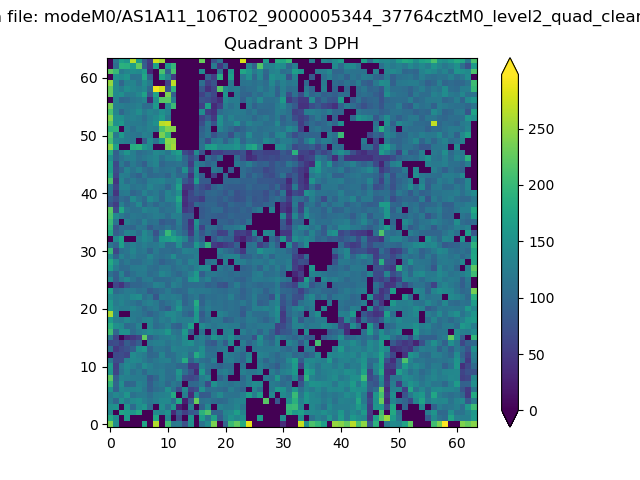 |
 |
Quadrant C |
| Plot type | Count rate plots | Images |
|---|---|---|
| Comparison with Poisson distribution Blue bars denote a histogram of data divided into 1 sec bins. Red curve is a Poisson curve with rate = median count rate of data. |
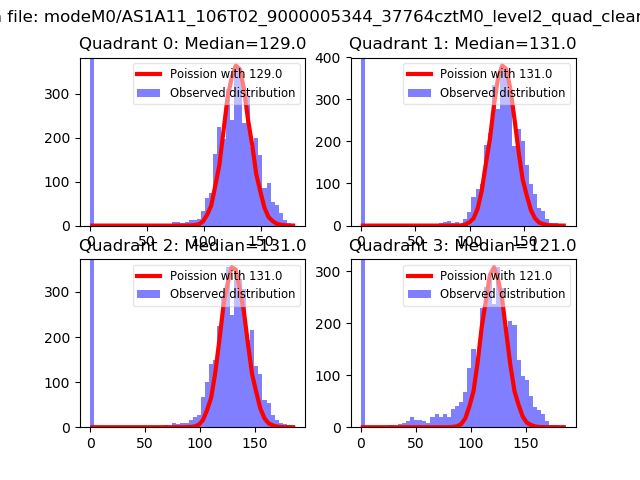 |
 |
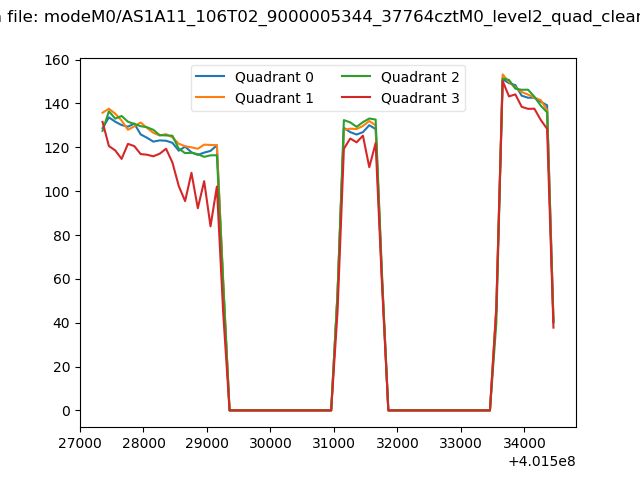
| Quadrant-wise count rates Data is divided into 100 sec bins |
 |
|
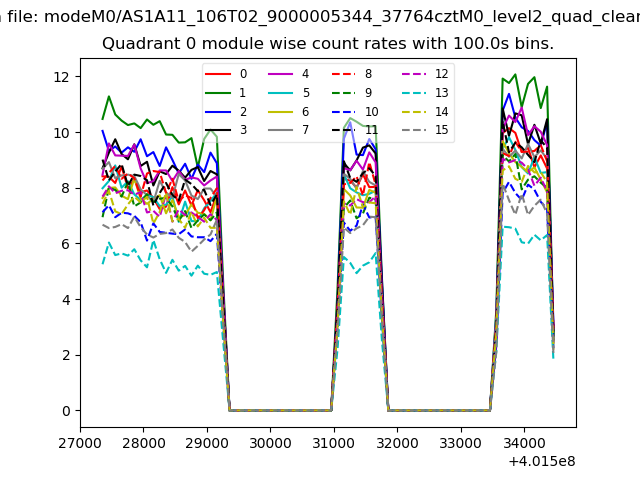
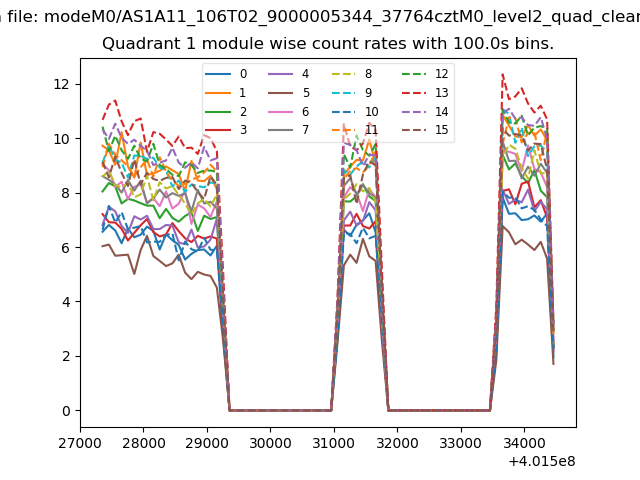
| Module-wise count rates for Quadrant A Data is divided into 100 sec bins |
 |
 |
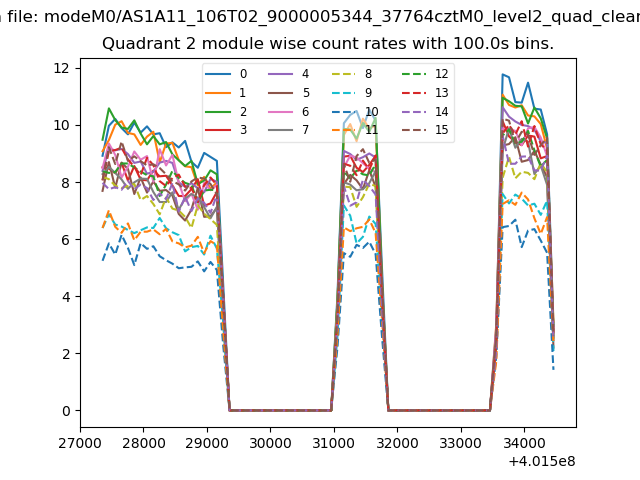
| Module-wise count rates for Quadrant B Data is divided into 100 sec bins |
 |
 |
| Module-wise count rates for Quadrant C Data is divided into 100 sec bins |
 |
 |
| Module-wise count rates for Quadrant D Data is divided into 100 sec bins |
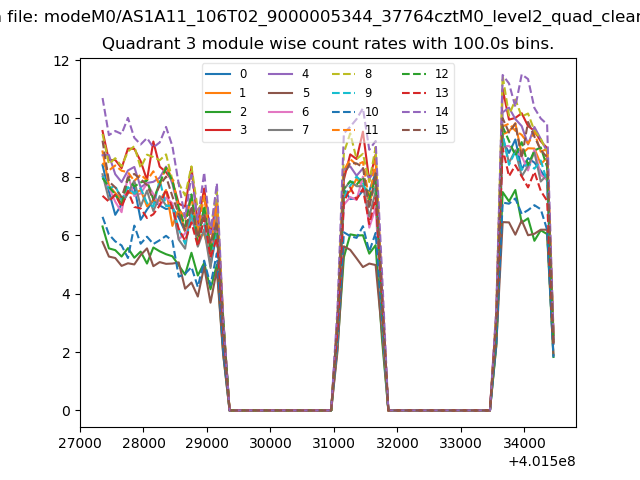 |
 |
| Parameter | Plot |
|---|---|
| CZT HV Monitor |  |
| D_VDD | 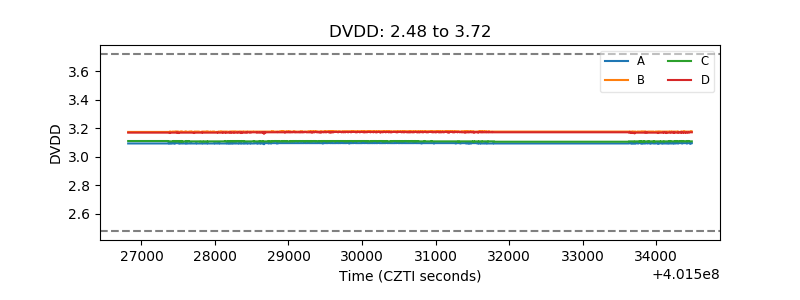 |
| Temperature 1 | 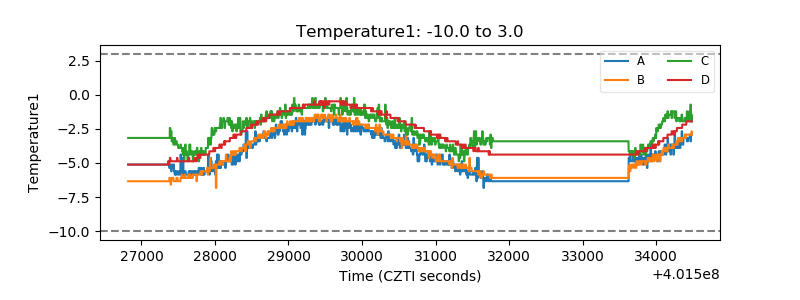 |
| Veto HV Monitor | 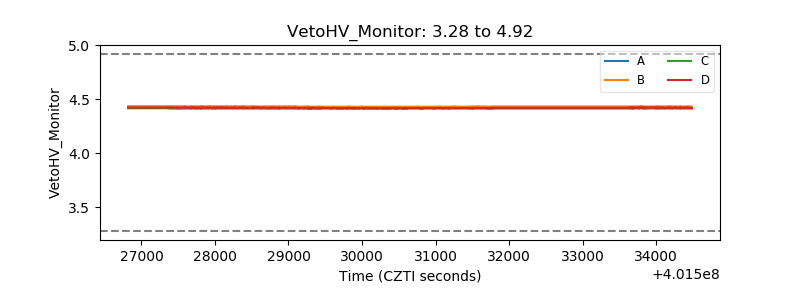 |
| Veto LLD | 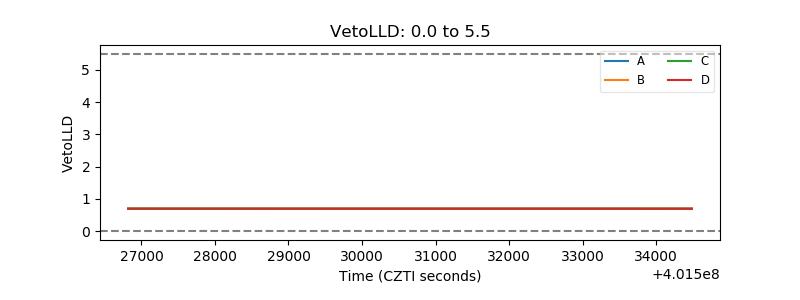 |
| Alpha Counter | 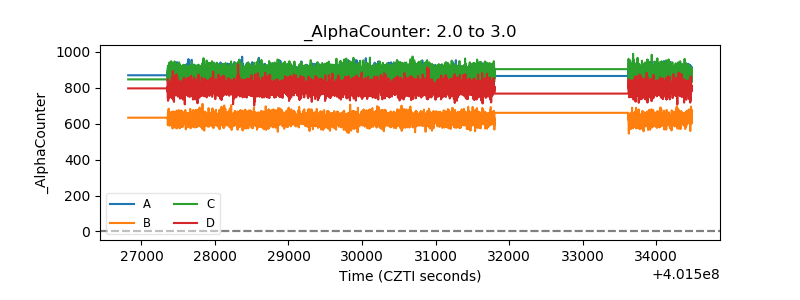 |
| _CPM_Rate | 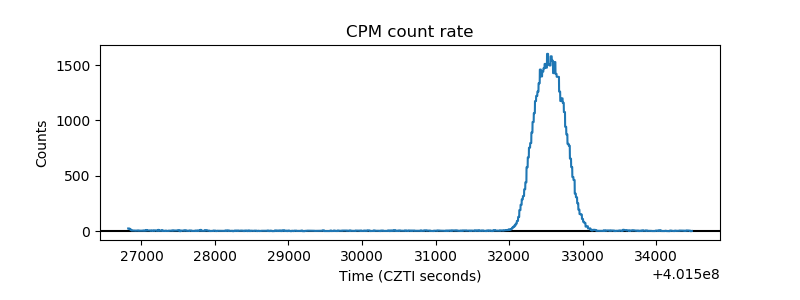 |
| CZT Counter | 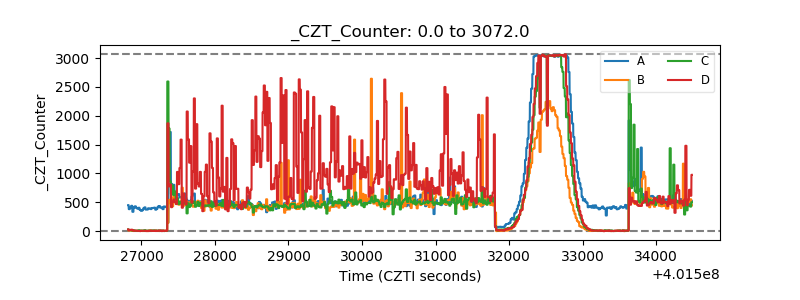 |
| +2.5 Volts monitor | 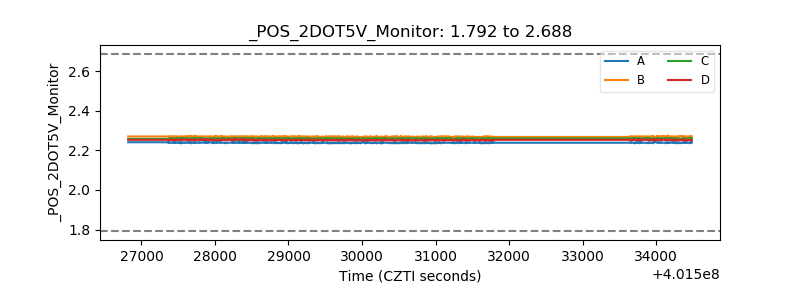 |
| +5 Volts monitor | 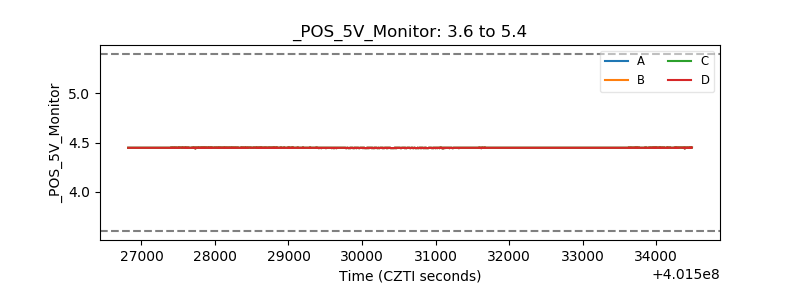 |
| _ROLL_ROT | 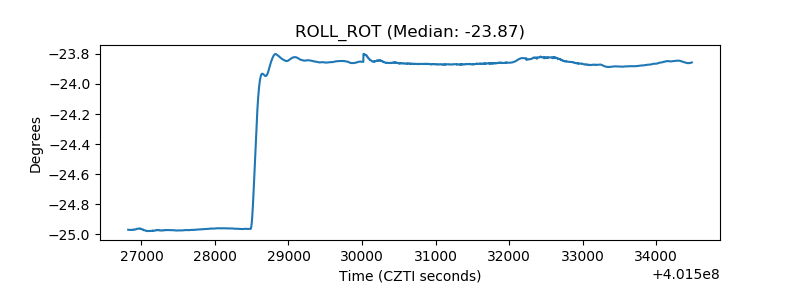 |
| _Roll_DEC | 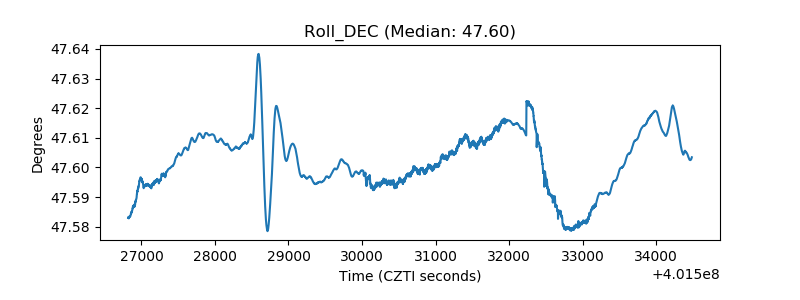 |
| _Roll_RA | 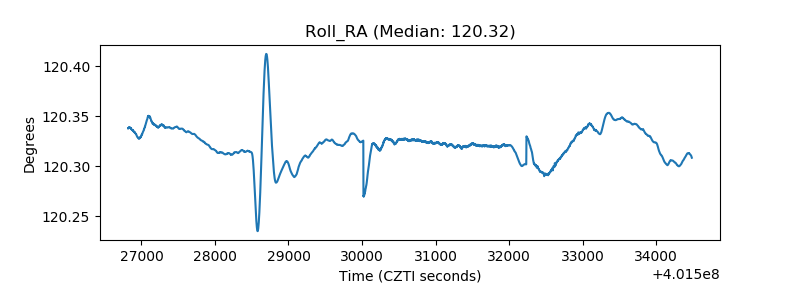 |
| Veto Counter | 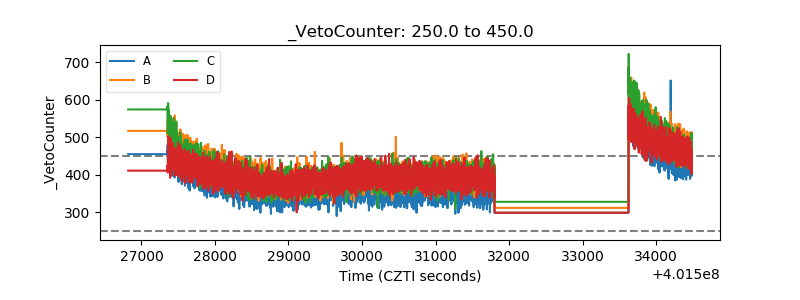 |