| Param | Original file | Final file |
|---|---|---|
| Filename | modeM0/AS1A11_106T02_9000005344_37765cztM0_level2.evt | modeM0/AS1A11_106T02_9000005344_37765cztM0_level2_quad_clean.evt |
| Size (bytes) | 441,570,240 | 70,153,920 |
| Size | 421.1 MB | 66.9 MB |
| Events in quadrant A | 2,786,132 | 452,115 |
| Events in quadrant B | 3,093,288 | 448,635 |
| Events in quadrant C | 2,629,160 | 449,601 |
| Events in quadrant D | 4,524,207 | 422,204 |
| Mode M9 | |||
|---|---|---|---|
| Quadrant | BADHDUFLAG | Total packets | Discarded packets |
| A | 0 | 19 | 0 |
| B | 0 | 19 | 0 |
| C | 0 | 19 | 0 |
| D | 0 | 19 | 0 |
| Mode SS | |||
|---|---|---|---|
| Quadrant | BADHDUFLAG | Total packets | Discarded packets |
| A | 0 | 102 | 0 |
| B | 0 | 102 | 0 |
| C | 0 | 102 | 0 |
| D | 0 | 102 | 0 |
| Mode M0 | |||
|---|---|---|---|
| Quadrant | BADHDUFLAG | Total packets | Discarded packets |
| A | 0 | 11145 | 2 |
| B | 0 | 12292 | 1 |
| C | 0 | 10604 | 1 |
| D | 0 | 16978 | 1 |
| Quadrant | Total seconds | Saturated seconds | Saturation percentage |
|---|---|---|---|
| A | 5017 | 18 | 0.358780% |
| B | 5017 | 126 | 2.511461% |
| C | 5017 | 11 | 0.219255% |
| D | 5017 | 204 | 4.066175% |
Noise dominated data is calculated using 1-second bins in cleaned event files. If a bin has >2000 counts, and if more than 50% of those come from <1% of pixels, then it is considered to be noise-dominated and hence unusable.
| Quadrant | # 1 sec bins | Bins with >0 counts | Bins with >2000 counts | High rate bins dominated by noise | Noise dominated (total time) | Noise dominated (detector-on time) | Marked lightcurve |
|---|---|---|---|---|---|---|---|
| A | 6960 | 5018 | 10 | 10 | 0.14% | 0.20% | 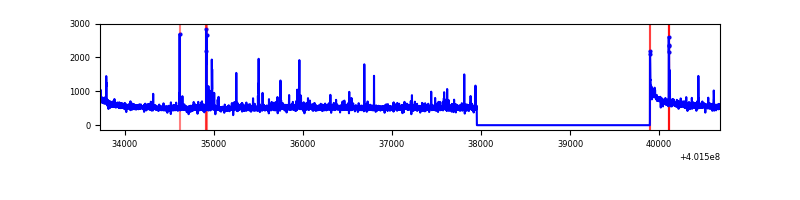 |
| B | 6960 | 5018 | 108 | 108 | 1.55% | 2.15% | 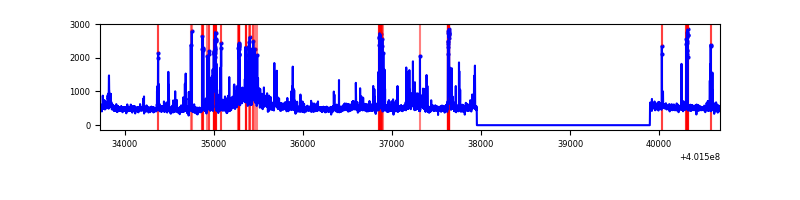 |
| C | 6960 | 5018 | 12 | 12 | 0.17% | 0.24% | 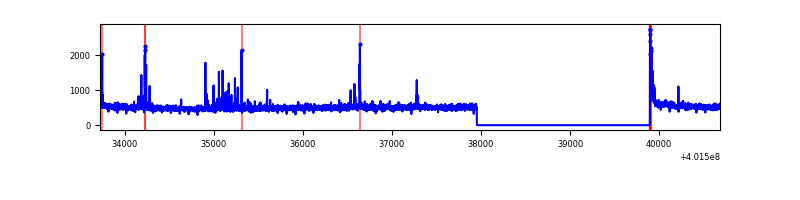 |
| D | 6960 | 5018 | 196 | 196 | 2.82% | 3.91% | 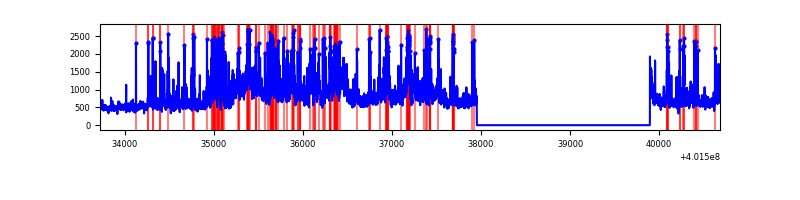 |
Top three noisy pixels from each quadrant. If the there are fewer than three noisy pixels in the level2.evt file, extra rows are filled as -1
| Pixel properties | Quadrant properties | ||||||
|---|---|---|---|---|---|---|---|
| Quadrant | DetID | PixID | Counts | Sigma | Mean | Median | Sigma |
| A | 10 | 83 | 298427 | 2478.46 | 606 | 596 | 120.2 |
| A | 9 | 143 | 83593 | 690.68 | 606 | 596 | 120.2 |
| A | 6 | 10 | 29655 | 241.82 | 606 | 596 | 120.2 |
| B | 0 | 229 | 204391 | 1863.64 | 587 | 574 | 109.4 |
| B | 5 | 255 | 178746 | 1629.15 | 587 | 574 | 109.4 |
| B | 0 | 189 | 125888 | 1145.83 | 587 | 574 | 109.4 |
| C | 15 | 214 | 219131 | 1629.25 | 582 | 586 | 134.1 |
| C | 14 | 254 | 53328 | 393.19 | 582 | 586 | 134.1 |
| C | 0 | 10 | 47333 | 348.5 | 582 | 586 | 134.1 |
| D | 12 | 235 | 1194534 | 8301.07 | 583 | 565 | 143.8 |
| D | 2 | 249 | 378638 | 2628.55 | 583 | 565 | 143.8 |
| D | 10 | 1 | 195908 | 1358.12 | 583 | 565 | 143.8 |
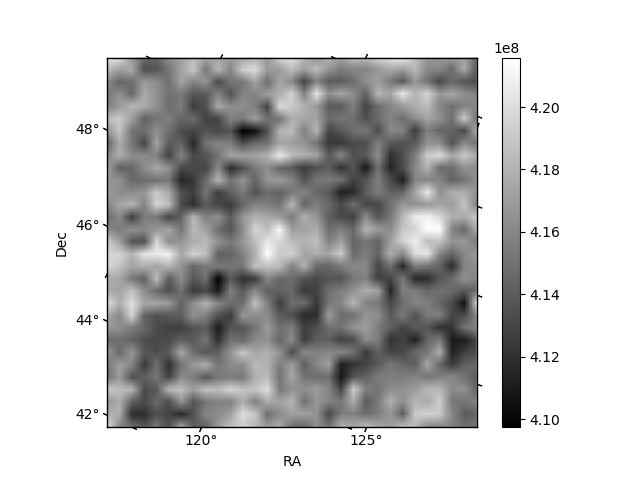
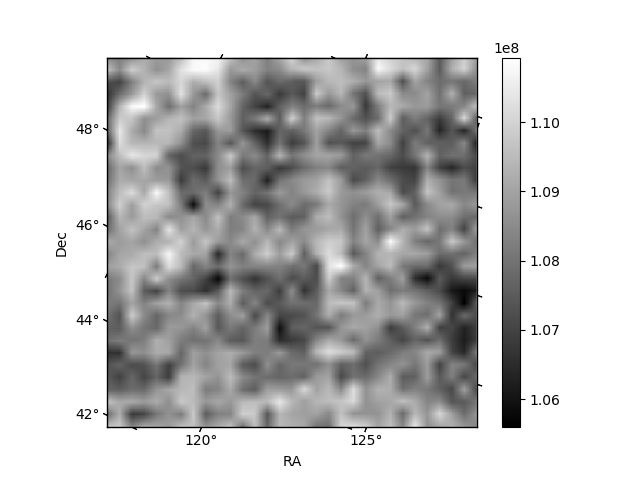
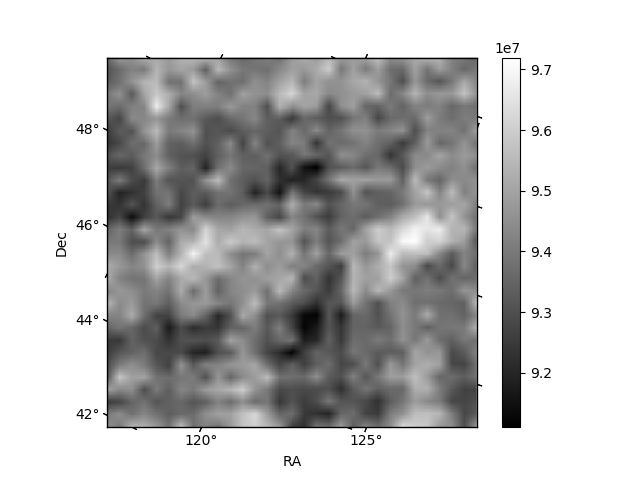
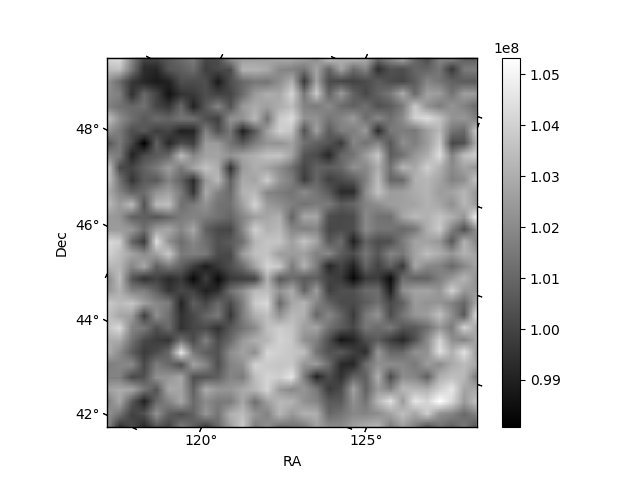
Histogram calculated using DETX and DETY for each event in the final _common_clean file
| Quadrant A | 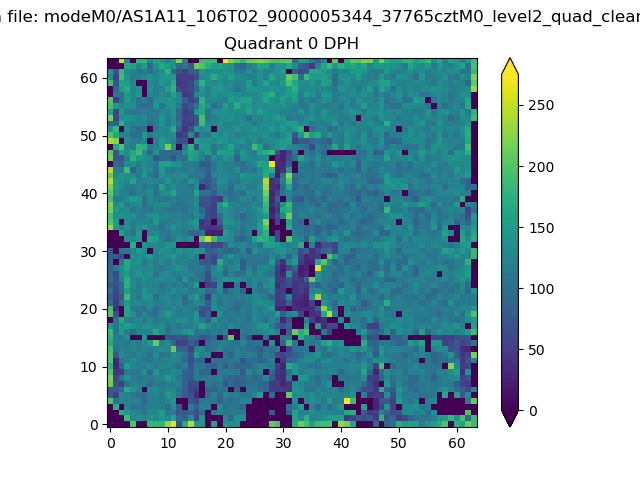 |
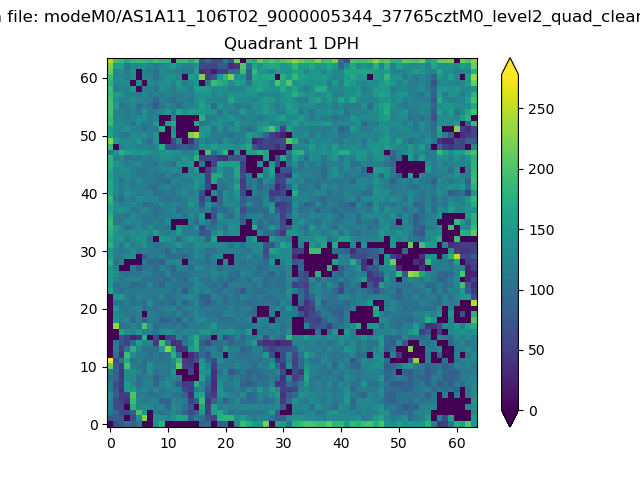 |
Quadrant B |
|---|---|---|---|
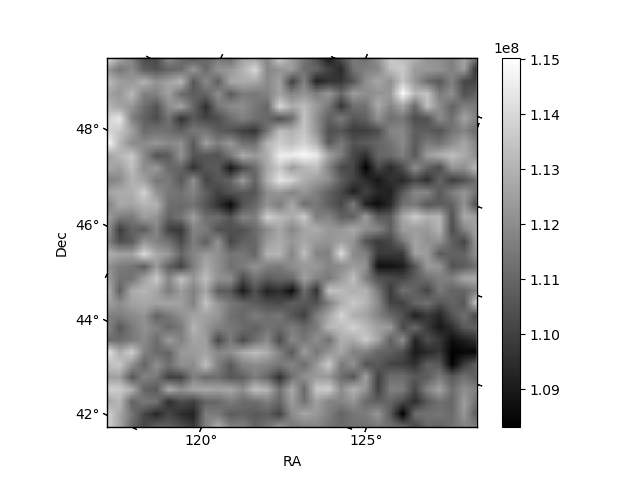
| Quadrant D | 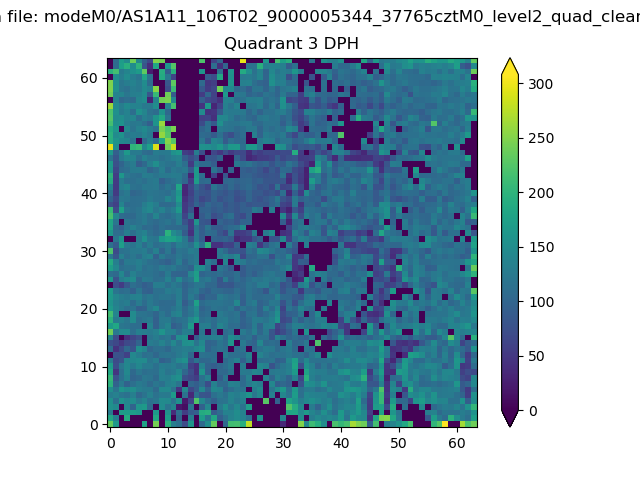 |
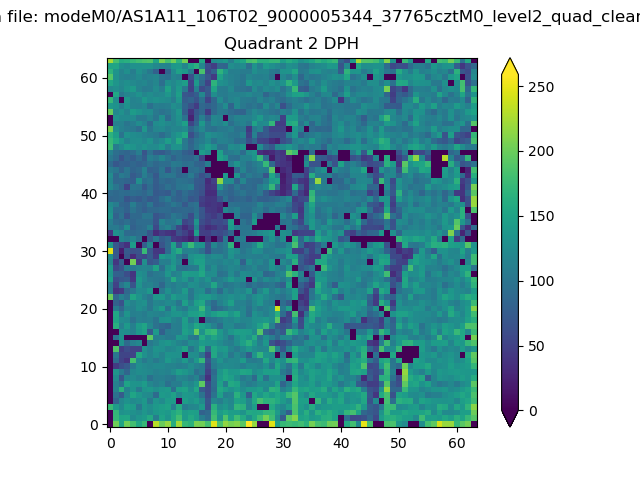 |
Quadrant C |
| Plot type | Count rate plots | Images |
|---|---|---|
| Comparison with Poisson distribution Blue bars denote a histogram of data divided into 1 sec bins. Red curve is a Poisson curve with rate = median count rate of data. |
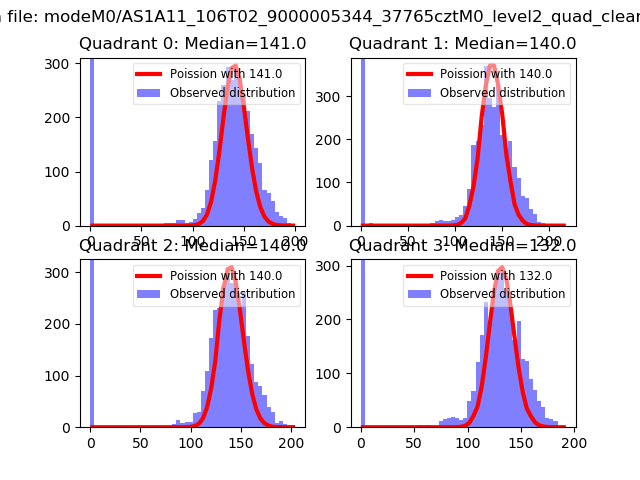 |
 |
| Quadrant-wise count rates Data is divided into 100 sec bins |
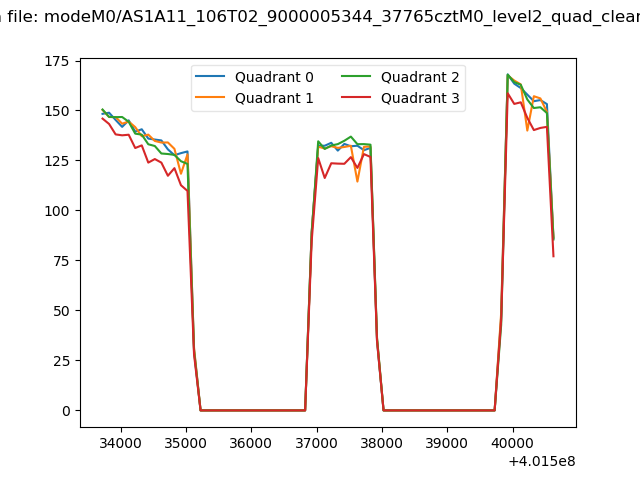 |
|
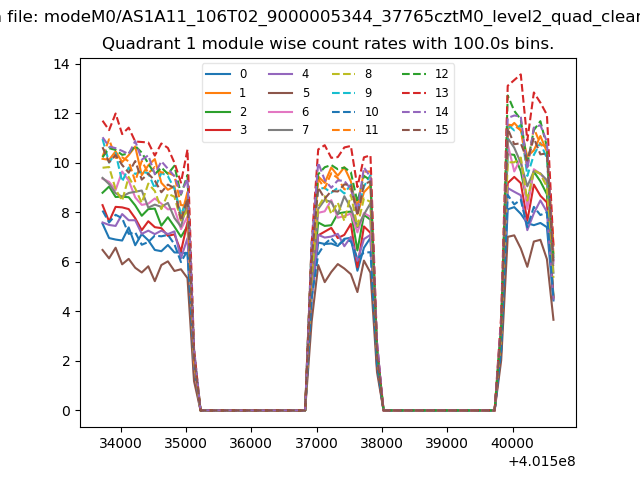
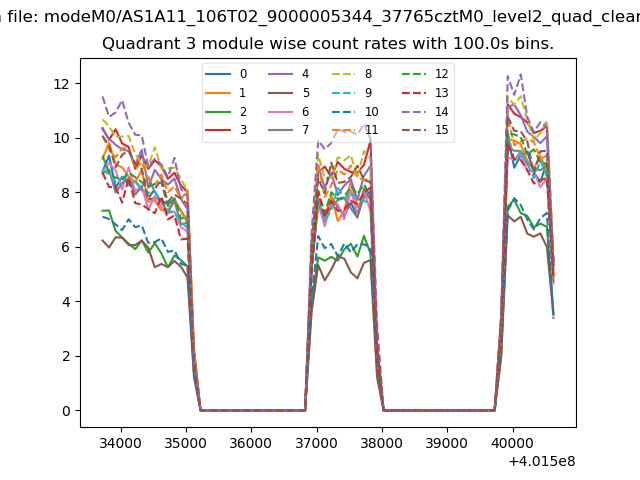
| Module-wise count rates for Quadrant A Data is divided into 100 sec bins |
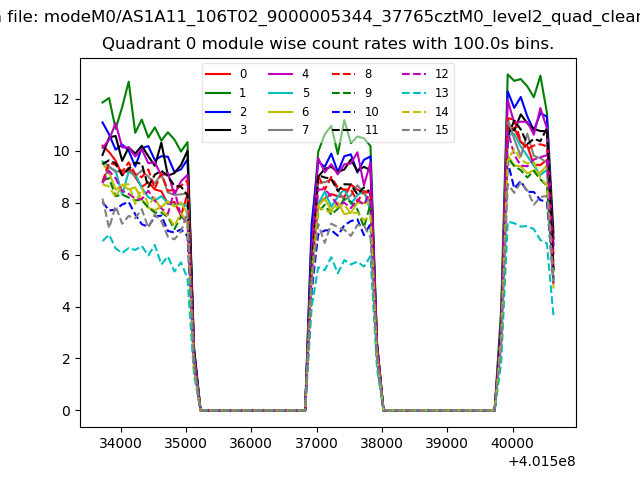 |
 |
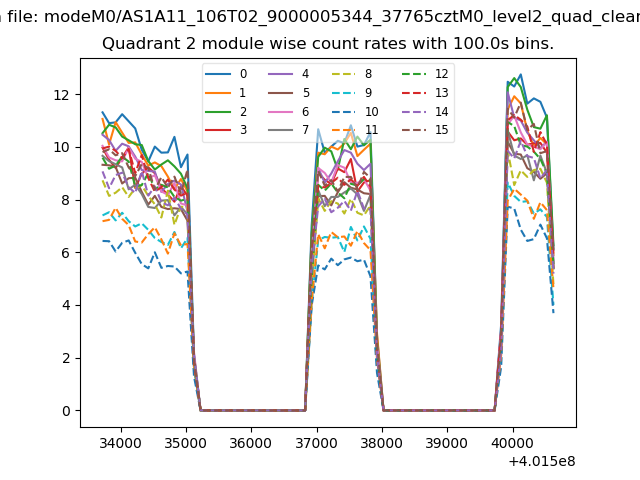
| Module-wise count rates for Quadrant B Data is divided into 100 sec bins |
 |
 |
| Module-wise count rates for Quadrant C Data is divided into 100 sec bins |
 |
 |
| Module-wise count rates for Quadrant D Data is divided into 100 sec bins |
 |
 |
| Parameter | Plot |
|---|---|
| CZT HV Monitor | 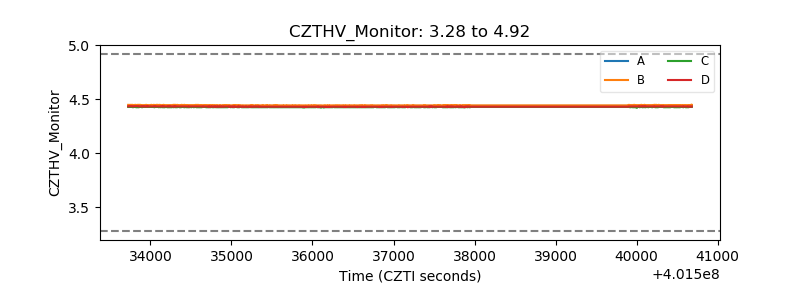 |
| D_VDD | 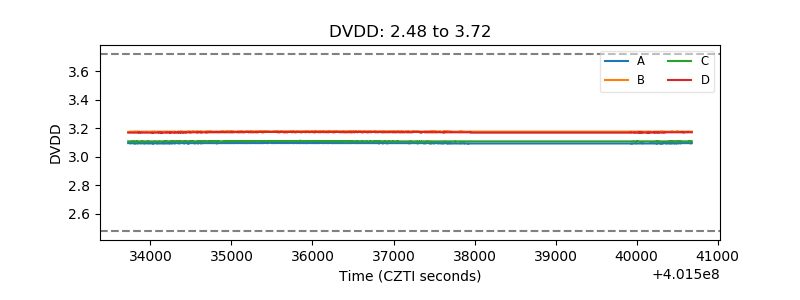 |
| Temperature 1 | 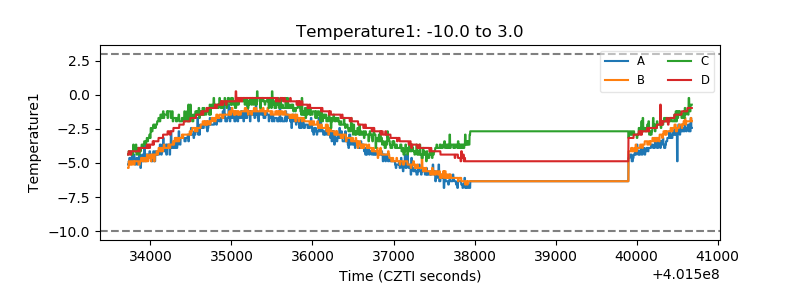 |
| Veto HV Monitor | 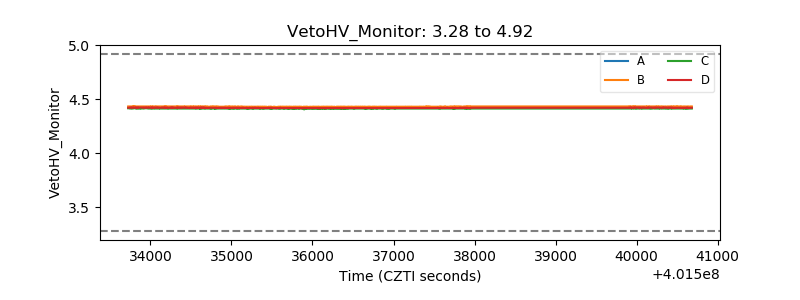 |
| Veto LLD | 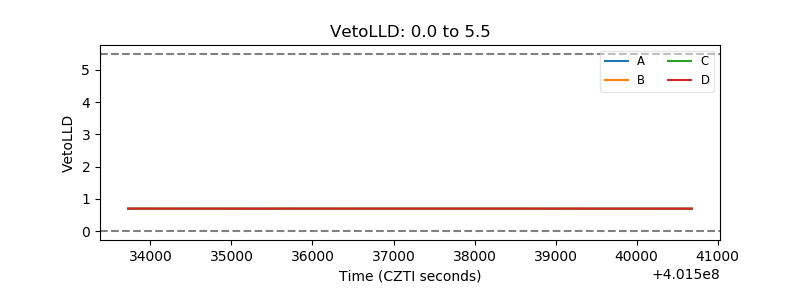 |
| Alpha Counter | 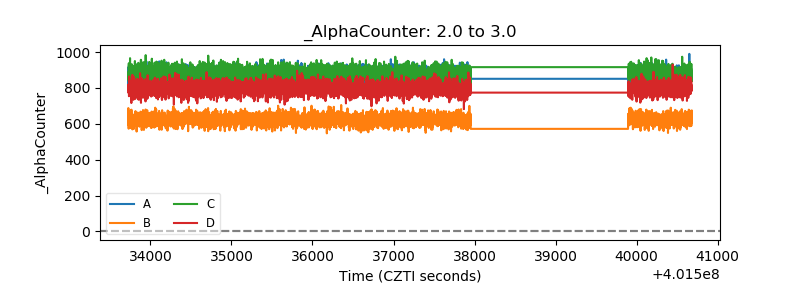 |
| _CPM_Rate | 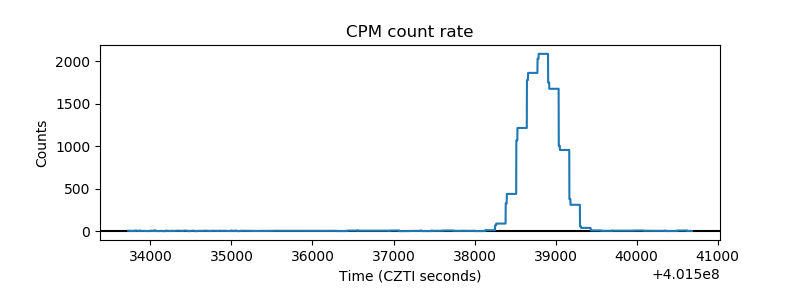 |
| CZT Counter | 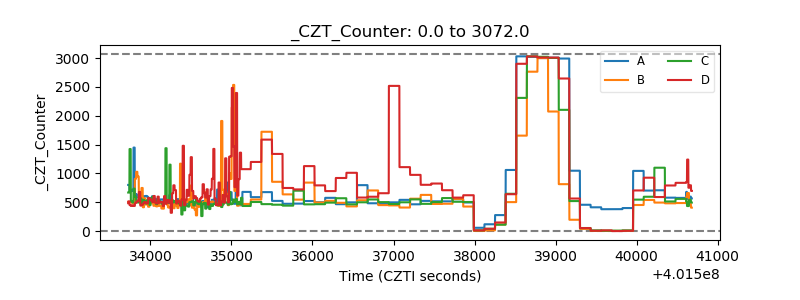 |
| +2.5 Volts monitor | 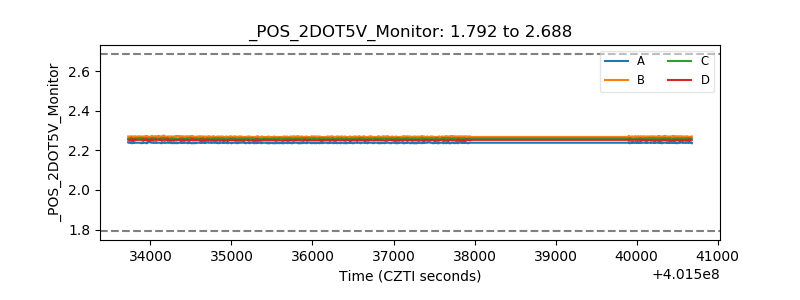 |
| +5 Volts monitor | 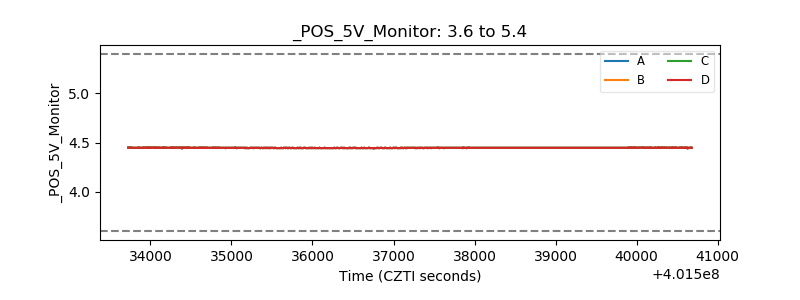 |
| _ROLL_ROT | 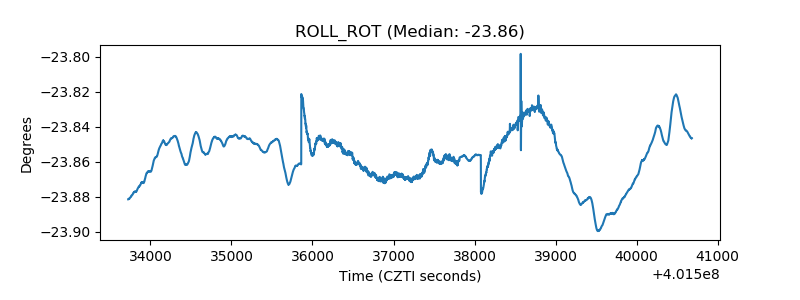 |
| _Roll_DEC | 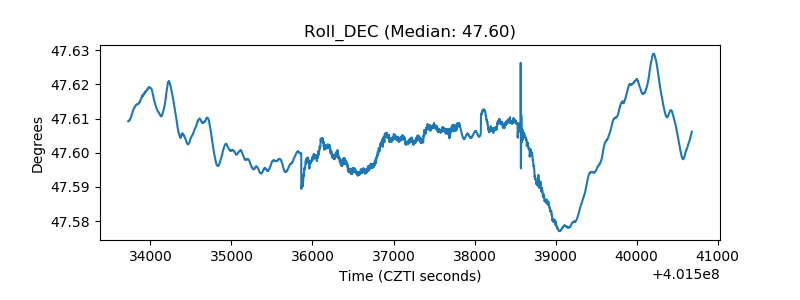 |
| _Roll_RA | 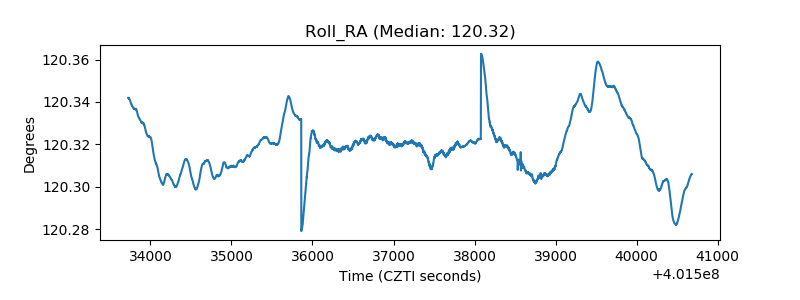 |
| Veto Counter | 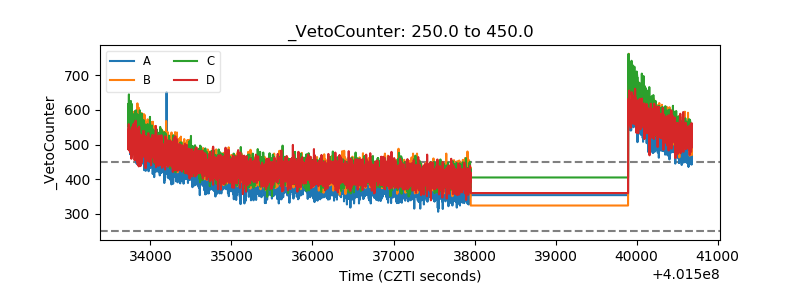 |