| Param | Original file | Final file |
|---|---|---|
| Filename | modeM0/AS1A11_106T02_9000005344_37766cztM0_level2.evt | modeM0/AS1A11_106T02_9000005344_37766cztM0_level2_quad_clean.evt |
| Size (bytes) | 518,204,160 | 70,194,240 |
| Size | 494.2 MB | 66.9 MB |
| Events in quadrant A | 2,953,473 | 454,872 |
| Events in quadrant B | 3,070,888 | 452,487 |
| Events in quadrant C | 2,687,935 | 454,965 |
| Events in quadrant D | 6,645,423 | 414,561 |
| Mode M9 | |||
|---|---|---|---|
| Quadrant | BADHDUFLAG | Total packets | Discarded packets |
| A | 0 | 21 | 0 |
| B | 0 | 21 | 0 |
| C | 0 | 21 | 0 |
| D | 0 | 21 | 0 |
| Mode SS | |||
|---|---|---|---|
| Quadrant | BADHDUFLAG | Total packets | Discarded packets |
| A | 0 | 102 | 0 |
| B | 0 | 102 | 0 |
| C | 0 | 102 | 0 |
| D | 0 | 102 | 0 |
| Mode M0 | |||
|---|---|---|---|
| Quadrant | BADHDUFLAG | Total packets | Discarded packets |
| A | 0 | 11687 | 3 |
| B | 0 | 12187 | 2 |
| C | 0 | 10652 | 2 |
| D | 0 | 23300 | 2 |
| Quadrant | Total seconds | Saturated seconds | Saturation percentage |
|---|---|---|---|
| A | 4966 | 51 | 1.026983% |
| B | 4966 | 111 | 2.235199% |
| C | 4966 | 21 | 0.422876% |
| D | 4967 | 717 | 14.435273% |
Noise dominated data is calculated using 1-second bins in cleaned event files. If a bin has >2000 counts, and if more than 50% of those come from <1% of pixels, then it is considered to be noise-dominated and hence unusable.
| Quadrant | # 1 sec bins | Bins with >0 counts | Bins with >2000 counts | High rate bins dominated by noise | Noise dominated (total time) | Noise dominated (detector-on time) | Marked lightcurve |
|---|---|---|---|---|---|---|---|
| A | 7029 | 4967 | 41 | 41 | 0.58% | 0.83% | 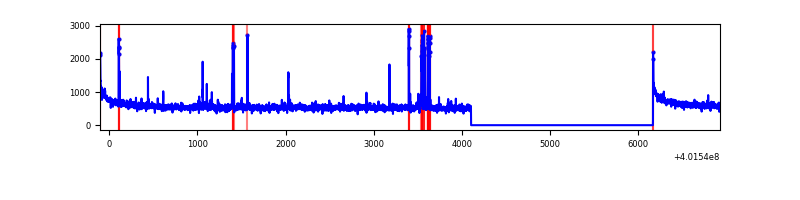 |
| B | 7029 | 4967 | 86 | 86 | 1.22% | 1.73% | 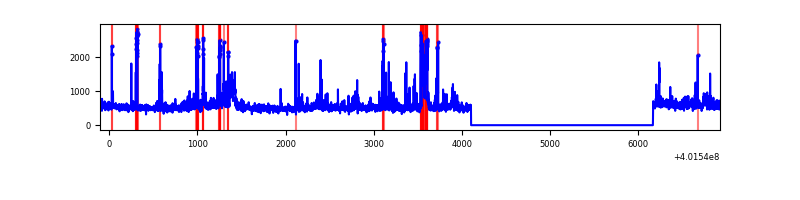 |
| C | 7029 | 4967 | 21 | 21 | 0.30% | 0.42% | 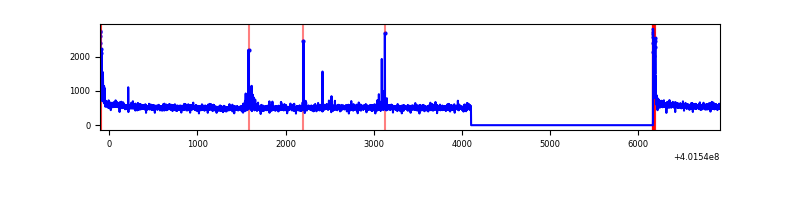 |
| D | 7030 | 4968 | 850 | 850 | 12.09% | 17.11% | 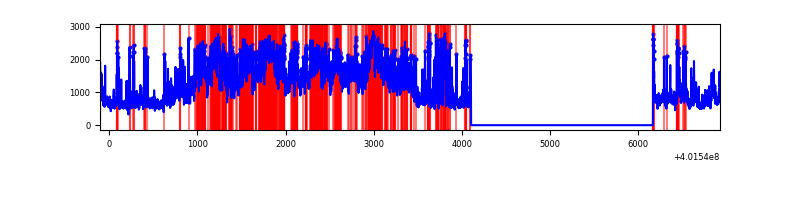 |
Top three noisy pixels from each quadrant. If the there are fewer than three noisy pixels in the level2.evt file, extra rows are filled as -1
| Pixel properties | Quadrant properties | ||||||
|---|---|---|---|---|---|---|---|
| Quadrant | DetID | PixID | Counts | Sigma | Mean | Median | Sigma |
| A | 10 | 83 | 330859 | 2652.09 | 624 | 614 | 124.5 |
| A | 9 | 143 | 159016 | 1272.08 | 624 | 614 | 124.5 |
| A | 12 | 189 | 22584 | 176.43 | 624 | 614 | 124.5 |
| B | 4 | 81 | 133758 | 1196.0 | 605 | 592 | 111.3 |
| B | 5 | 184 | 129981 | 1162.08 | 605 | 592 | 111.3 |
| B | 5 | 255 | 120739 | 1079.08 | 605 | 592 | 111.3 |
| C | 15 | 214 | 216359 | 1571.01 | 601 | 607 | 137.3 |
| C | 0 | 10 | 84057 | 607.65 | 601 | 607 | 137.3 |
| C | 15 | 208 | 21992 | 155.72 | 601 | 607 | 137.3 |
| D | 12 | 235 | 3375064 | 23639.63 | 589 | 573 | 142.7 |
| D | 2 | 249 | 474654 | 3321.12 | 589 | 573 | 142.7 |
| D | 13 | 249 | 149740 | 1044.97 | 589 | 573 | 142.7 |
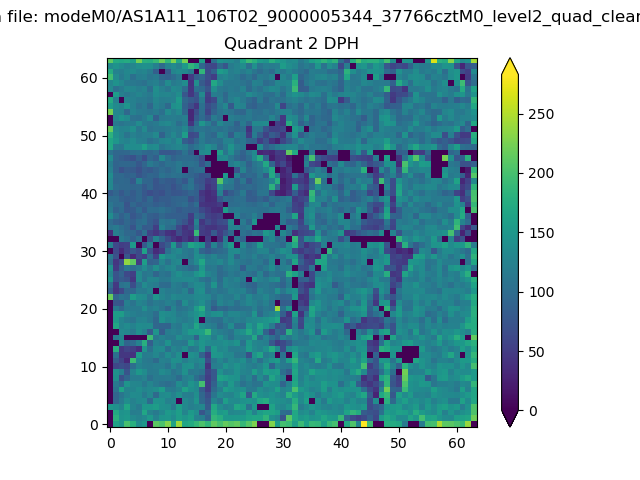
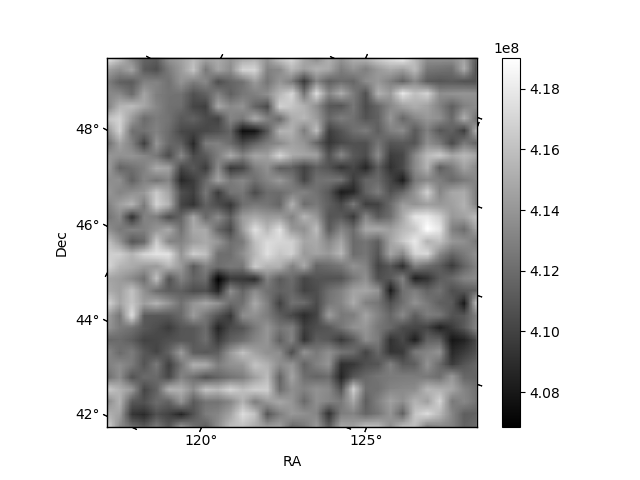
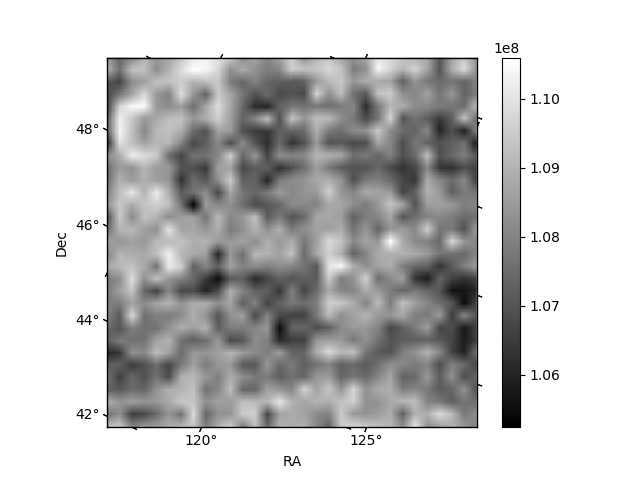
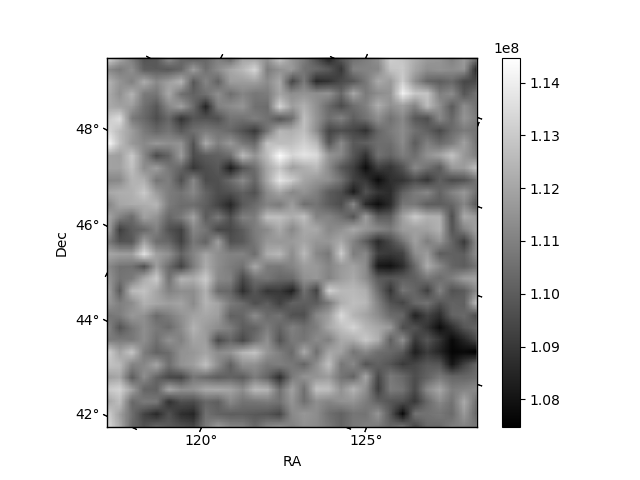
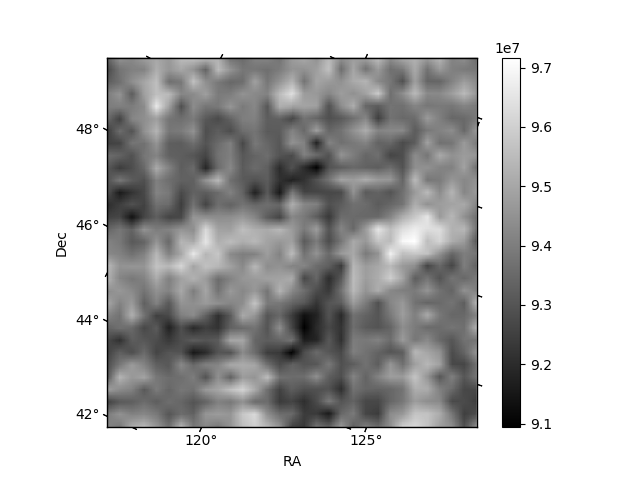
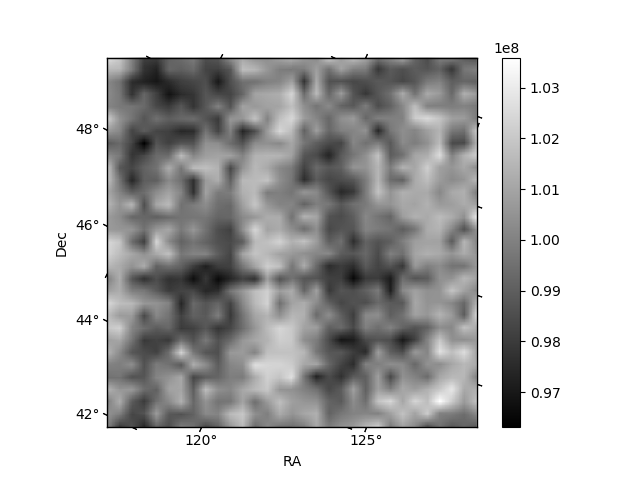
Histogram calculated using DETX and DETY for each event in the final _common_clean file
| Quadrant A | 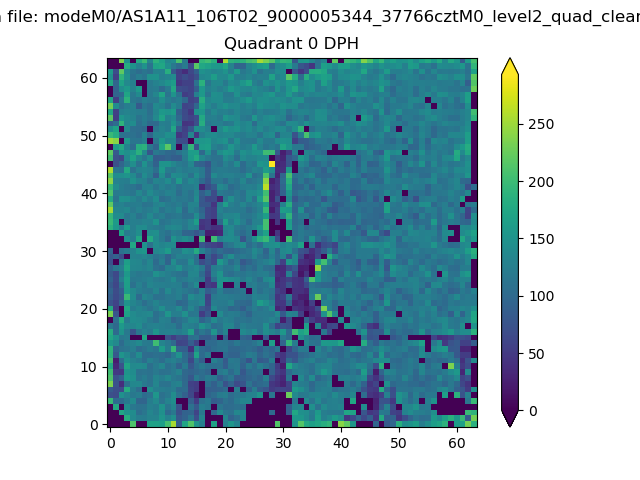 |
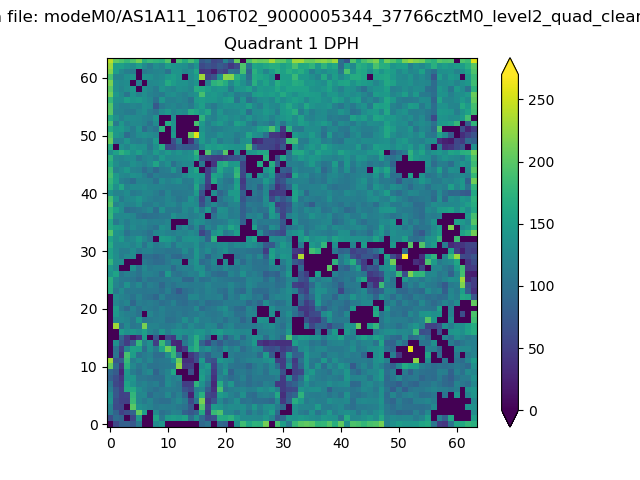 |
Quadrant B |
|---|---|---|---|
| Quadrant D | 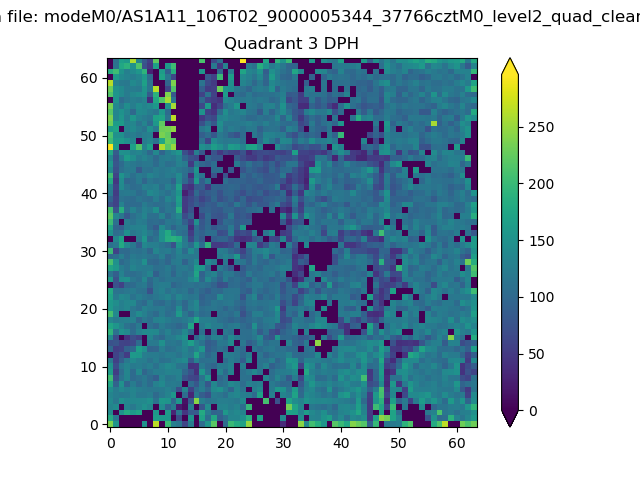 |
 |
Quadrant C |
| Plot type | Count rate plots | Images |
|---|---|---|
| Comparison with Poisson distribution Blue bars denote a histogram of data divided into 1 sec bins. Red curve is a Poisson curve with rate = median count rate of data. |
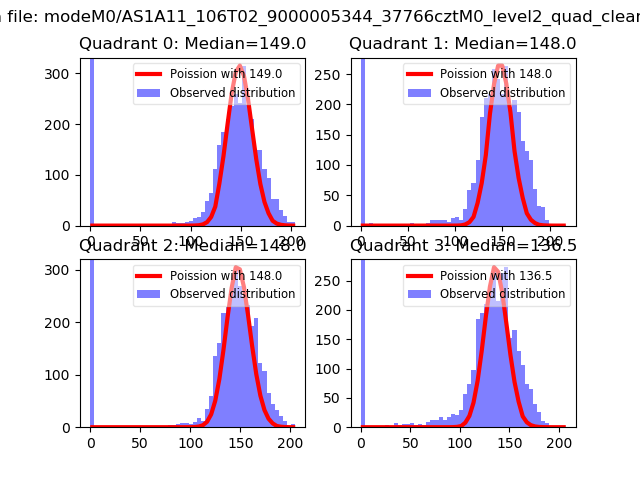 |
 |
| Quadrant-wise count rates Data is divided into 100 sec bins |
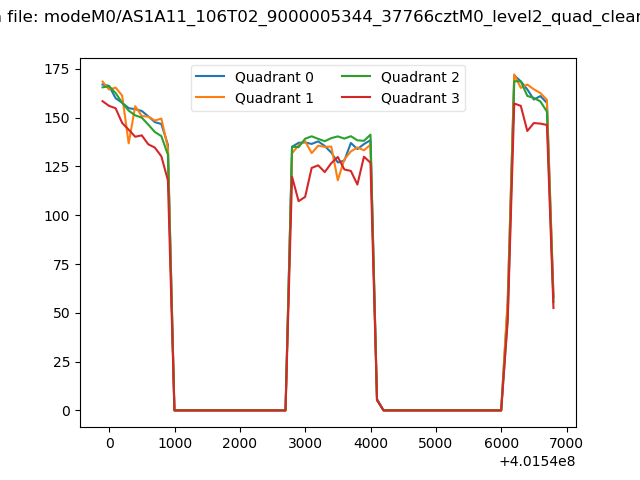 |
|
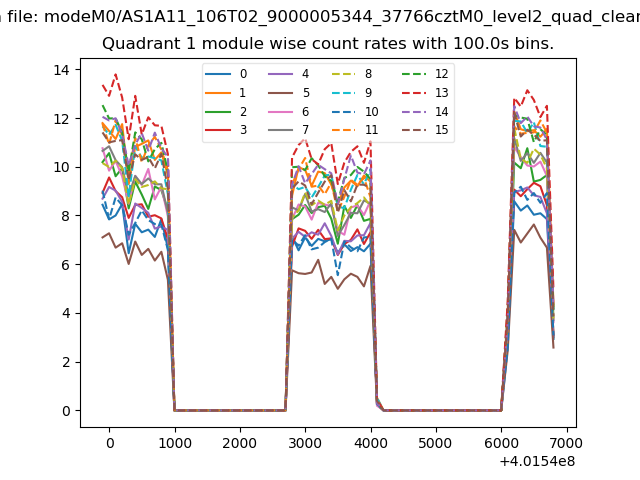
| Module-wise count rates for Quadrant A Data is divided into 100 sec bins |
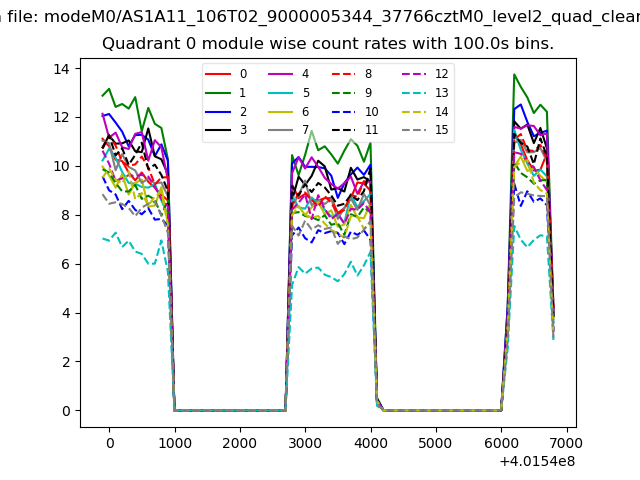 |
 |
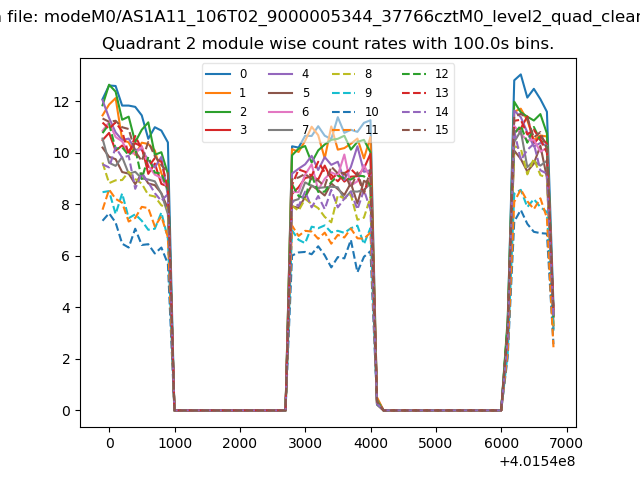
| Module-wise count rates for Quadrant B Data is divided into 100 sec bins |
 |
 |
| Module-wise count rates for Quadrant C Data is divided into 100 sec bins |
 |
 |
| Module-wise count rates for Quadrant D Data is divided into 100 sec bins |
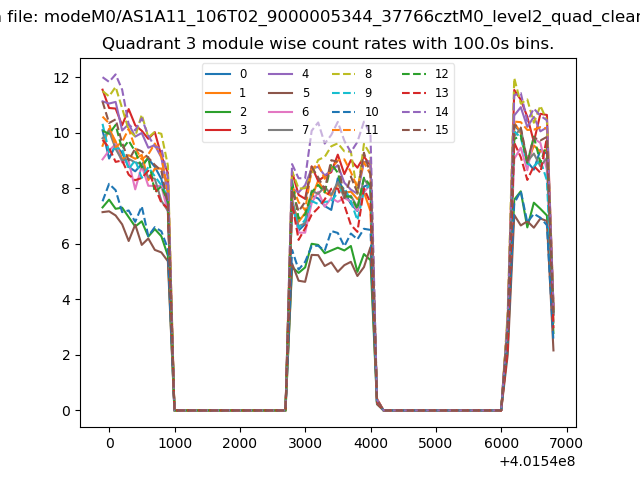 |
 |
| Parameter | Plot |
|---|---|
| CZT HV Monitor |  |
| D_VDD | 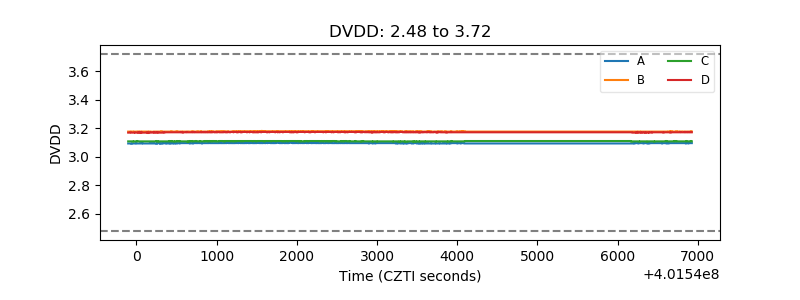 |
| Temperature 1 | 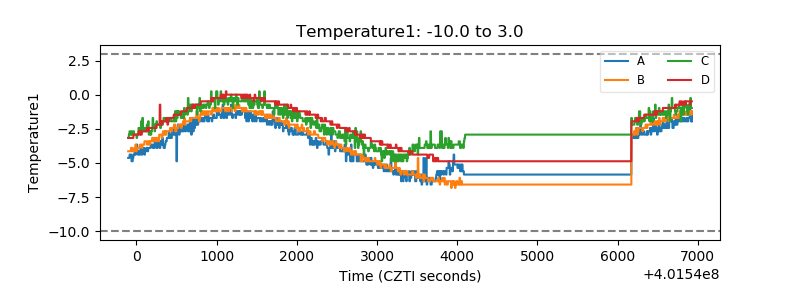 |
| Veto HV Monitor | 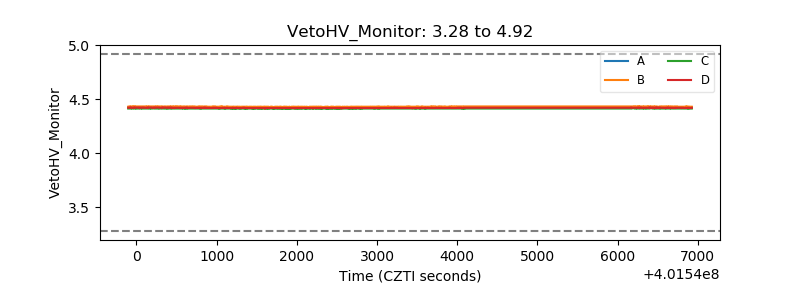 |
| Veto LLD | 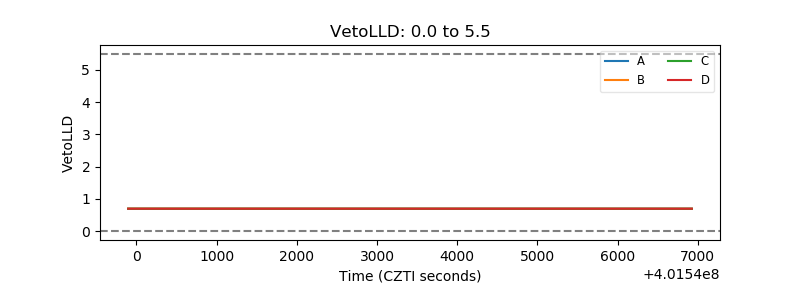 |
| Alpha Counter | 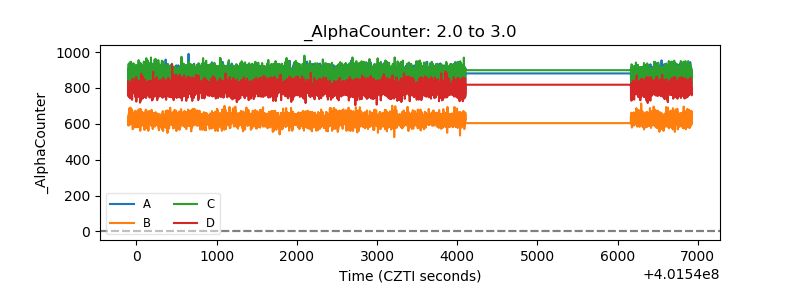 |
| _CPM_Rate | 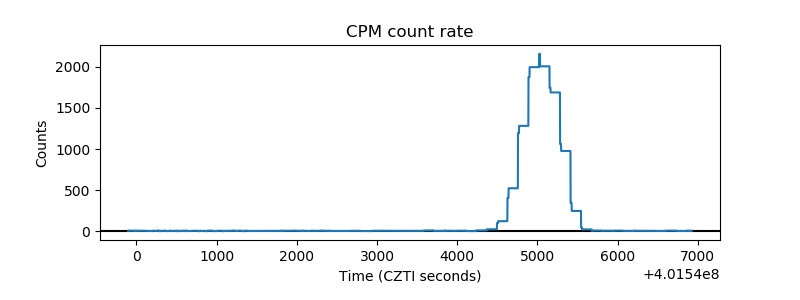 |
| CZT Counter | 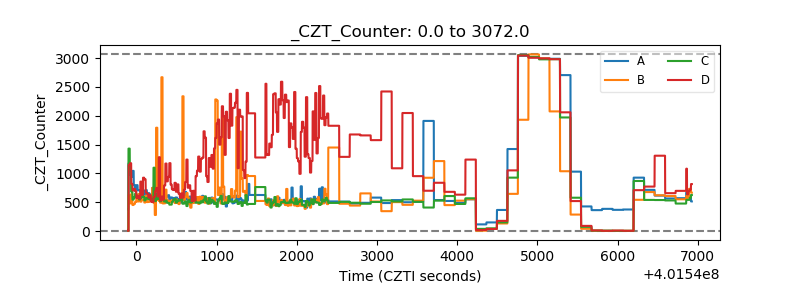 |
| +2.5 Volts monitor | 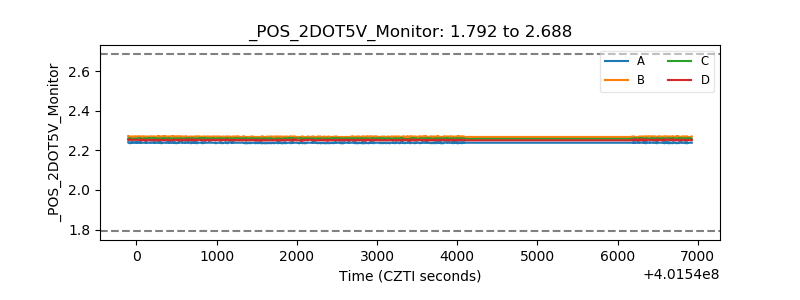 |
| +5 Volts monitor | 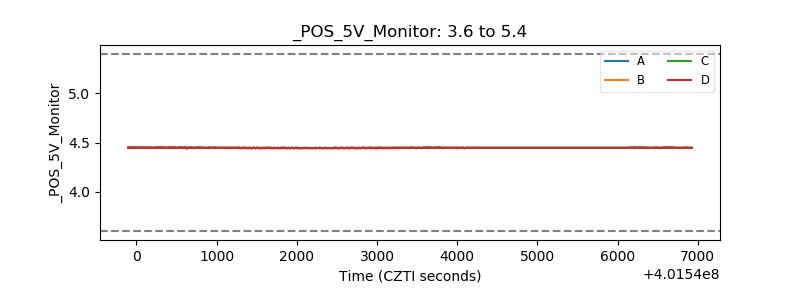 |
| _ROLL_ROT | 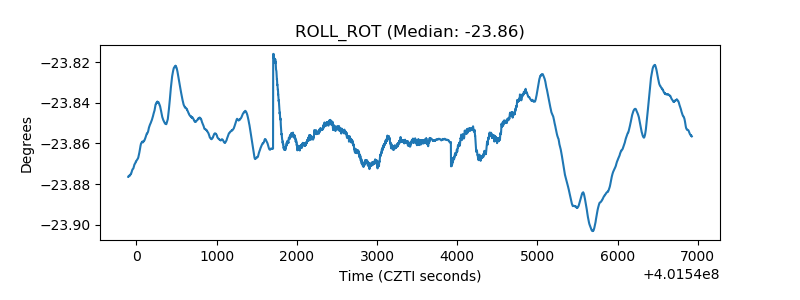 |
| _Roll_DEC | 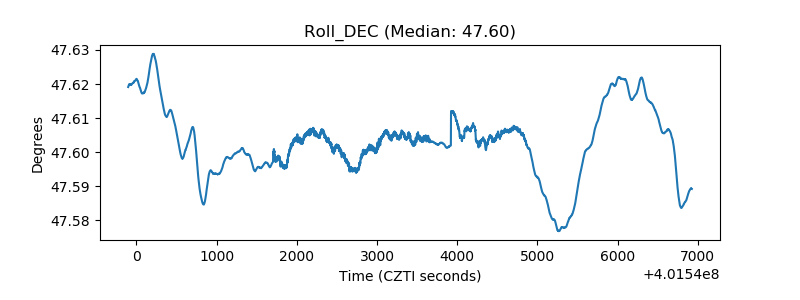 |
| _Roll_RA | 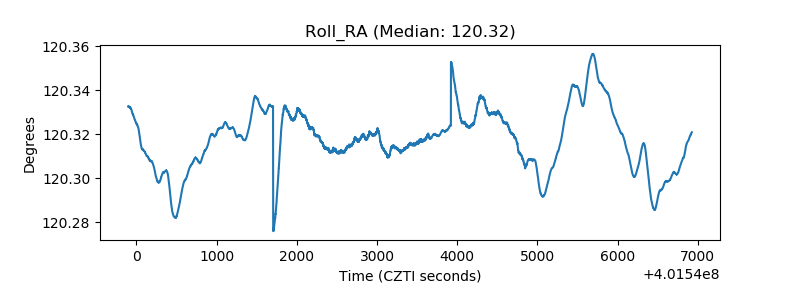 |
| Veto Counter | 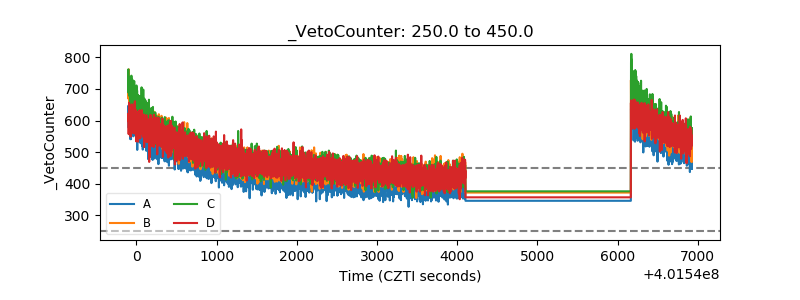 |