| Param | Original file | Final file |
|---|---|---|
| Filename | modeM0/AS1A11_106T02_9000005344_37767cztM0_level2.evt | modeM0/AS1A11_106T02_9000005344_37767cztM0_level2_quad_clean.evt |
| Size (bytes) | 553,029,120 | 60,618,240 |
| Size | 527.4 MB | 57.8 MB |
| Events in quadrant A | 3,094,598 | 378,134 |
| Events in quadrant B | 3,290,504 | 373,212 |
| Events in quadrant C | 2,808,428 | 380,755 |
| Events in quadrant D | 7,201,911 | 336,958 |
| Mode M9 | |||
|---|---|---|---|
| Quadrant | BADHDUFLAG | Total packets | Discarded packets |
| A | 0 | 26 | 0 |
| B | 0 | 26 | 0 |
| C | 0 | 26 | 0 |
| D | 0 | 26 | 0 |
| Mode SS | |||
|---|---|---|---|
| Quadrant | BADHDUFLAG | Total packets | Discarded packets |
| A | 0 | 106 | 0 |
| B | 0 | 106 | 0 |
| C | 0 | 106 | 0 |
| D | 0 | 106 | 0 |
| Mode M0 | |||
|---|---|---|---|
| Quadrant | BADHDUFLAG | Total packets | Discarded packets |
| A | 0 | 12306 | 4 |
| B | 0 | 13132 | 2 |
| C | 0 | 11086 | 2 |
| D | 0 | 25096 | 2 |
| Quadrant | Total seconds | Saturated seconds | Saturation percentage |
|---|---|---|---|
| A | 5229 | 37 | 0.707592% |
| B | 5229 | 111 | 2.122777% |
| C | 5229 | 17 | 0.325110% |
| D | 5229 | 792 | 15.146299% |
Noise dominated data is calculated using 1-second bins in cleaned event files. If a bin has >2000 counts, and if more than 50% of those come from <1% of pixels, then it is considered to be noise-dominated and hence unusable.
| Quadrant | # 1 sec bins | Bins with >0 counts | Bins with >2000 counts | High rate bins dominated by noise | Noise dominated (total time) | Noise dominated (detector-on time) | Marked lightcurve |
|---|---|---|---|---|---|---|---|
| A | 7353 | 5231 | 30 | 30 | 0.41% | 0.57% | 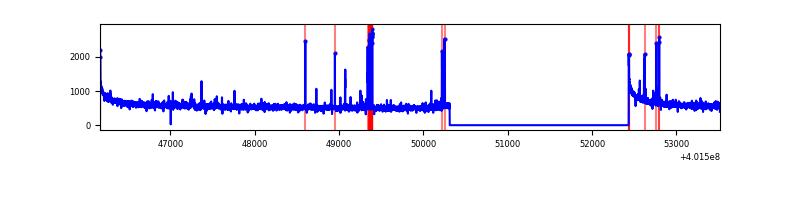 |
| B | 7353 | 5231 | 87 | 87 | 1.18% | 1.66% | 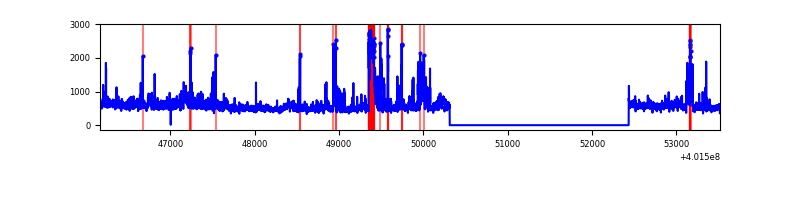 |
| C | 7353 | 5231 | 18 | 18 | 0.24% | 0.34% | 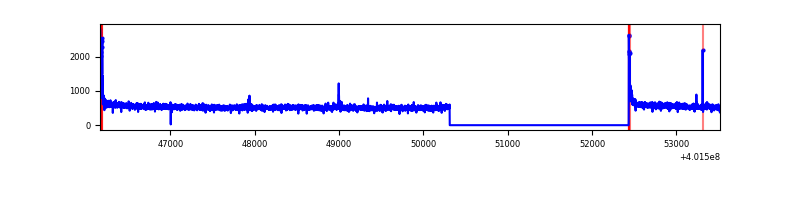 |
| D | 7353 | 5231 | 904 | 904 | 12.29% | 17.28% | 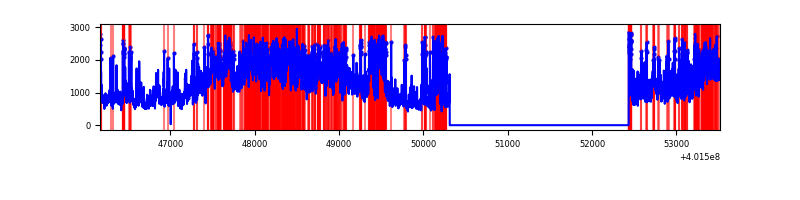 |
Top three noisy pixels from each quadrant. If the there are fewer than three noisy pixels in the level2.evt file, extra rows are filled as -1
| Pixel properties | Quadrant properties | ||||||
|---|---|---|---|---|---|---|---|
| Quadrant | DetID | PixID | Counts | Sigma | Mean | Median | Sigma |
| A | 10 | 83 | 349798 | 2644.78 | 663 | 652 | 132.0 |
| A | 9 | 143 | 117171 | 882.63 | 663 | 652 | 132.0 |
| A | 6 | 10 | 34080 | 253.22 | 663 | 652 | 132.0 |
| B | 4 | 81 | 198091 | 1675.06 | 644 | 630 | 117.9 |
| B | 5 | 255 | 141137 | 1191.92 | 644 | 630 | 117.9 |
| B | 0 | 189 | 102227 | 861.84 | 644 | 630 | 117.9 |
| C | 15 | 214 | 226334 | 1531.92 | 641 | 647 | 147.3 |
| C | 0 | 10 | 68390 | 459.83 | 641 | 647 | 147.3 |
| C | 14 | 254 | 4369 | 25.26 | 641 | 647 | 147.3 |
| D | 12 | 235 | 1496134 | 9957.58 | 621 | 603 | 150.2 |
| D | 7 | 223 | 1194764 | 7950.99 | 621 | 603 | 150.2 |
| D | 2 | 249 | 911961 | 6068.03 | 621 | 603 | 150.2 |
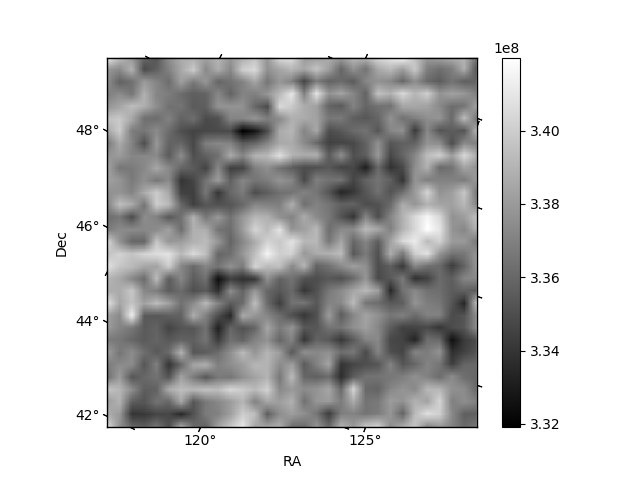
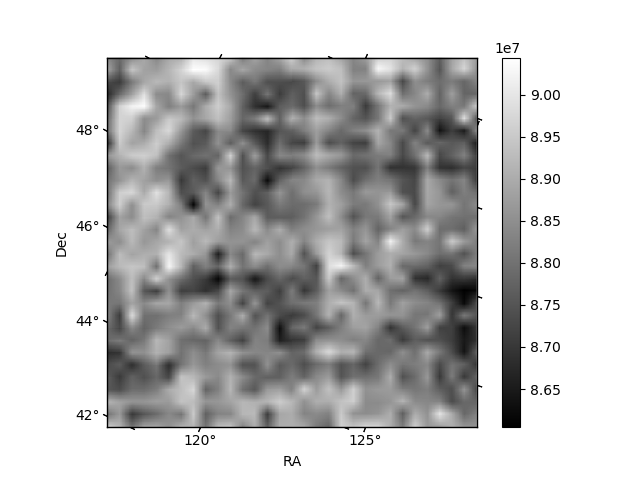
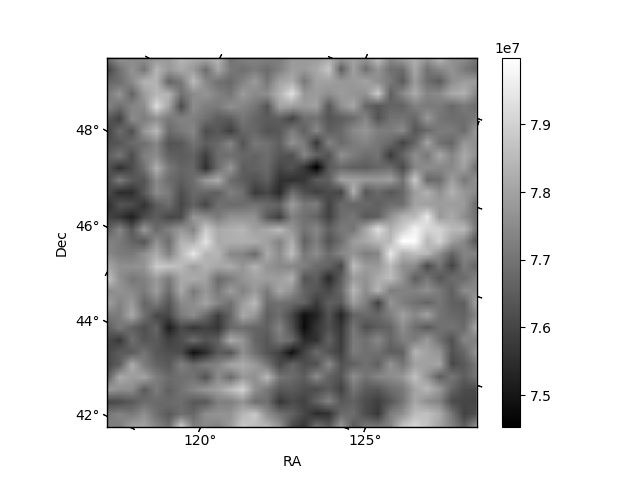
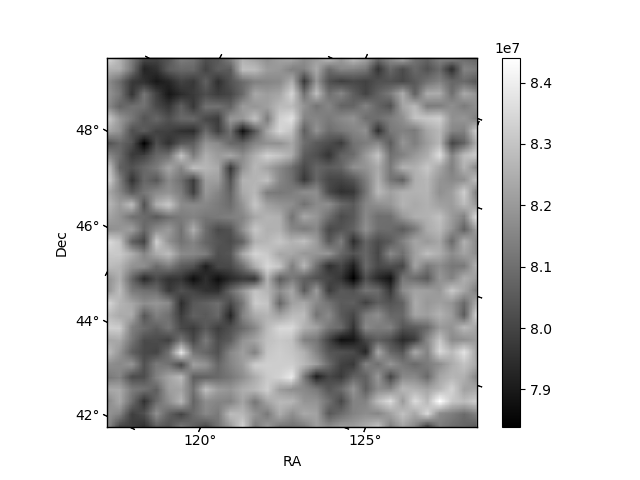
Histogram calculated using DETX and DETY for each event in the final _common_clean file
| Quadrant A | 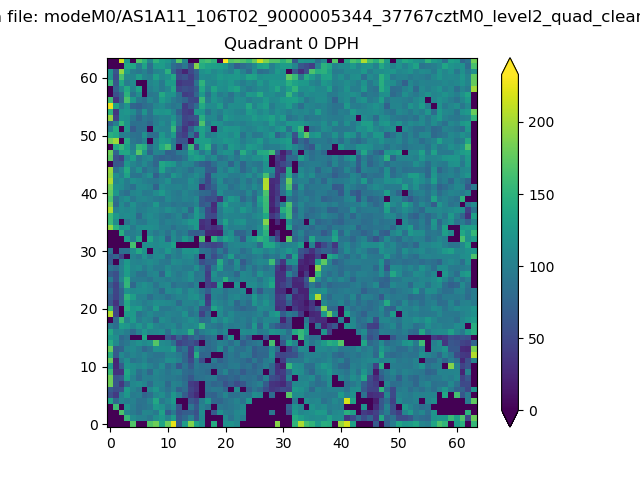 |
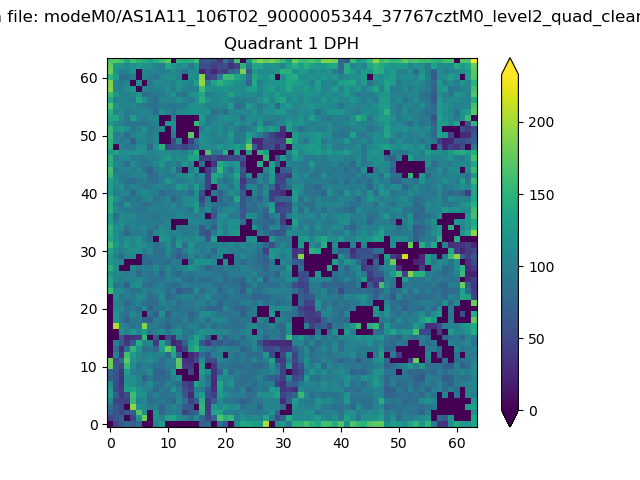 |
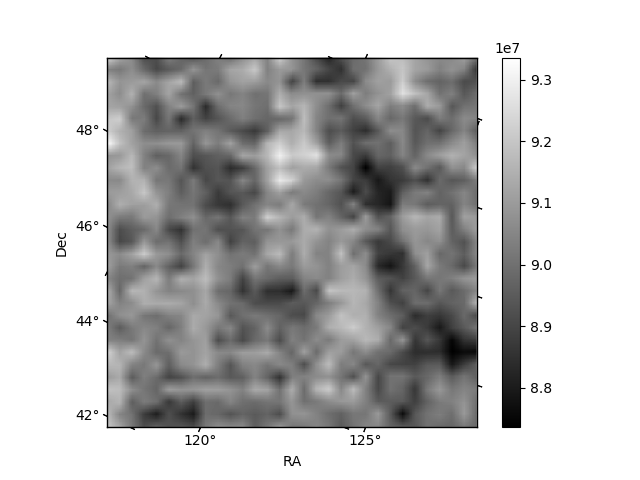
Quadrant B |
|---|---|---|---|
| Quadrant D | 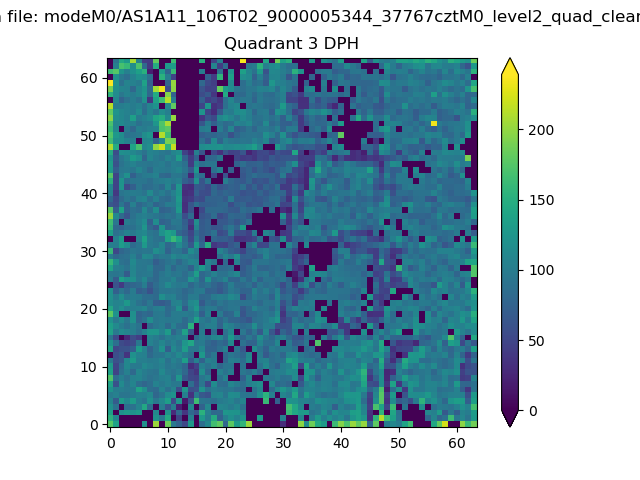 |
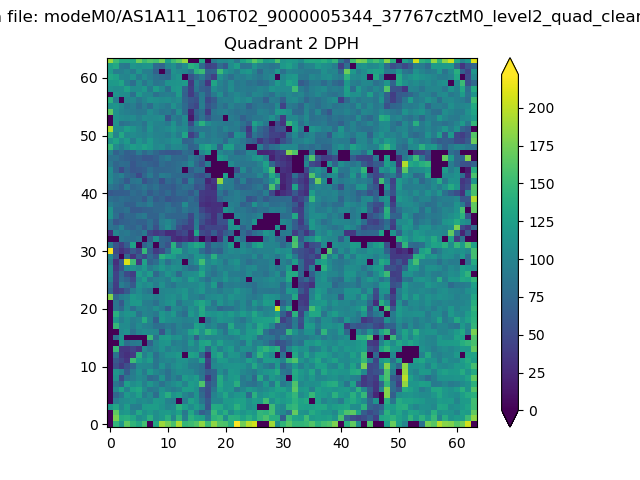 |
Quadrant C |
| Plot type | Count rate plots | Images |
|---|---|---|
| Comparison with Poisson distribution Blue bars denote a histogram of data divided into 1 sec bins. Red curve is a Poisson curve with rate = median count rate of data. |
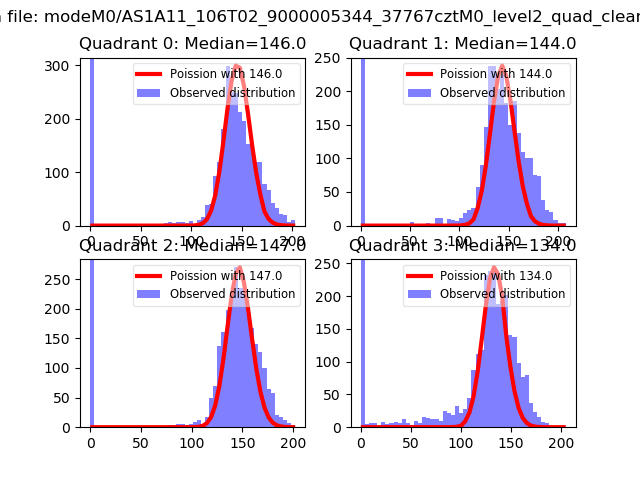 |
 |
| Quadrant-wise count rates Data is divided into 100 sec bins |
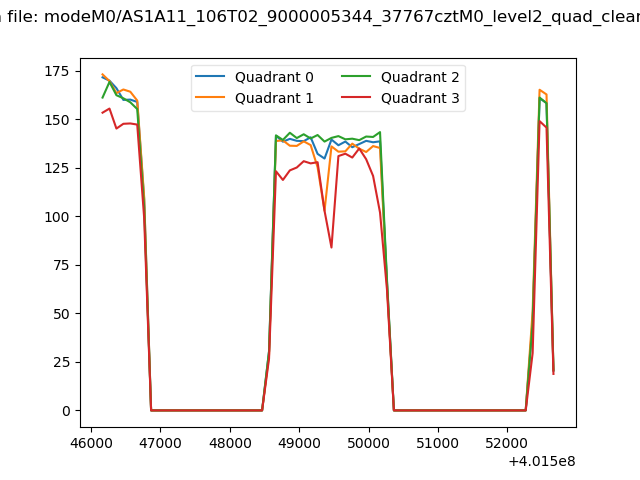 |
|
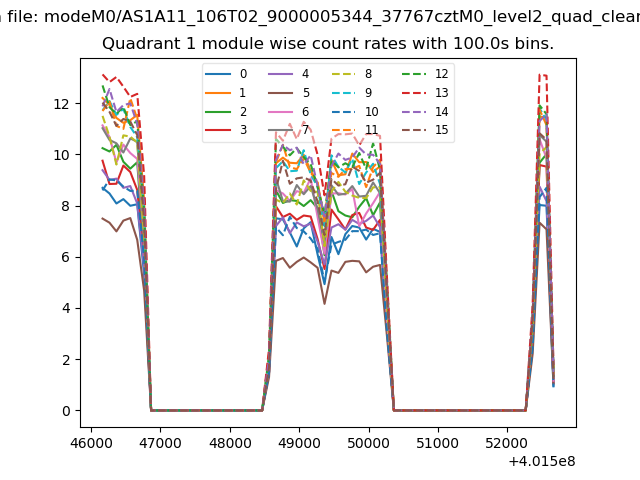
| Module-wise count rates for Quadrant A Data is divided into 100 sec bins |
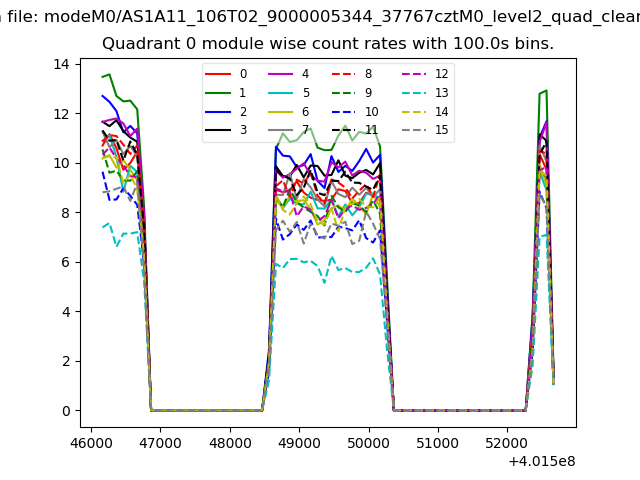 |
 |
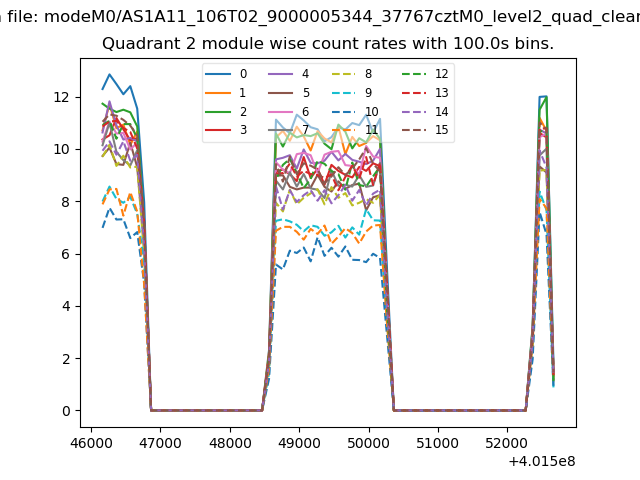
| Module-wise count rates for Quadrant B Data is divided into 100 sec bins |
 |
 |
| Module-wise count rates for Quadrant C Data is divided into 100 sec bins |
 |
 |
| Module-wise count rates for Quadrant D Data is divided into 100 sec bins |
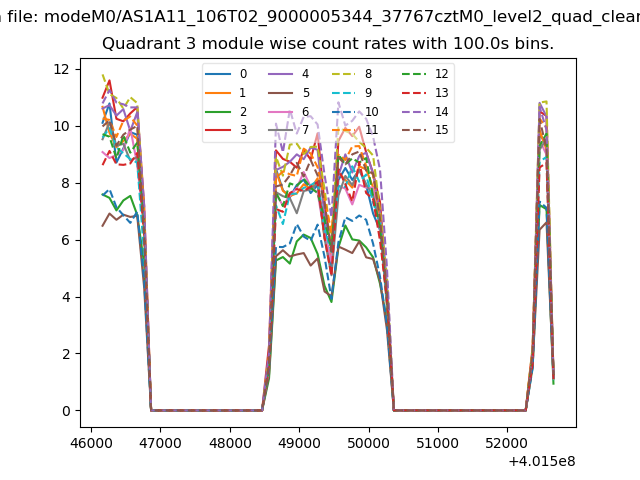 |
 |
| Parameter | Plot |
|---|---|
| CZT HV Monitor | 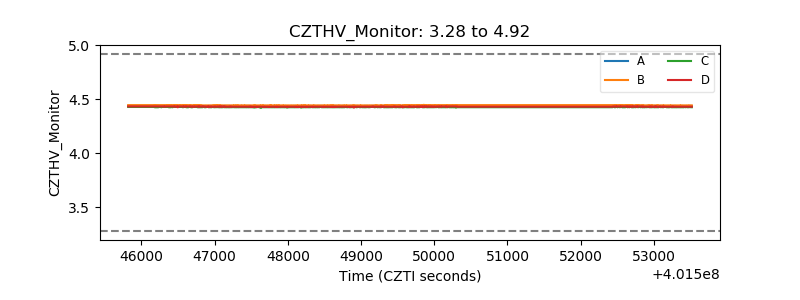 |
| D_VDD | 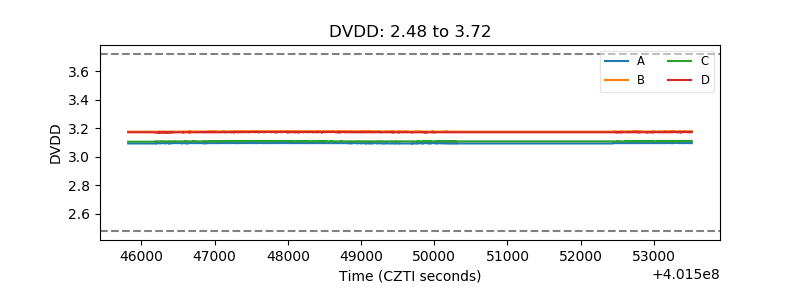 |
| Temperature 1 | 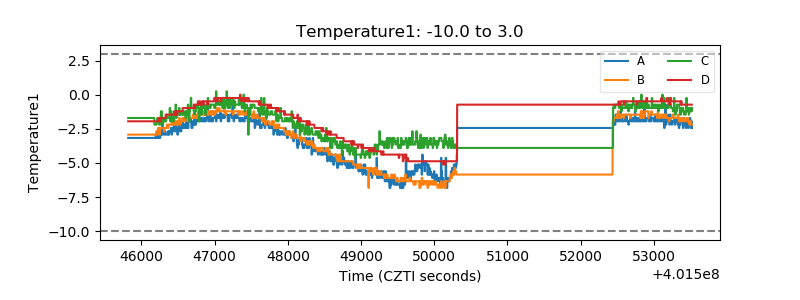 |
| Veto HV Monitor | 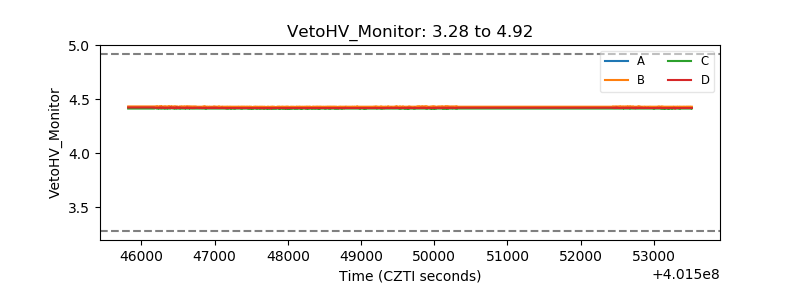 |
| Veto LLD | 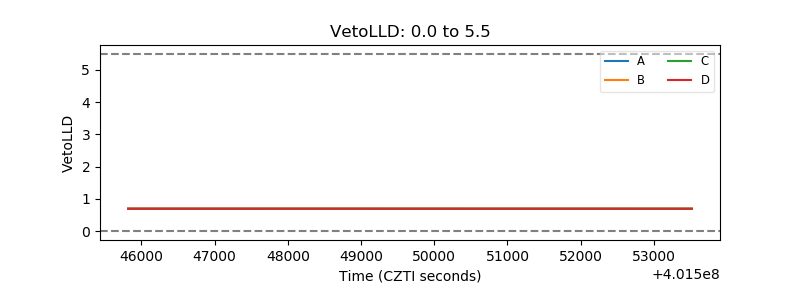 |
| Alpha Counter | 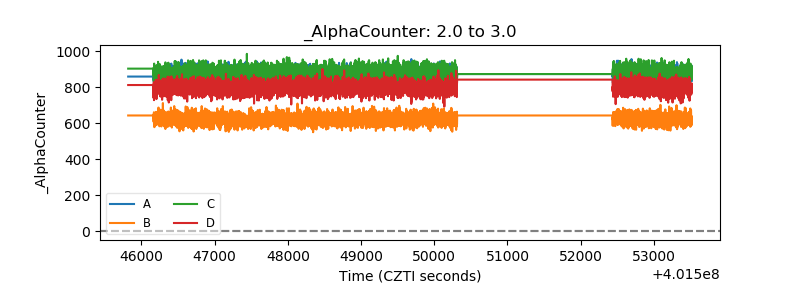 |
| _CPM_Rate | 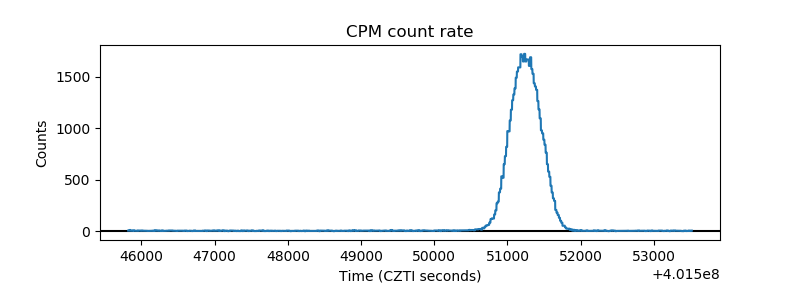 |
| CZT Counter | 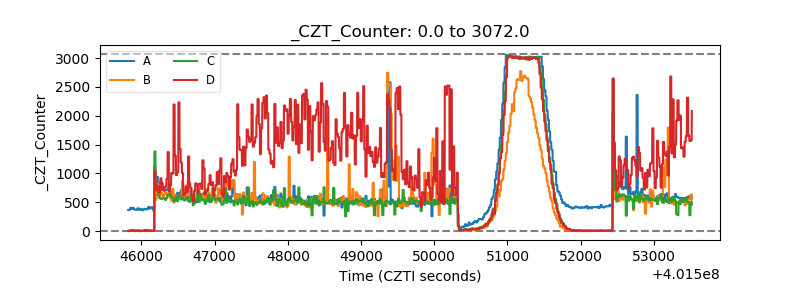 |
| +2.5 Volts monitor | 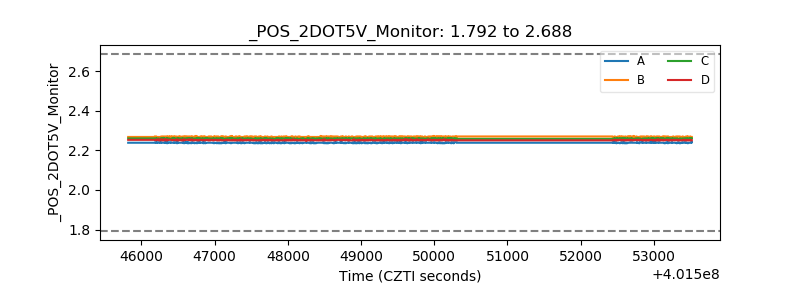 |
| +5 Volts monitor | 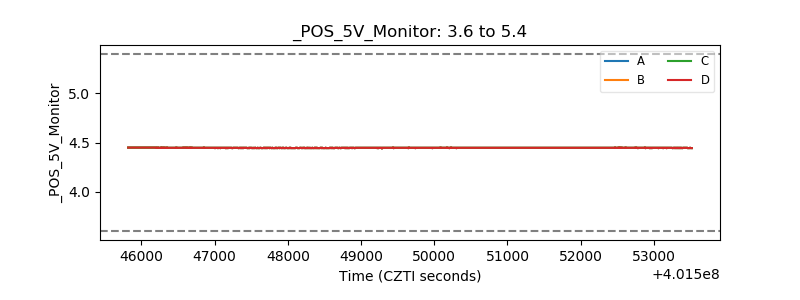 |
| _ROLL_ROT | 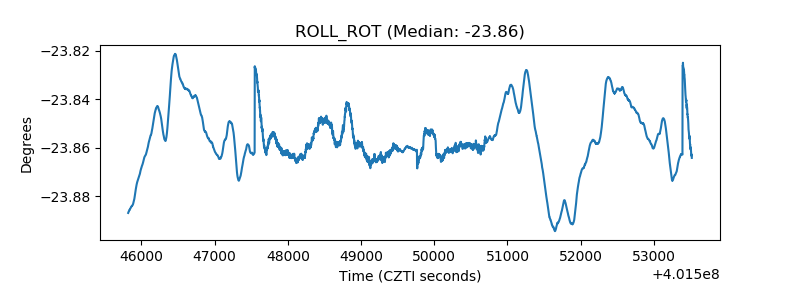 |
| _Roll_DEC | 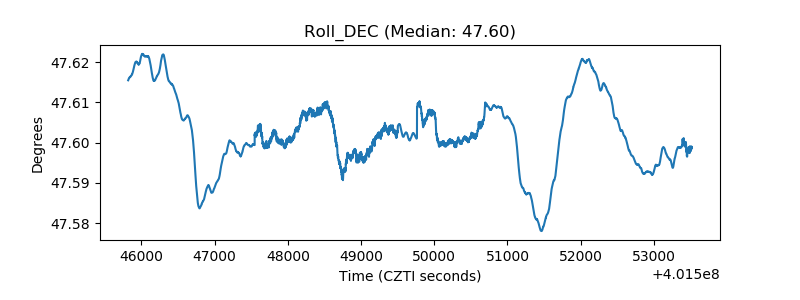 |
| _Roll_RA | 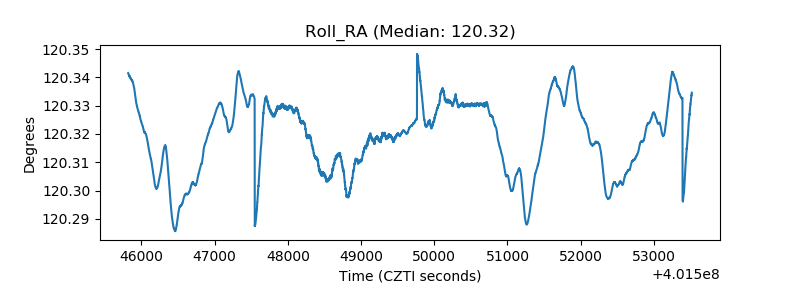 |
| Veto Counter | 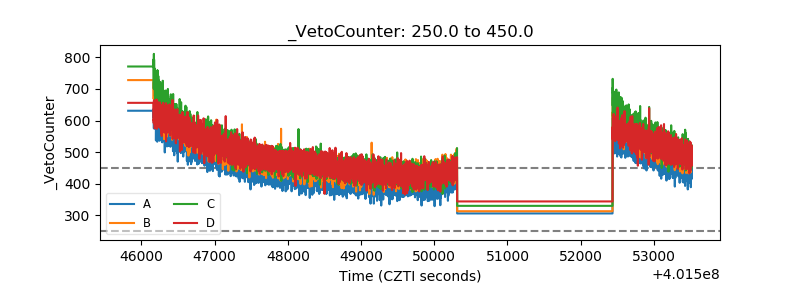 |