| Param | Original file | Final file |
|---|---|---|
| Filename | modeM0/AS1A11_106T02_9000005344_37768cztM0_level2.evt | modeM0/AS1A11_106T02_9000005344_37768cztM0_level2_quad_clean.evt |
| Size (bytes) | 541,019,520 | 50,552,640 |
| Size | 516.0 MB | 48.2 MB |
| Events in quadrant A | 2,946,799 | 298,514 |
| Events in quadrant B | 3,001,766 | 290,871 |
| Events in quadrant C | 2,678,940 | 307,574 |
| Events in quadrant D | 7,414,130 | 277,663 |
| Mode M9 | |||
|---|---|---|---|
| Quadrant | BADHDUFLAG | Total packets | Discarded packets |
| A | 0 | 21 | 0 |
| B | 0 | 21 | 0 |
| C | 0 | 21 | 0 |
| D | 0 | 21 | 0 |
| Mode SS | |||
|---|---|---|---|
| Quadrant | BADHDUFLAG | Total packets | Discarded packets |
| A | 0 | 104 | 0 |
| B | 0 | 104 | 0 |
| C | 0 | 104 | 0 |
| D | 0 | 104 | 0 |
| Mode M0 | |||
|---|---|---|---|
| Quadrant | BADHDUFLAG | Total packets | Discarded packets |
| A | 0 | 11780 | 2 |
| B | 0 | 11988 | 1 |
| C | 0 | 10701 | 1 |
| D | 0 | 25583 | 1 |
| Quadrant | Total seconds | Saturated seconds | Saturation percentage |
|---|---|---|---|
| A | 5071 | 53 | 1.045159% |
| B | 5071 | 151 | 2.977716% |
| C | 5071 | 20 | 0.394400% |
| D | 5071 | 931 | 18.359298% |
Noise dominated data is calculated using 1-second bins in cleaned event files. If a bin has >2000 counts, and if more than 50% of those come from <1% of pixels, then it is considered to be noise-dominated and hence unusable.
| Quadrant | # 1 sec bins | Bins with >0 counts | Bins with >2000 counts | High rate bins dominated by noise | Noise dominated (total time) | Noise dominated (detector-on time) | Marked lightcurve |
|---|---|---|---|---|---|---|---|
| A | 7223 | 5072 | 46 | 46 | 0.64% | 0.91% | 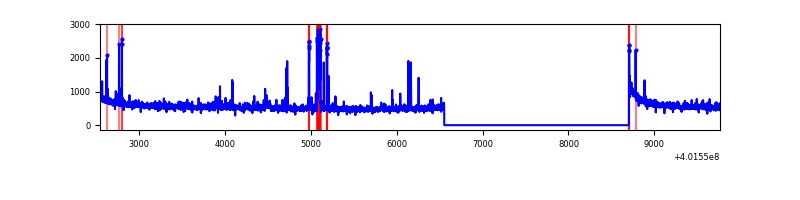 |
| B | 7223 | 5072 | 130 | 130 | 1.80% | 2.56% | 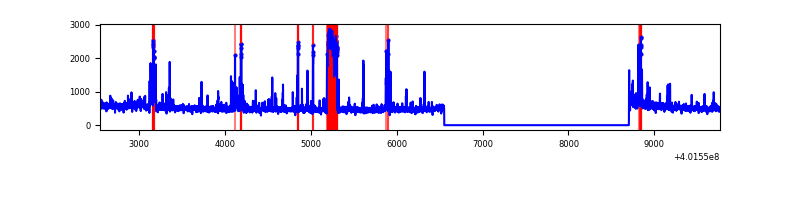 |
| C | 7223 | 5072 | 19 | 19 | 0.26% | 0.37% | 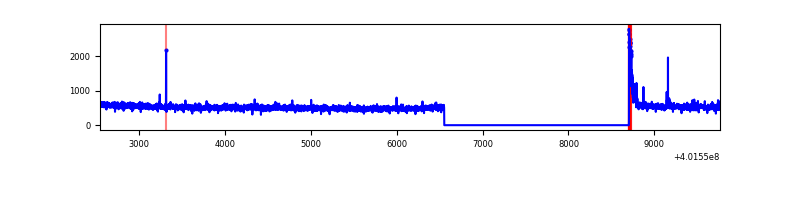 |
| D | 7223 | 5072 | 1036 | 1036 | 14.34% | 20.43% | 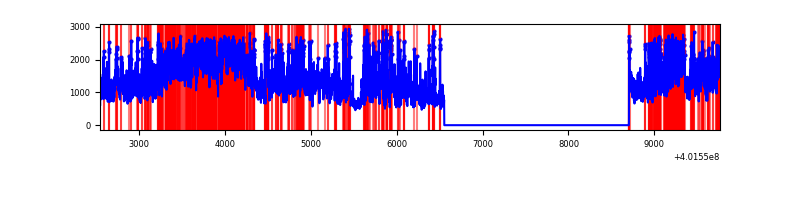 |
Top three noisy pixels from each quadrant. If the there are fewer than three noisy pixels in the level2.evt file, extra rows are filled as -1
| Pixel properties | Quadrant properties | ||||||
|---|---|---|---|---|---|---|---|
| Quadrant | DetID | PixID | Counts | Sigma | Mean | Median | Sigma |
| A | 10 | 83 | 307473 | 2473.99 | 618 | 607 | 124.0 |
| A | 9 | 143 | 178420 | 1433.55 | 618 | 607 | 124.0 |
| A | 6 | 10 | 46626 | 371.01 | 618 | 607 | 124.0 |
| B | 4 | 81 | 261532 | 2323.95 | 604 | 592 | 112.3 |
| B | 5 | 255 | 97706 | 864.9 | 604 | 592 | 112.3 |
| B | 5 | 172 | 75941 | 671.06 | 604 | 592 | 112.3 |
| C | 15 | 214 | 217574 | 1559.77 | 606 | 611 | 139.1 |
| C | 0 | 10 | 74614 | 532.01 | 606 | 611 | 139.1 |
| C | 3 | 233 | 8685 | 58.04 | 606 | 611 | 139.1 |
| D | 12 | 235 | 2941646 | 20869.31 | 578 | 564 | 140.9 |
| D | 2 | 249 | 781154 | 5538.9 | 578 | 564 | 140.9 |
| D | 5 | 222 | 620825 | 4401.24 | 578 | 564 | 140.9 |
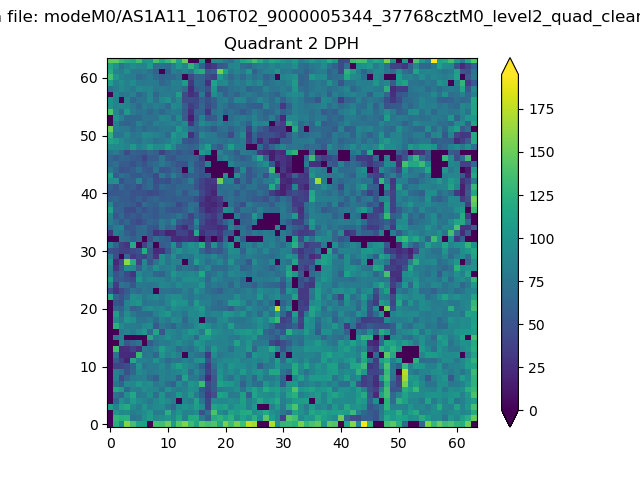
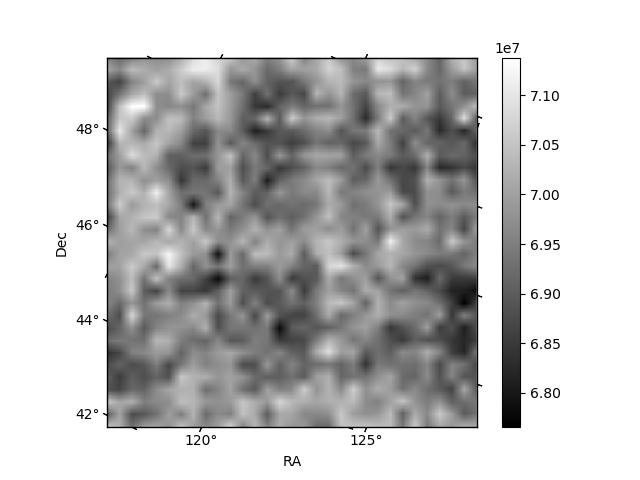
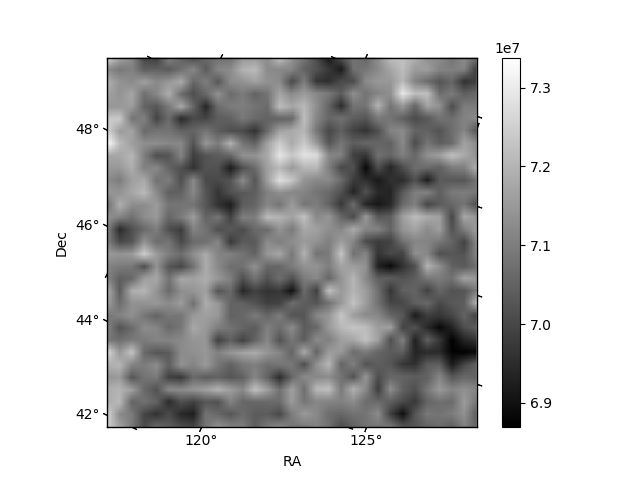
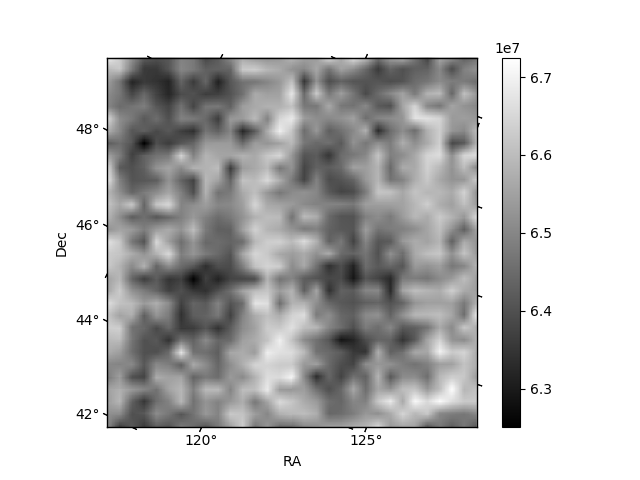
Histogram calculated using DETX and DETY for each event in the final _common_clean file
| Quadrant A | 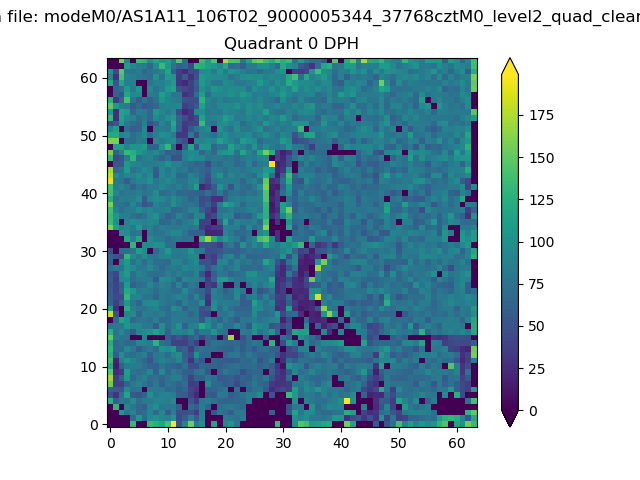 |
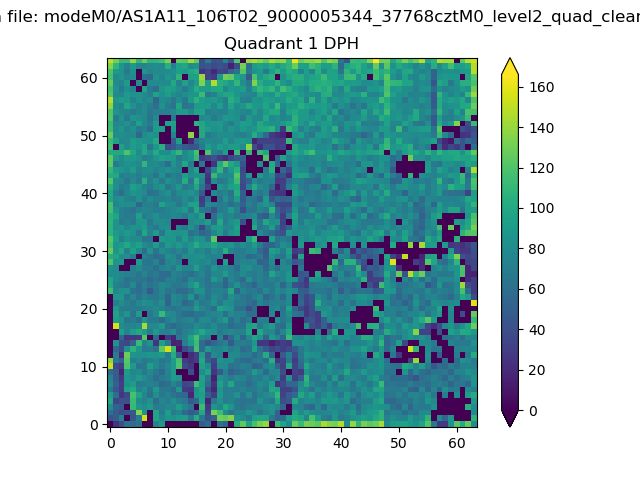 |
Quadrant B |
|---|---|---|---|
| Quadrant D | 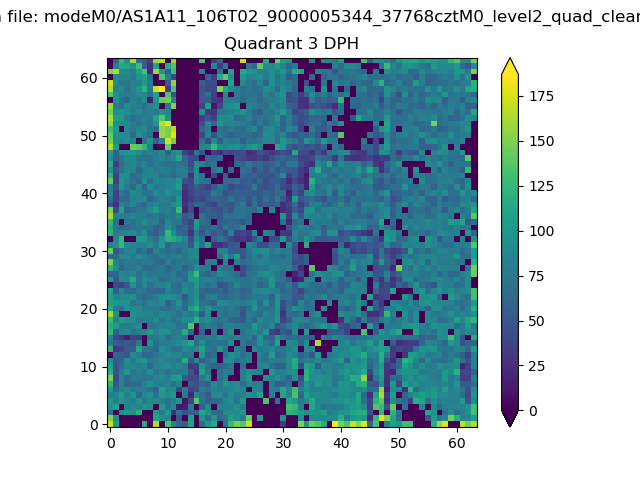 |
 |
Quadrant C |
| Plot type | Count rate plots | Images |
|---|---|---|
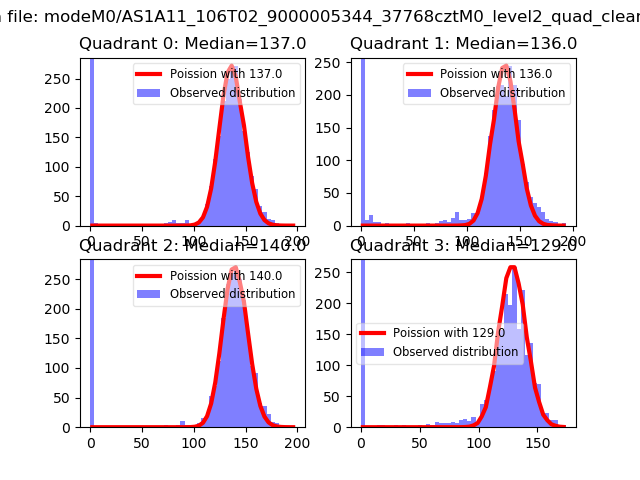
| Comparison with Poisson distribution Blue bars denote a histogram of data divided into 1 sec bins. Red curve is a Poisson curve with rate = median count rate of data. |
 |
 |
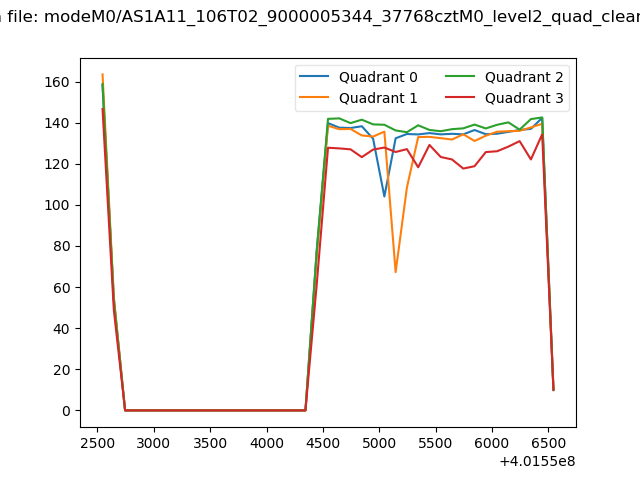
| Quadrant-wise count rates Data is divided into 100 sec bins |
 |
|
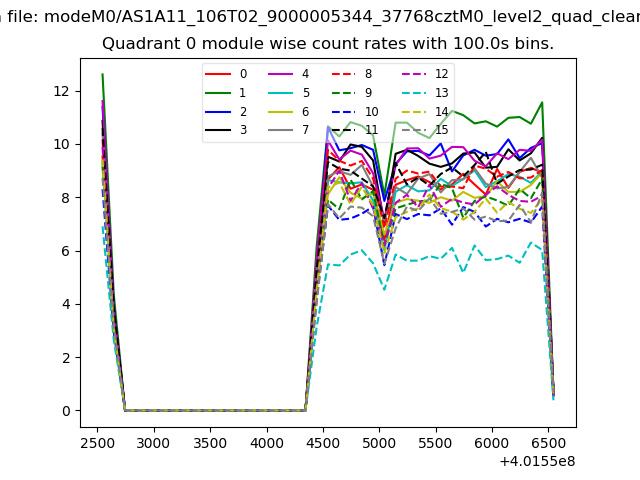
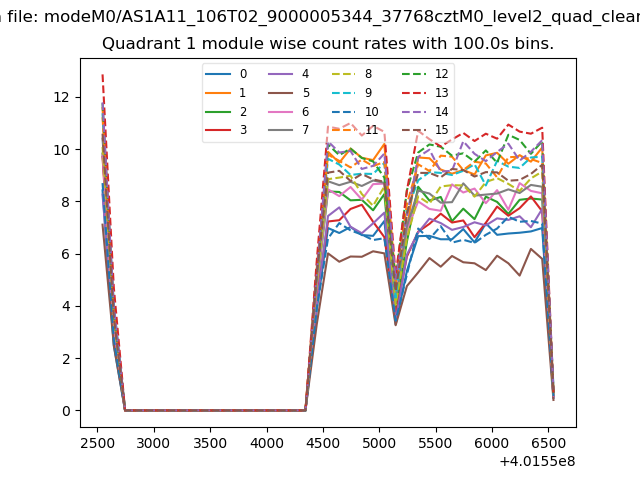
| Module-wise count rates for Quadrant A Data is divided into 100 sec bins |
 |
 |
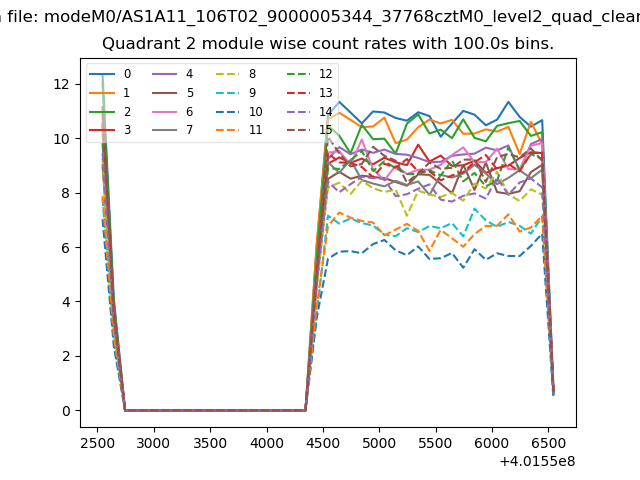
| Module-wise count rates for Quadrant B Data is divided into 100 sec bins |
 |
 |
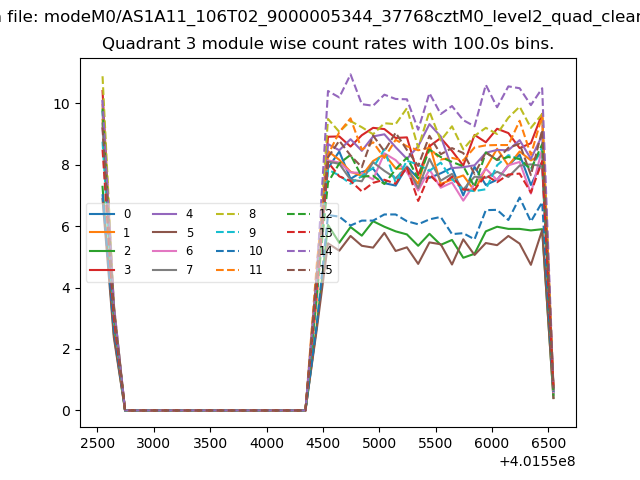
| Module-wise count rates for Quadrant C Data is divided into 100 sec bins |
 |
 |
| Module-wise count rates for Quadrant D Data is divided into 100 sec bins |
 |
 |
| Parameter | Plot |
|---|---|
| CZT HV Monitor | 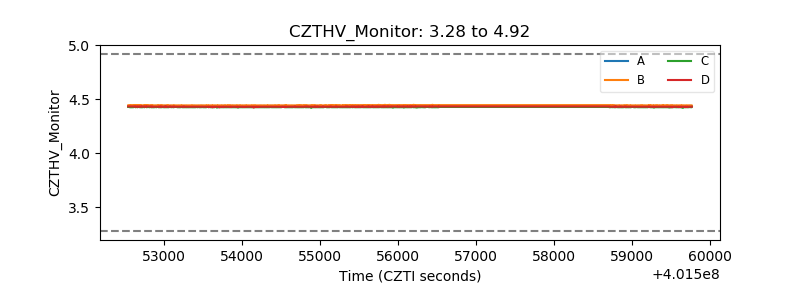 |
| D_VDD | 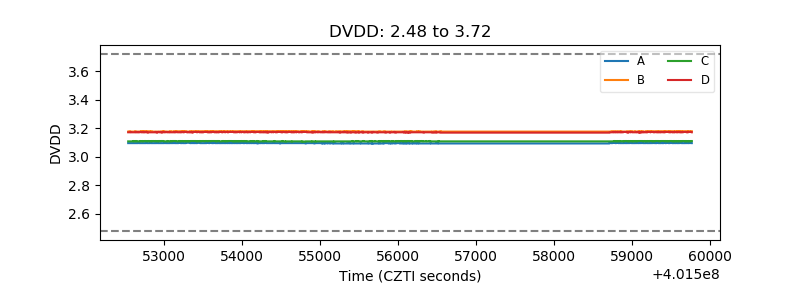 |
| Temperature 1 | 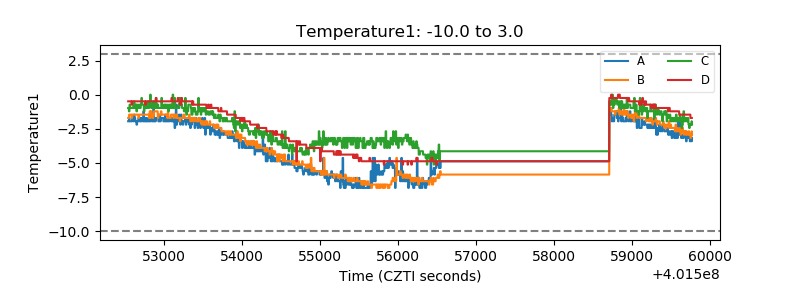 |
| Veto HV Monitor | 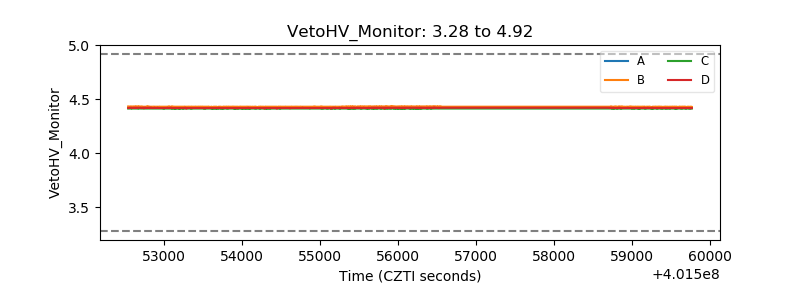 |
| Veto LLD | 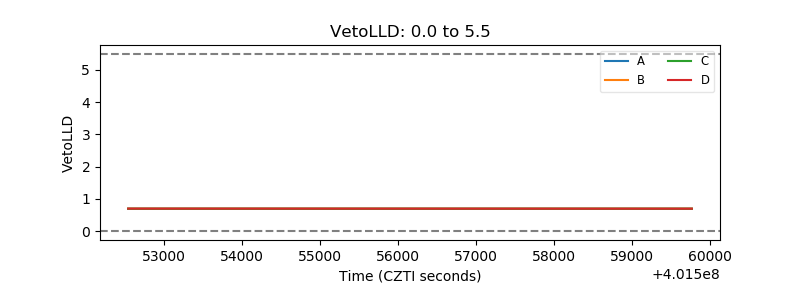 |
| Alpha Counter | 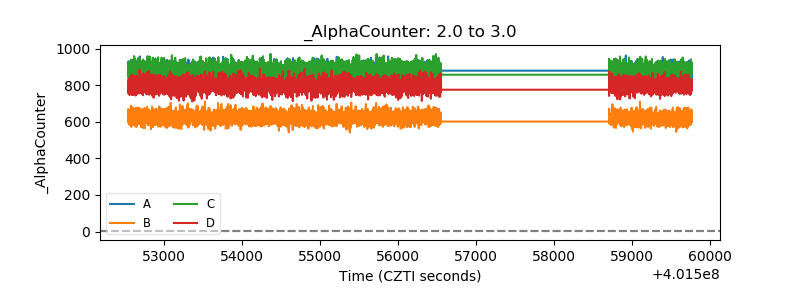 |
| _CPM_Rate | 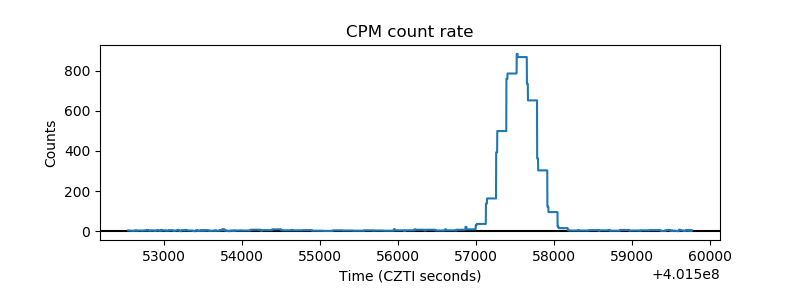 |
| CZT Counter | 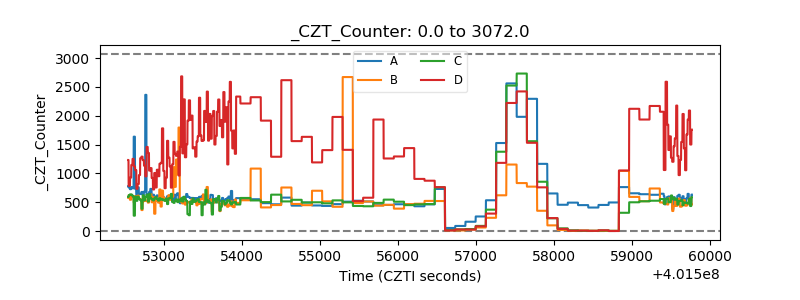 |
| +2.5 Volts monitor | 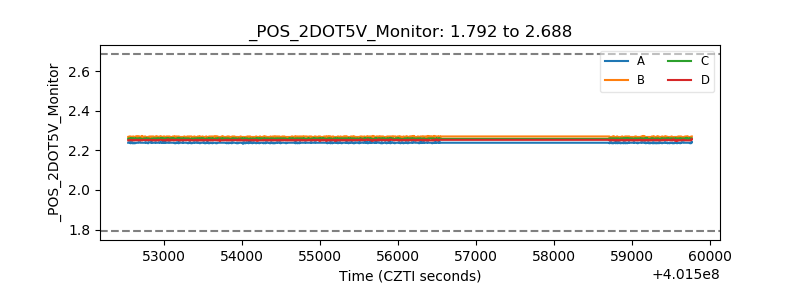 |
| +5 Volts monitor | 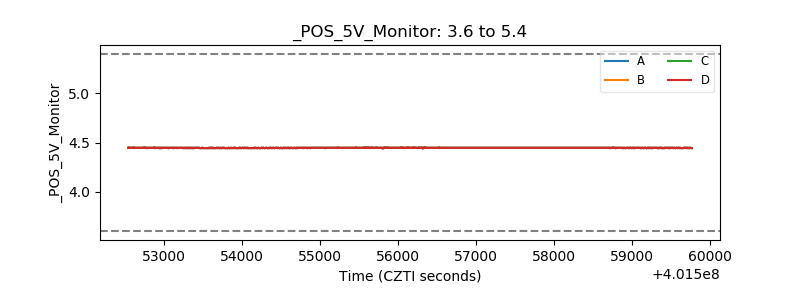 |
| _ROLL_ROT | 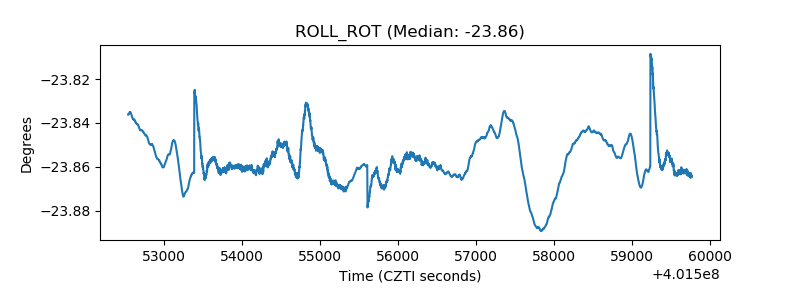 |
| _Roll_DEC | 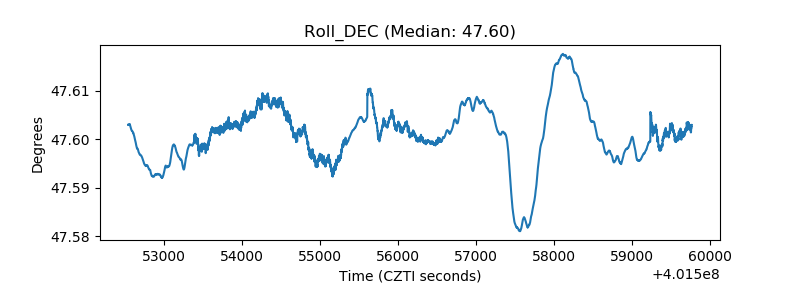 |
| _Roll_RA | 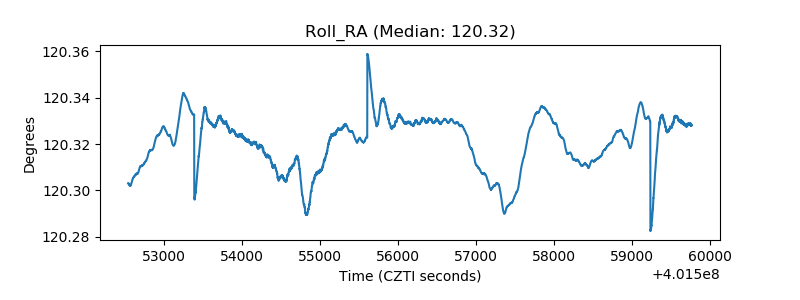 |
| Veto Counter | 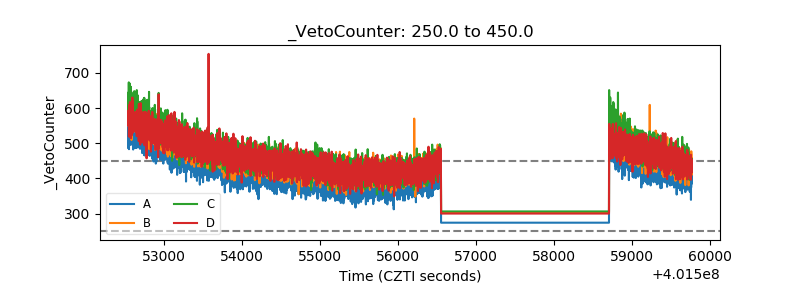 |