| Param | Original file | Final file |
|---|---|---|
| Filename | modeM0/AS1A11_106T02_9000005344_37769cztM0_level2.evt | modeM0/AS1A11_106T02_9000005344_37769cztM0_level2_quad_clean.evt |
| Size (bytes) | 485,804,160 | 55,722,240 |
| Size | 463.3 MB | 53.1 MB |
| Events in quadrant A | 2,816,138 | 335,617 |
| Events in quadrant B | 3,167,257 | 328,406 |
| Events in quadrant C | 2,691,765 | 344,838 |
| Events in quadrant D | 5,688,886 | 317,685 |
| Mode M9 | |||
|---|---|---|---|
| Quadrant | BADHDUFLAG | Total packets | Discarded packets |
| A | 0 | 22 | 0 |
| B | 0 | 22 | 0 |
| C | 0 | 22 | 0 |
| D | 0 | 23 | 0 |
| Mode SS | |||
|---|---|---|---|
| Quadrant | BADHDUFLAG | Total packets | Discarded packets |
| A | 0 | 104 | 0 |
| B | 0 | 104 | 0 |
| C | 0 | 104 | 0 |
| D | 0 | 104 | 0 |
| Mode M0 | |||
|---|---|---|---|
| Quadrant | BADHDUFLAG | Total packets | Discarded packets |
| A | 0 | 11498 | 3 |
| B | 0 | 12710 | 2 |
| C | 0 | 10977 | 2 |
| D | 0 | 20468 | 2 |
| Quadrant | Total seconds | Saturated seconds | Saturation percentage |
|---|---|---|---|
| A | 5144 | 22 | 0.427683% |
| B | 5144 | 251 | 4.879471% |
| C | 5144 | 44 | 0.855365% |
| D | 5144 | 605 | 11.761275% |
Noise dominated data is calculated using 1-second bins in cleaned event files. If a bin has >2000 counts, and if more than 50% of those come from <1% of pixels, then it is considered to be noise-dominated and hence unusable.
| Quadrant | # 1 sec bins | Bins with >0 counts | Bins with >2000 counts | High rate bins dominated by noise | Noise dominated (total time) | Noise dominated (detector-on time) | Marked lightcurve |
|---|---|---|---|---|---|---|---|
| A | 7178 | 5145 | 21 | 21 | 0.29% | 0.41% |  |
| B | 7178 | 5145 | 225 | 225 | 3.13% | 4.37% | 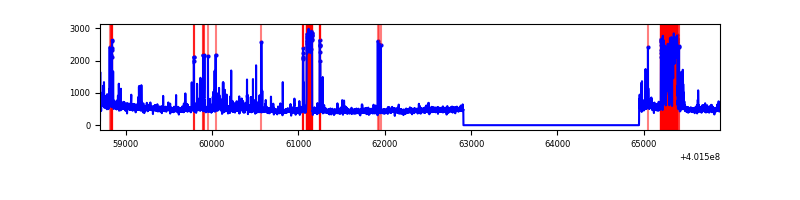 |
| C | 7178 | 5145 | 35 | 35 | 0.49% | 0.68% | 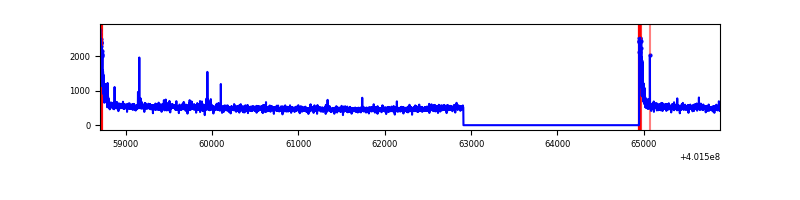 |
| D | 7178 | 5145 | 600 | 600 | 8.36% | 11.66% | 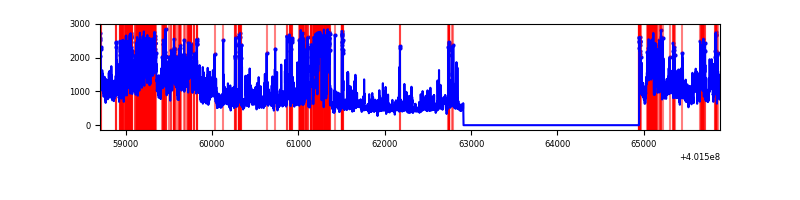 |
Top three noisy pixels from each quadrant. If the there are fewer than three noisy pixels in the level2.evt file, extra rows are filled as -1
| Pixel properties | Quadrant properties | ||||||
|---|---|---|---|---|---|---|---|
| Quadrant | DetID | PixID | Counts | Sigma | Mean | Median | Sigma |
| A | 10 | 83 | 349242 | 2877.71 | 601 | 588 | 121.2 |
| A | 9 | 143 | 87752 | 719.43 | 601 | 588 | 121.2 |
| A | 6 | 10 | 35055 | 284.48 | 601 | 588 | 121.2 |
| B | 5 | 255 | 444665 | 4079.17 | 580 | 566 | 108.9 |
| B | 4 | 81 | 221361 | 2028.06 | 580 | 566 | 108.9 |
| B | 0 | 230 | 62655 | 570.3 | 580 | 566 | 108.9 |
| C | 15 | 214 | 220657 | 1617.49 | 589 | 594 | 136.1 |
| C | 0 | 10 | 141203 | 1033.49 | 589 | 594 | 136.1 |
| C | 15 | 159 | 17322 | 122.95 | 589 | 594 | 136.1 |
| D | 12 | 235 | 1824914 | 13088.72 | 568 | 552 | 139.4 |
| D | 2 | 249 | 1158754 | 8309.41 | 568 | 552 | 139.4 |
| D | 2 | 250 | 102325 | 730.16 | 568 | 552 | 139.4 |
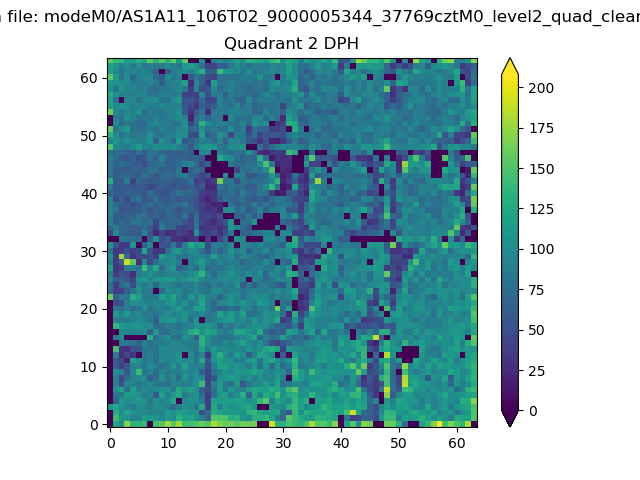
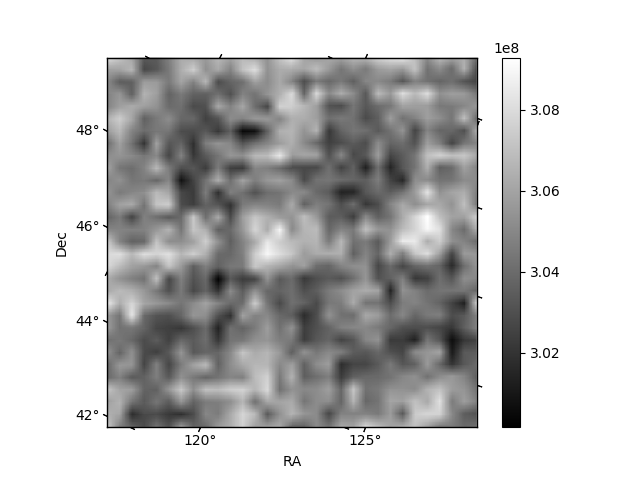
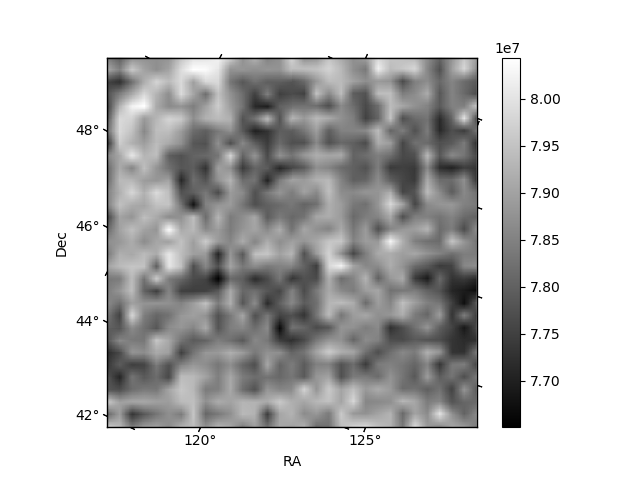
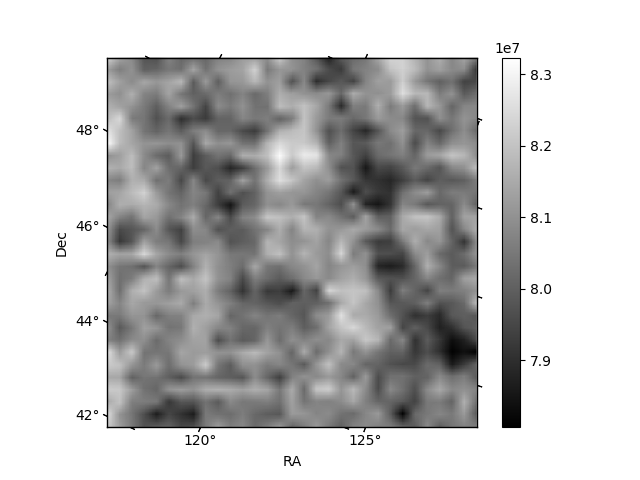
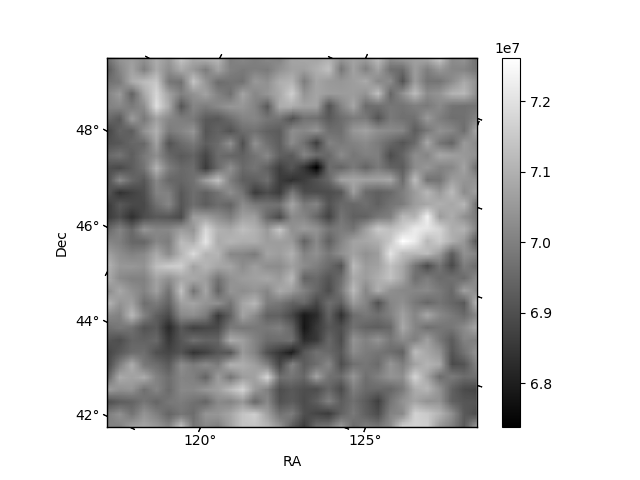
Histogram calculated using DETX and DETY for each event in the final _common_clean file
| Quadrant A | 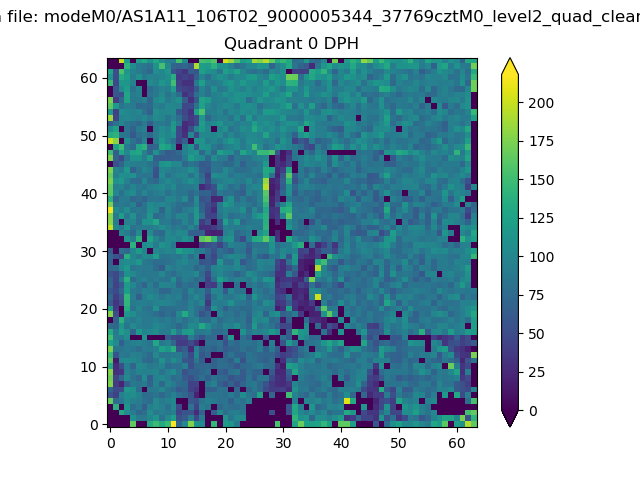 |
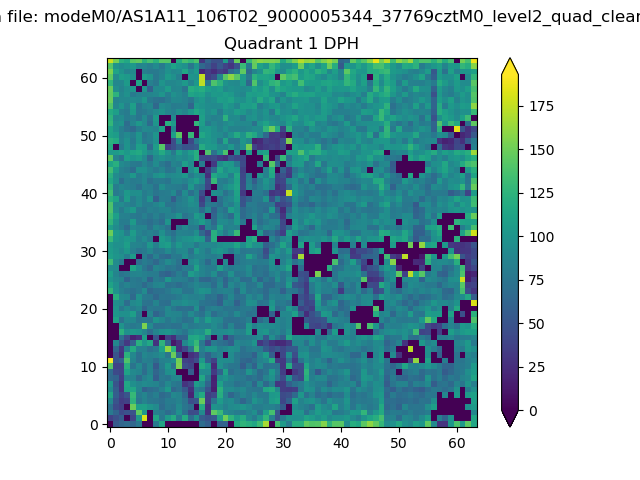 |
Quadrant B |
|---|---|---|---|
| Quadrant D | 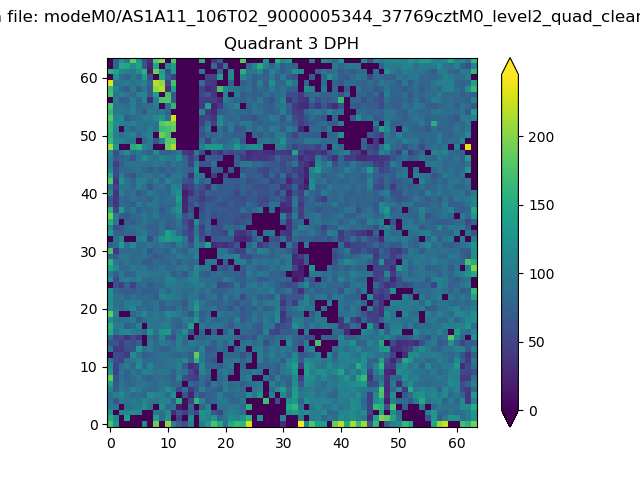 |
 |
Quadrant C |
| Plot type | Count rate plots | Images |
|---|---|---|
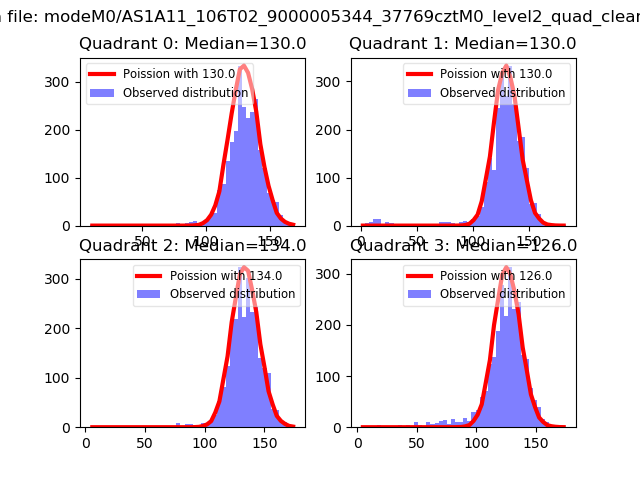
| Comparison with Poisson distribution Blue bars denote a histogram of data divided into 1 sec bins. Red curve is a Poisson curve with rate = median count rate of data. |
 |
 |
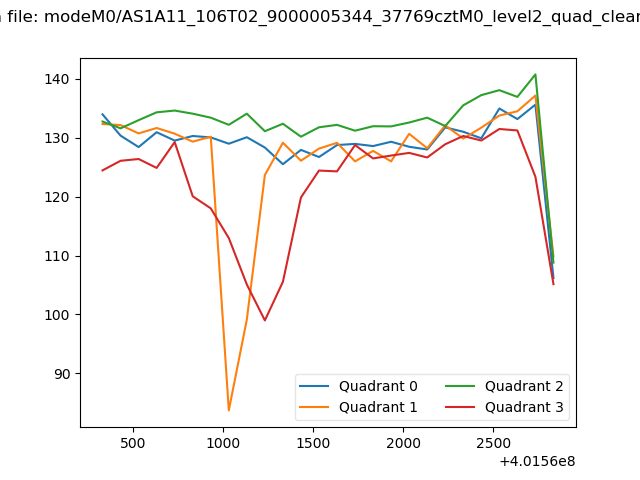
| Quadrant-wise count rates Data is divided into 100 sec bins |
 |
|
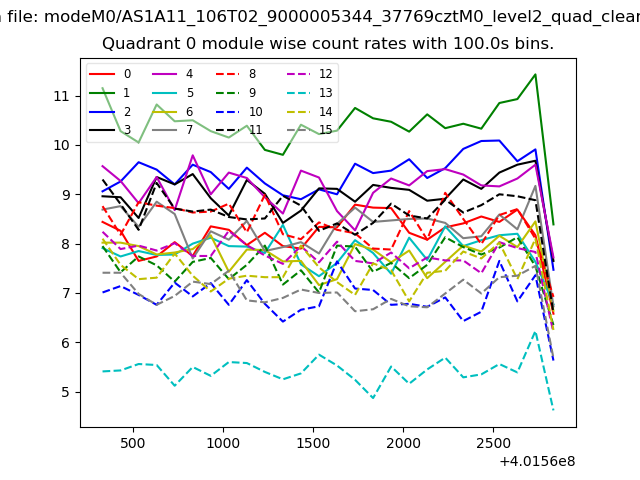
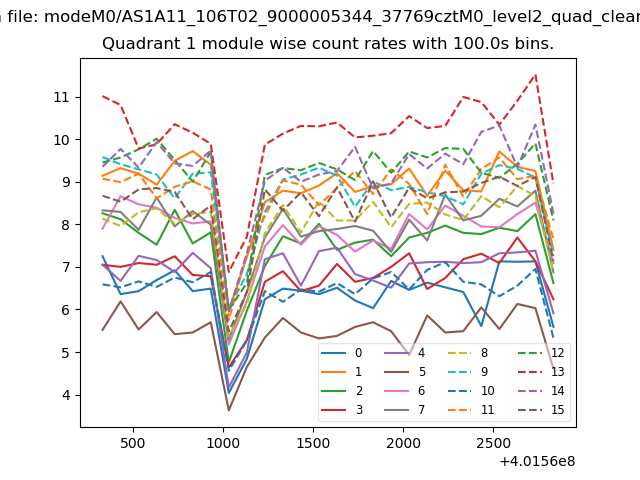
| Module-wise count rates for Quadrant A Data is divided into 100 sec bins |
 |
 |
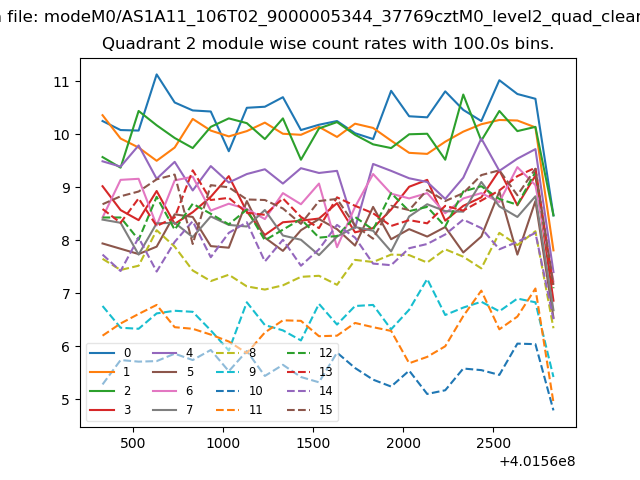
| Module-wise count rates for Quadrant B Data is divided into 100 sec bins |
 |
 |
| Module-wise count rates for Quadrant C Data is divided into 100 sec bins |
 |
 |
| Module-wise count rates for Quadrant D Data is divided into 100 sec bins |
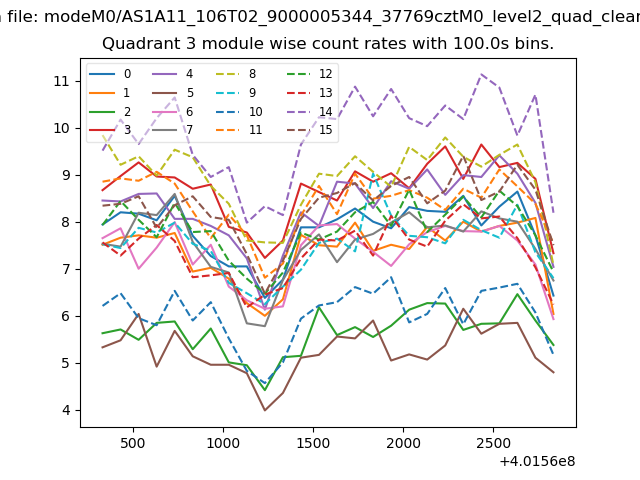 |
 |
| Parameter | Plot |
|---|---|
| CZT HV Monitor | 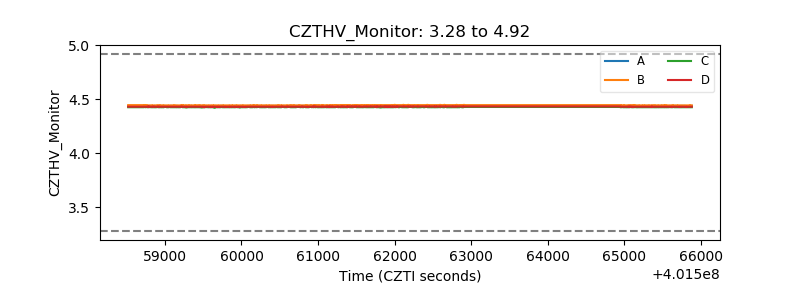 |
| D_VDD | 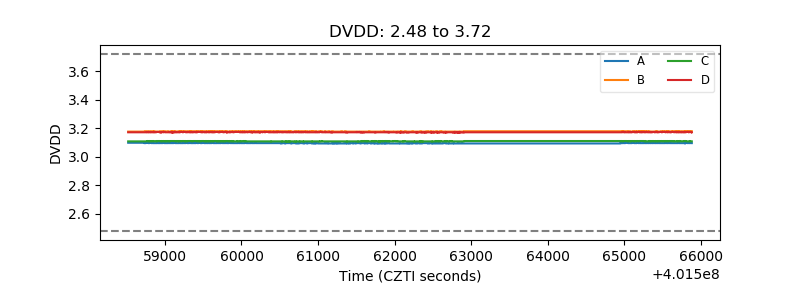 |
| Temperature 1 | 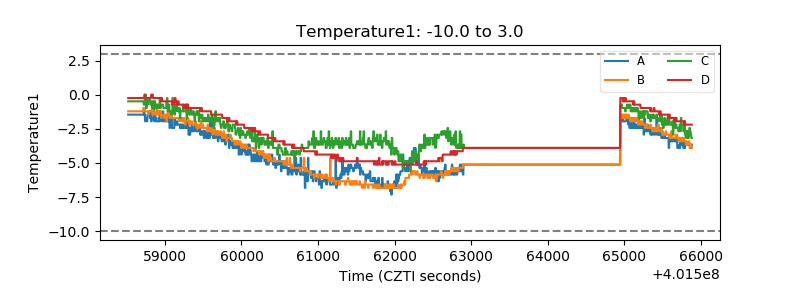 |
| Veto HV Monitor | 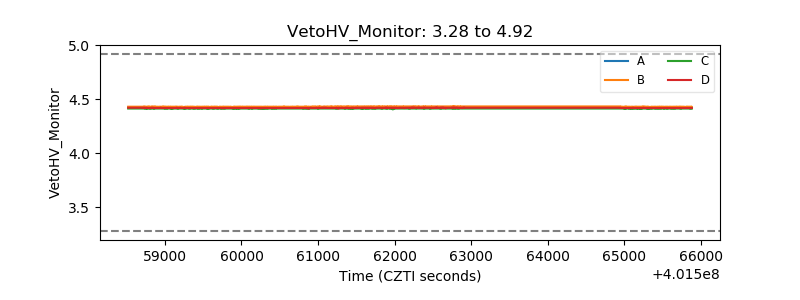 |
| Veto LLD | 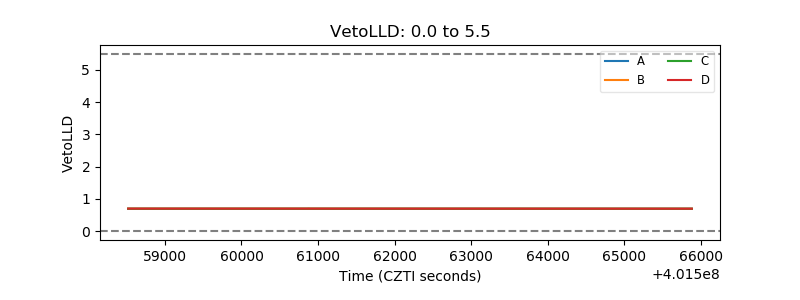 |
| Alpha Counter | 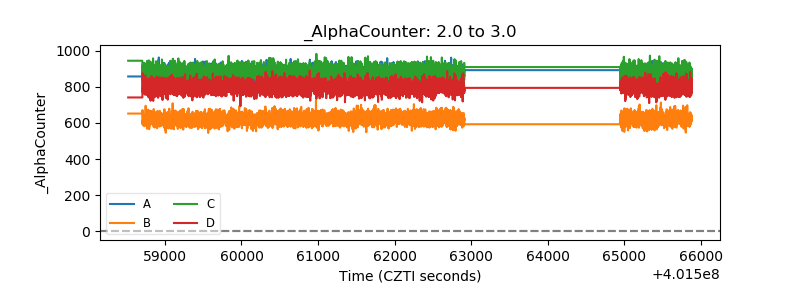 |
| _CPM_Rate | 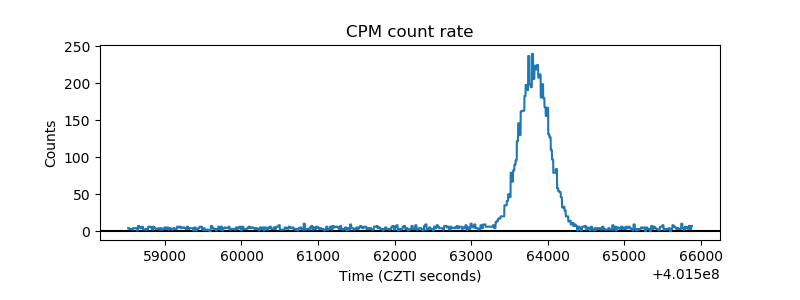 |
| CZT Counter | 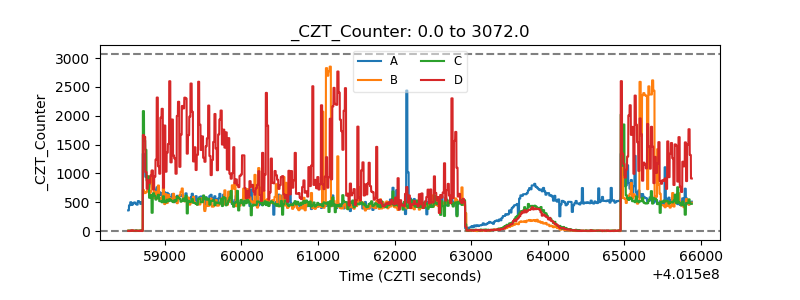 |
| +2.5 Volts monitor | 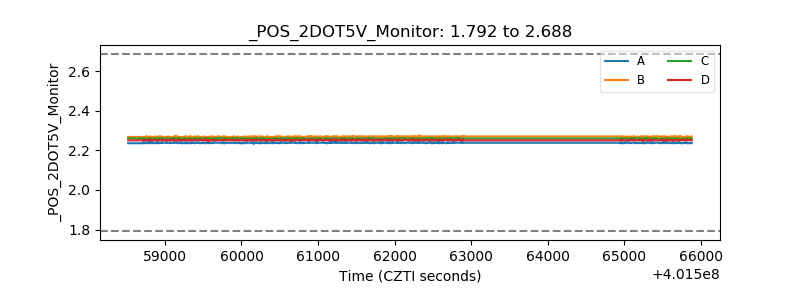 |
| +5 Volts monitor | 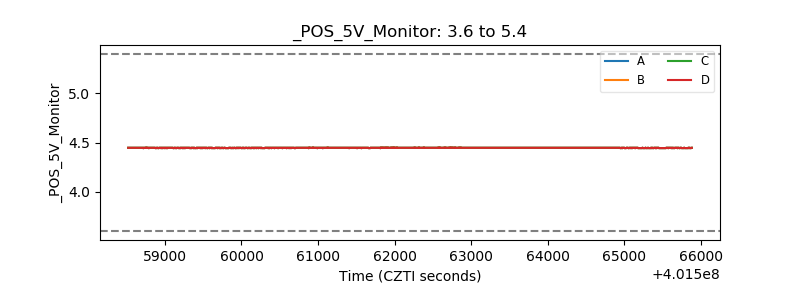 |
| _ROLL_ROT | 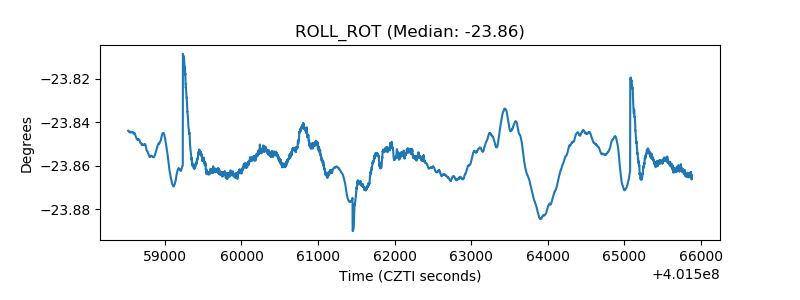 |
| _Roll_DEC | 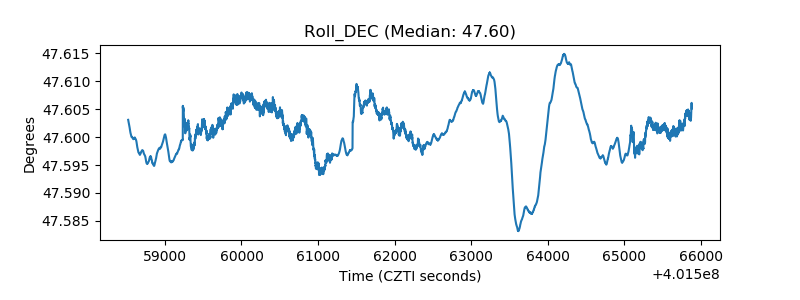 |
| _Roll_RA | 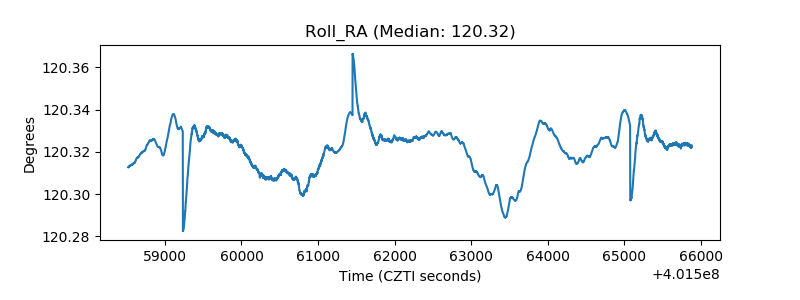 |
| Veto Counter | 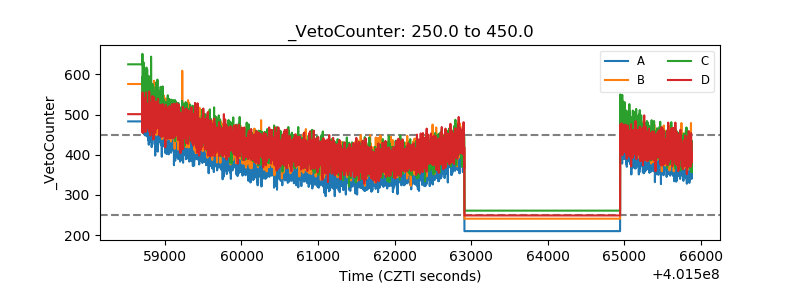 |