| Param | Original file | Final file |
|---|---|---|
| Filename | modeM0/AS1A11_106T02_9000005344_37770cztM0_level2.evt | modeM0/AS1A11_106T02_9000005344_37770cztM0_level2_quad_clean.evt |
| Size (bytes) | 448,323,840 | 65,917,440 |
| Size | 427.6 MB | 62.9 MB |
| Events in quadrant A | 2,947,436 | 408,059 |
| Events in quadrant B | 3,221,936 | 400,917 |
| Events in quadrant C | 2,663,527 | 417,255 |
| Events in quadrant D | 4,385,724 | 399,430 |
| Mode M9 | |||
|---|---|---|---|
| Quadrant | BADHDUFLAG | Total packets | Discarded packets |
| A | 0 | 20 | 0 |
| B | 0 | 20 | 0 |
| C | 0 | 20 | 0 |
| D | 0 | 21 | 0 |
| Mode SS | |||
|---|---|---|---|
| Quadrant | BADHDUFLAG | Total packets | Discarded packets |
| A | 0 | 108 | 0 |
| B | 0 | 108 | 0 |
| C | 0 | 108 | 0 |
| D | 0 | 108 | 0 |
| Mode M0 | |||
|---|---|---|---|
| Quadrant | BADHDUFLAG | Total packets | Discarded packets |
| A | 0 | 12047 | 3 |
| B | 0 | 13088 | 2 |
| C | 0 | 11134 | 2 |
| D | 0 | 16572 | 2 |
| Quadrant | Total seconds | Saturated seconds | Saturation percentage |
|---|---|---|---|
| A | 5285 | 18 | 0.340587% |
| B | 5285 | 289 | 5.468307% |
| C | 5285 | 52 | 0.983917% |
| D | 5285 | 229 | 4.333018% |
Noise dominated data is calculated using 1-second bins in cleaned event files. If a bin has >2000 counts, and if more than 50% of those come from <1% of pixels, then it is considered to be noise-dominated and hence unusable.
| Quadrant | # 1 sec bins | Bins with >0 counts | Bins with >2000 counts | High rate bins dominated by noise | Noise dominated (total time) | Noise dominated (detector-on time) | Marked lightcurve |
|---|---|---|---|---|---|---|---|
| A | 7048 | 5286 | 14 | 14 | 0.20% | 0.26% | 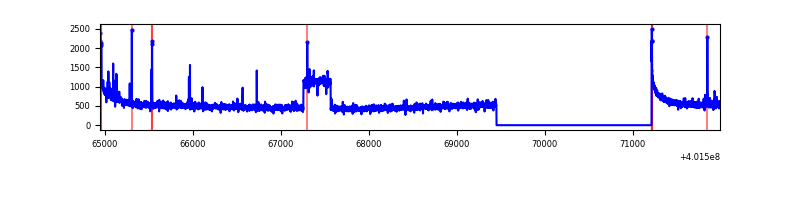 |
| B | 7048 | 5286 | 244 | 244 | 3.46% | 4.62% | 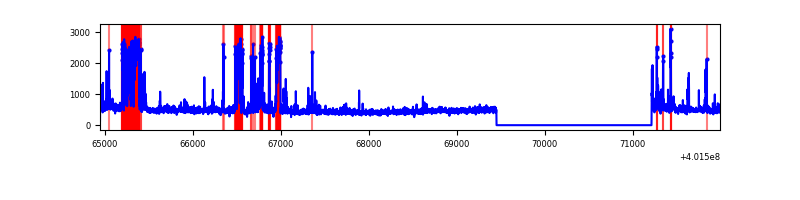 |
| C | 7048 | 5286 | 42 | 42 | 0.60% | 0.79% | 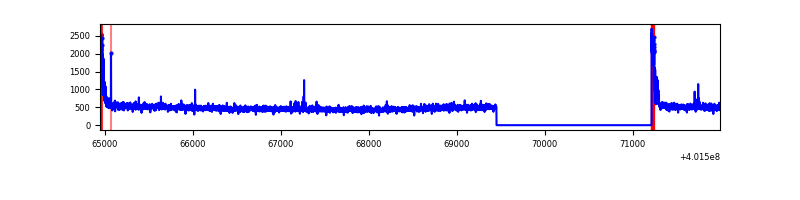 |
| D | 7048 | 5286 | 149 | 149 | 2.11% | 2.82% | 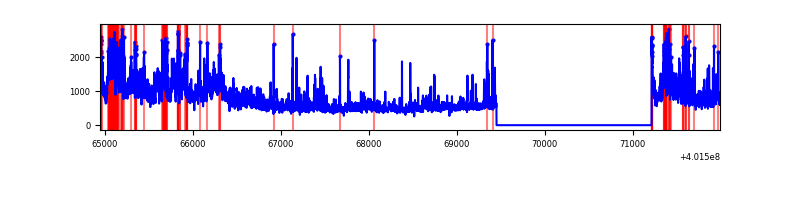 |
Top three noisy pixels from each quadrant. If the there are fewer than three noisy pixels in the level2.evt file, extra rows are filled as -1
| Pixel properties | Quadrant properties | ||||||
|---|---|---|---|---|---|---|---|
| Quadrant | DetID | PixID | Counts | Sigma | Mean | Median | Sigma |
| A | 10 | 83 | 352147 | 2961.18 | 595 | 583 | 118.7 |
| A | 15 | 222 | 214466 | 1801.51 | 595 | 583 | 118.7 |
| A | 9 | 143 | 49737 | 414.01 | 595 | 583 | 118.7 |
| B | 5 | 255 | 529719 | 4823.82 | 575 | 561 | 109.7 |
| B | 4 | 81 | 153170 | 1391.19 | 575 | 561 | 109.7 |
| B | 0 | 229 | 78663 | 711.98 | 575 | 561 | 109.7 |
| C | 15 | 214 | 226056 | 1662.91 | 584 | 588 | 135.6 |
| C | 0 | 10 | 144731 | 1063.11 | 584 | 588 | 135.6 |
| C | 14 | 254 | 8379 | 57.46 | 584 | 588 | 135.6 |
| D | 12 | 235 | 1426679 | 10161.66 | 577 | 561 | 140.3 |
| D | 2 | 249 | 232744 | 1654.4 | 577 | 561 | 140.3 |
| D | 13 | 249 | 160952 | 1142.85 | 577 | 561 | 140.3 |
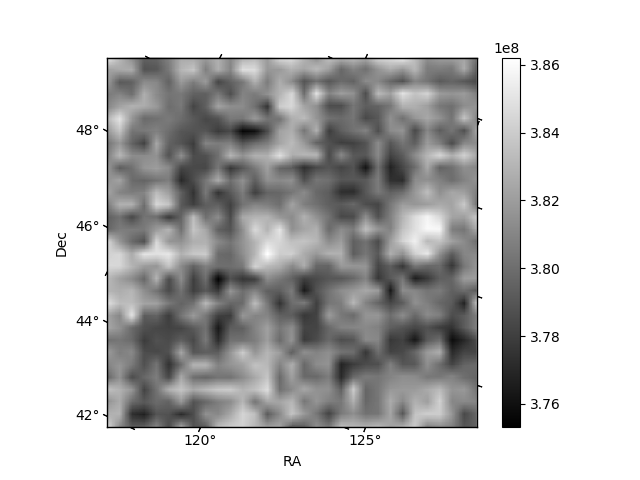
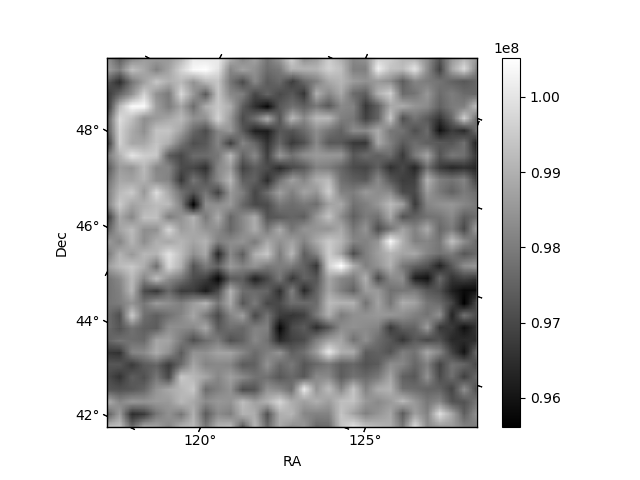
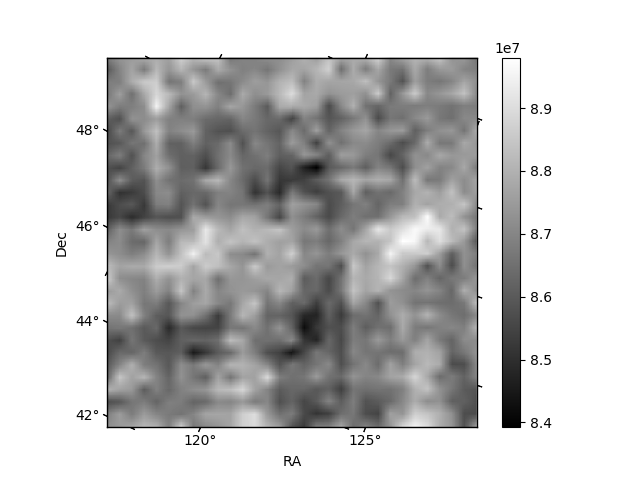
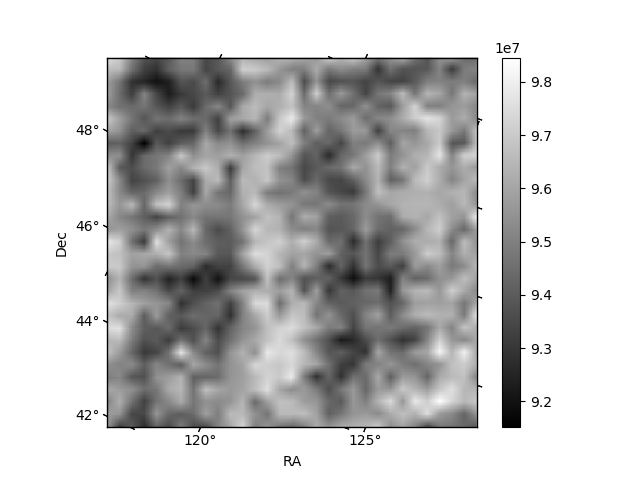
Histogram calculated using DETX and DETY for each event in the final _common_clean file
| Quadrant A | 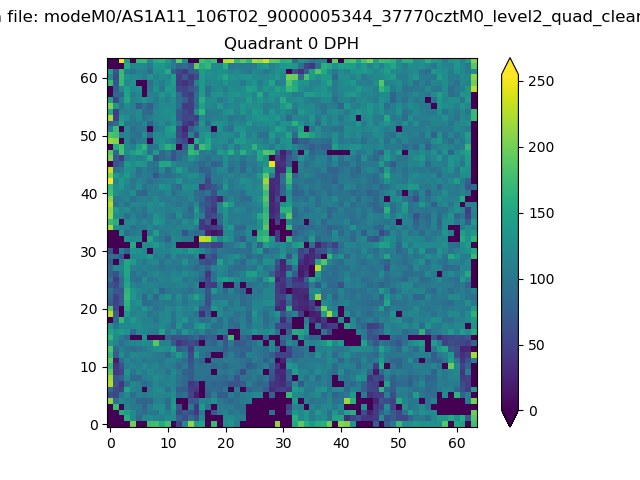 |
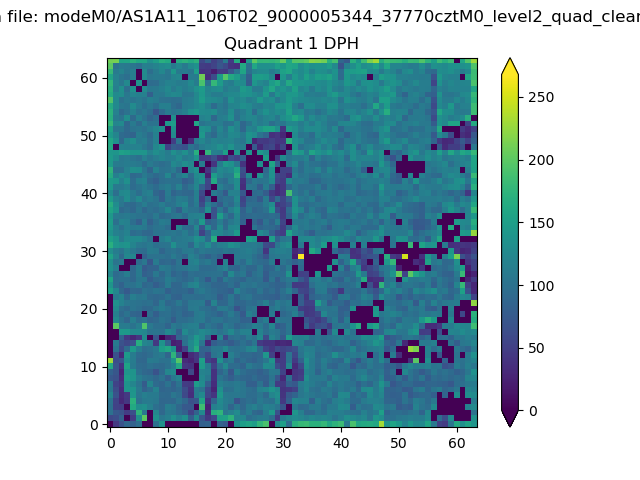 |
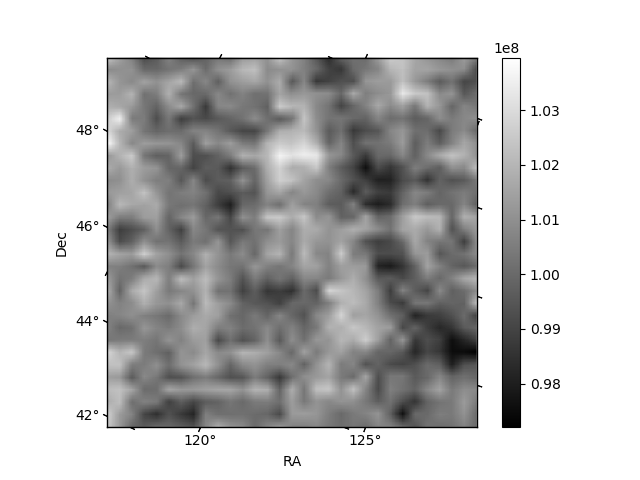
Quadrant B |
|---|---|---|---|
| Quadrant D | 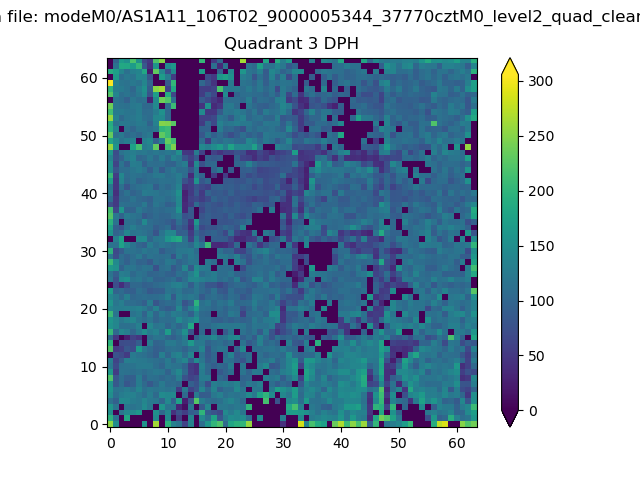 |
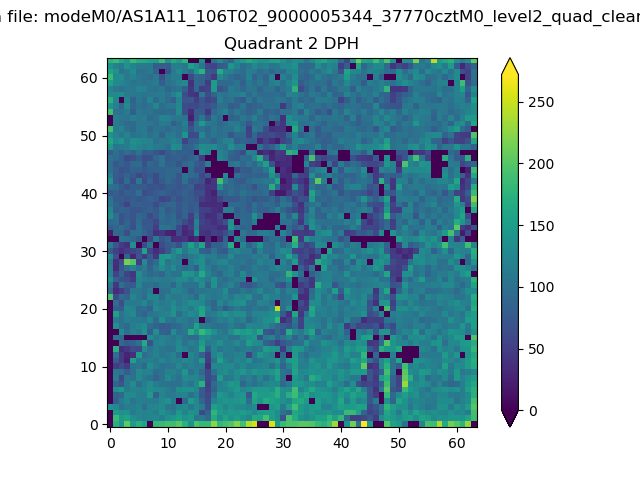 |
Quadrant C |
| Plot type | Count rate plots | Images |
|---|---|---|
| Comparison with Poisson distribution Blue bars denote a histogram of data divided into 1 sec bins. Red curve is a Poisson curve with rate = median count rate of data. |
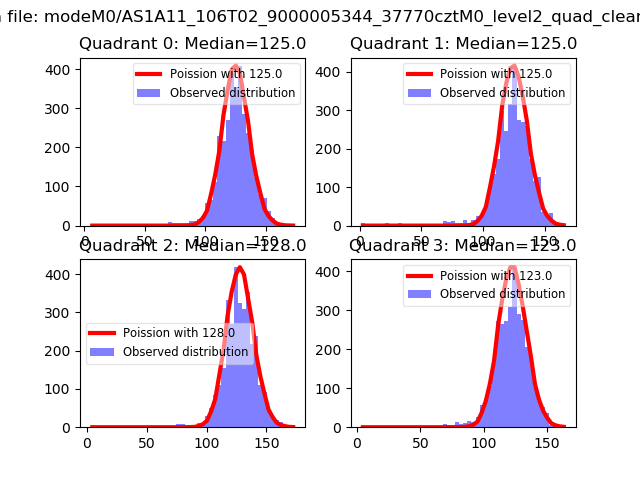 |
 |
| Quadrant-wise count rates Data is divided into 100 sec bins |
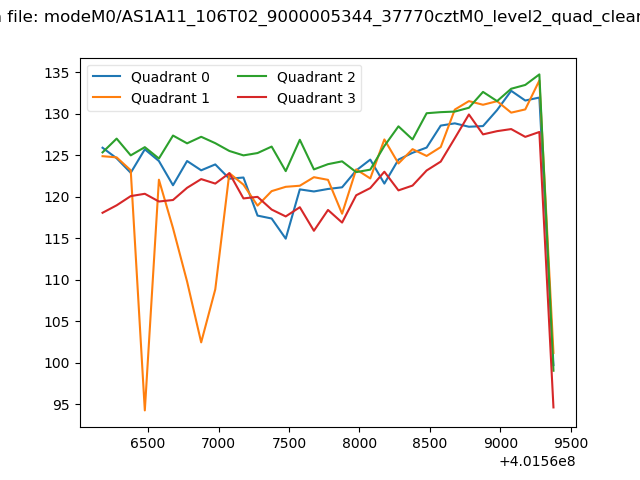 |
|
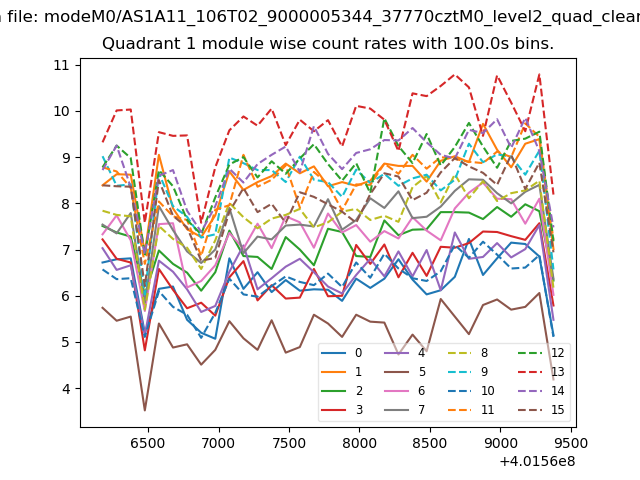
| Module-wise count rates for Quadrant A Data is divided into 100 sec bins |
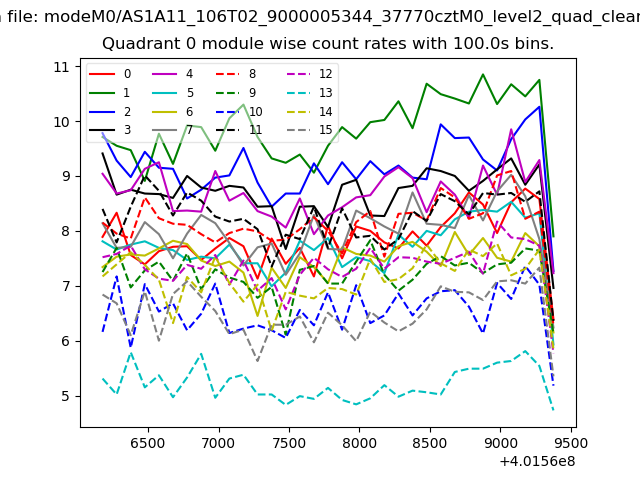 |
 |
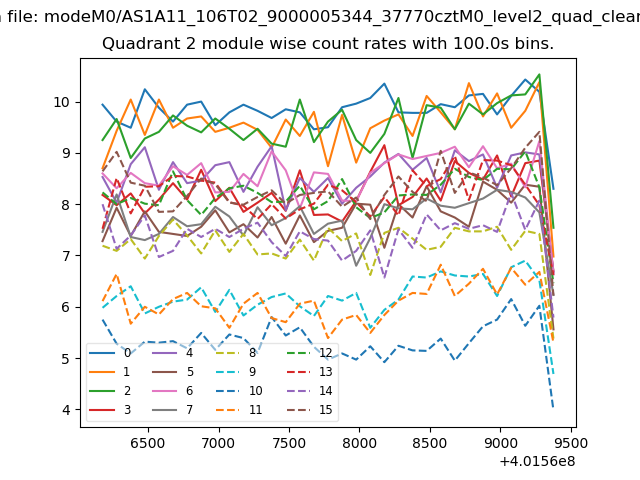
| Module-wise count rates for Quadrant B Data is divided into 100 sec bins |
 |
 |
| Module-wise count rates for Quadrant C Data is divided into 100 sec bins |
 |
 |
| Module-wise count rates for Quadrant D Data is divided into 100 sec bins |
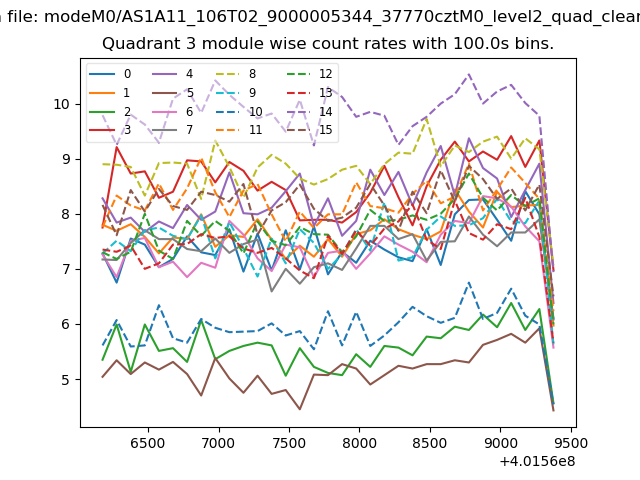 |
 |
| Parameter | Plot |
|---|---|
| CZT HV Monitor |  |
| D_VDD | 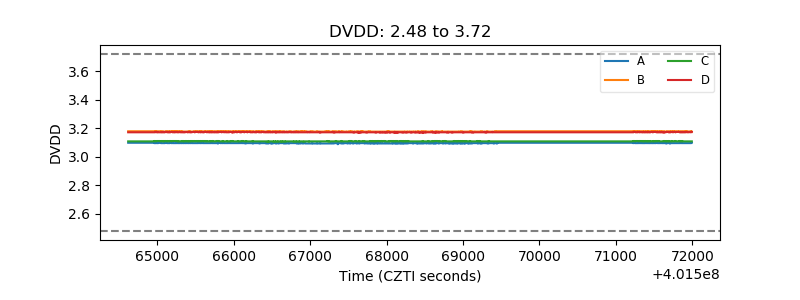 |
| Temperature 1 | 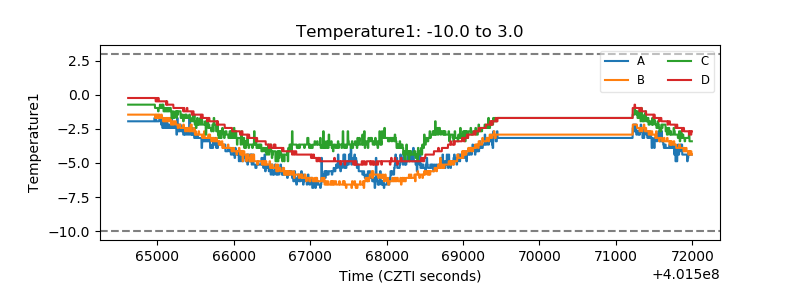 |
| Veto HV Monitor | 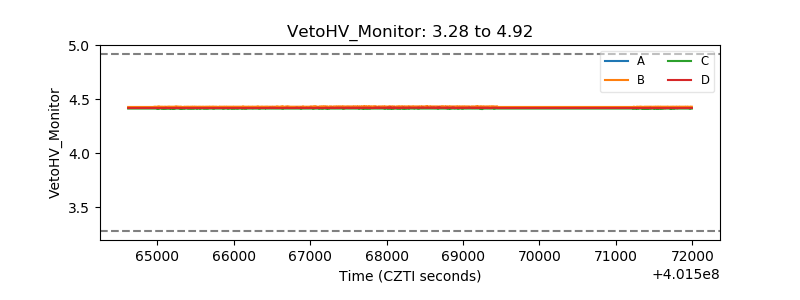 |
| Veto LLD | 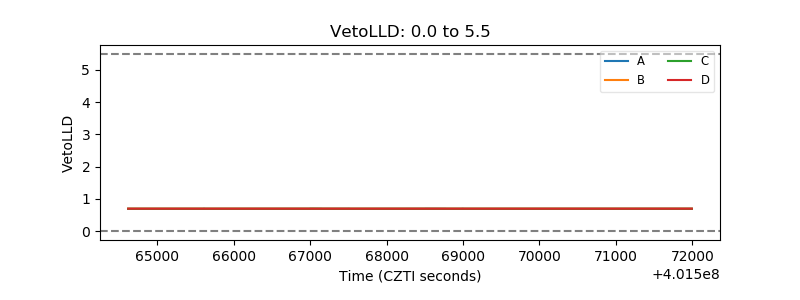 |
| Alpha Counter | 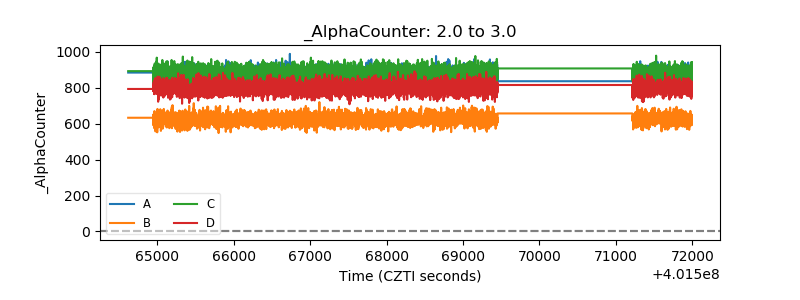 |
| _CPM_Rate | 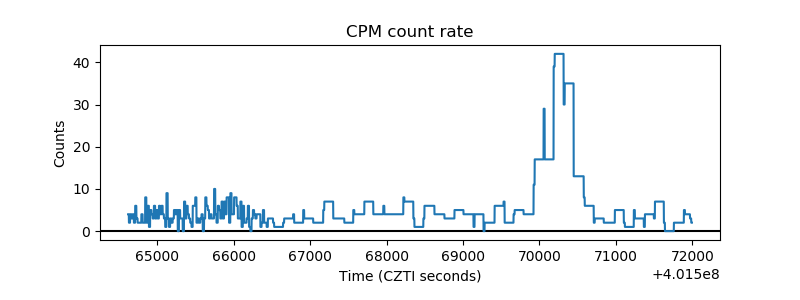 |
| CZT Counter | 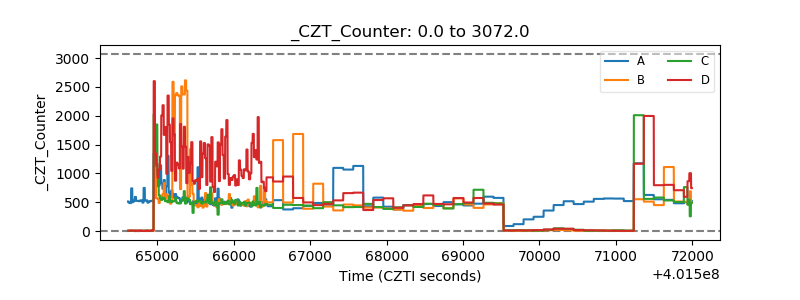 |
| +2.5 Volts monitor | 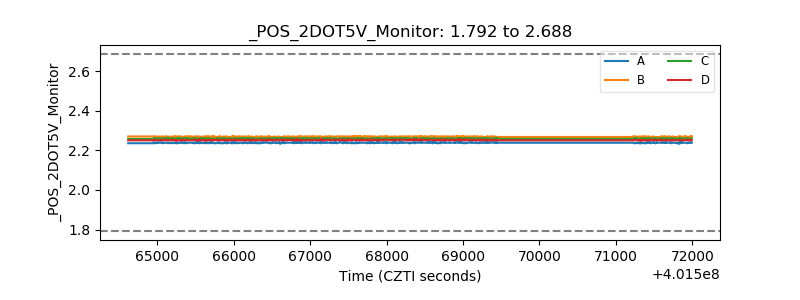 |
| +5 Volts monitor | 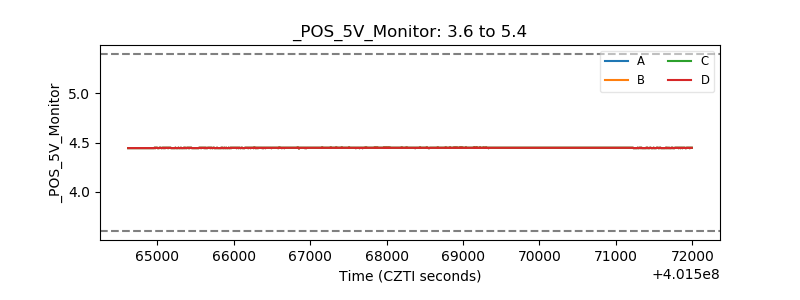 |
| _ROLL_ROT | 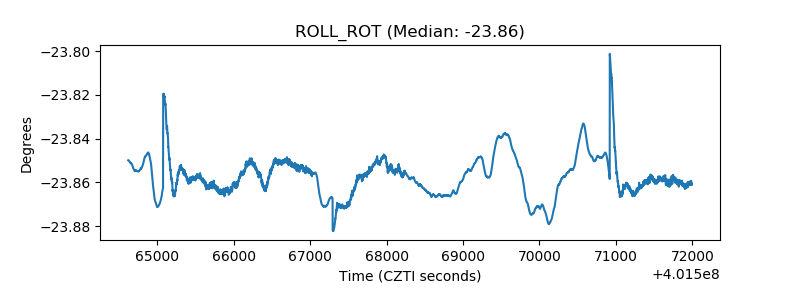 |
| _Roll_DEC | 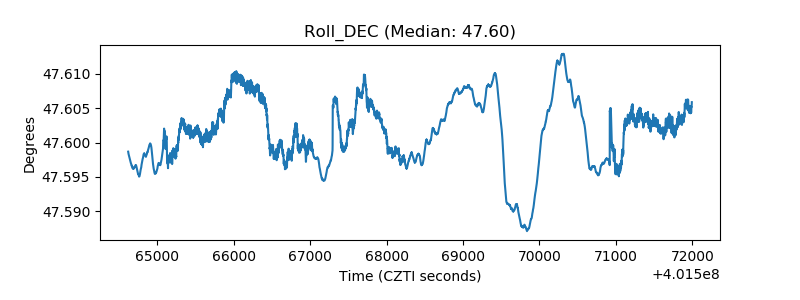 |
| _Roll_RA | 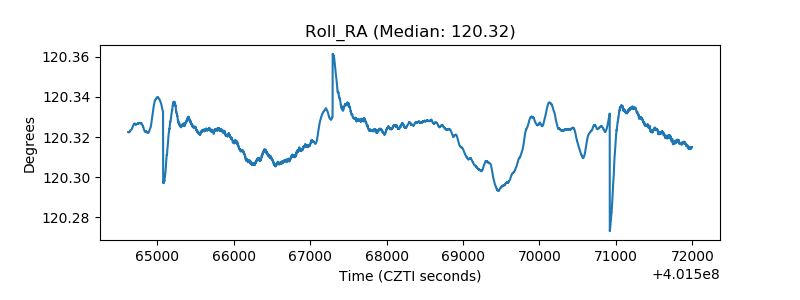 |
| Veto Counter | 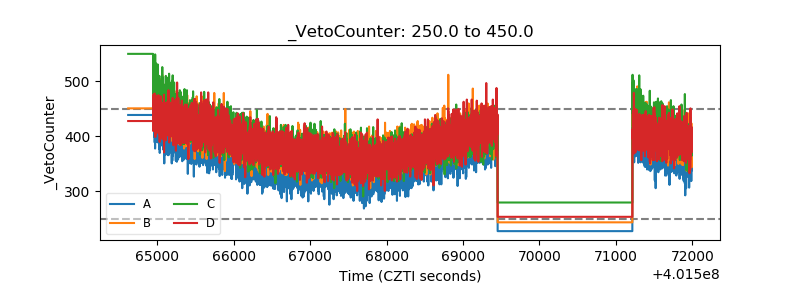 |