| Param | Original file | Final file |
|---|---|---|
| Filename | modeM0/AS1A11_106T02_9000005344_37771cztM0_level2.evt | modeM0/AS1A11_106T02_9000005344_37771cztM0_level2_quad_clean.evt |
| Size (bytes) | 461,283,840 | 86,065,920 |
| Size | 439.9 MB | 82.1 MB |
| Events in quadrant A | 3,020,660 | 554,734 |
| Events in quadrant B | 3,186,554 | 553,128 |
| Events in quadrant C | 2,851,843 | 564,133 |
| Events in quadrant D | 4,522,174 | 533,821 |
| Mode M9 | |||
|---|---|---|---|
| Quadrant | BADHDUFLAG | Total packets | Discarded packets |
| A | 0 | 17 | 0 |
| B | 0 | 17 | 0 |
| C | 0 | 17 | 0 |
| D | 0 | 18 | 0 |
| Mode SS | |||
|---|---|---|---|
| Quadrant | BADHDUFLAG | Total packets | Discarded packets |
| A | 0 | 118 | 0 |
| B | 0 | 118 | 0 |
| C | 0 | 118 | 0 |
| D | 0 | 118 | 0 |
| Mode M0 | |||
|---|---|---|---|
| Quadrant | BADHDUFLAG | Total packets | Discarded packets |
| A | 0 | 12641 | 3 |
| B | 0 | 13329 | 2 |
| C | 0 | 12036 | 2 |
| D | 0 | 17467 | 2 |
| Quadrant | Total seconds | Saturated seconds | Saturation percentage |
|---|---|---|---|
| A | 5724 | 30 | 0.524109% |
| B | 5724 | 55 | 0.960867% |
| C | 5724 | 56 | 0.978337% |
| D | 5724 | 212 | 3.703704% |
Noise dominated data is calculated using 1-second bins in cleaned event files. If a bin has >2000 counts, and if more than 50% of those come from <1% of pixels, then it is considered to be noise-dominated and hence unusable.
| Quadrant | # 1 sec bins | Bins with >0 counts | Bins with >2000 counts | High rate bins dominated by noise | Noise dominated (total time) | Noise dominated (detector-on time) | Marked lightcurve |
|---|---|---|---|---|---|---|---|
| A | 7157 | 5725 | 26 | 26 | 0.36% | 0.45% | 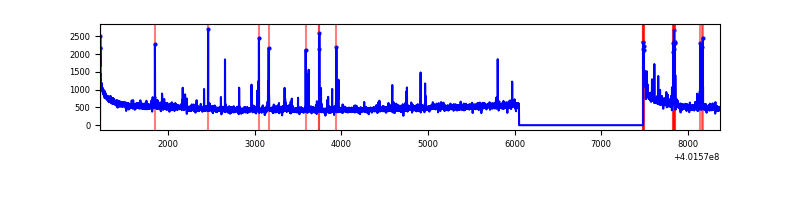 |
| B | 7157 | 5725 | 33 | 33 | 0.46% | 0.58% | 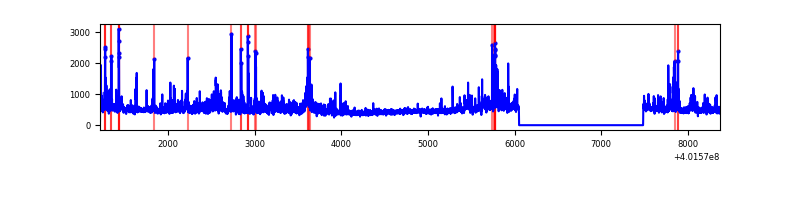 |
| C | 7157 | 5725 | 49 | 49 | 0.68% | 0.86% | 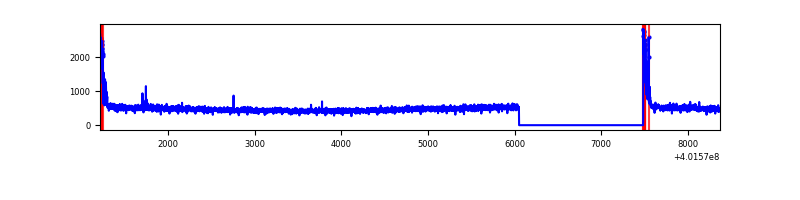 |
| D | 7157 | 5725 | 158 | 158 | 2.21% | 2.76% | 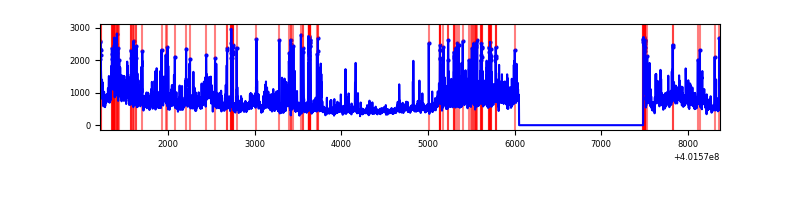 |
Top three noisy pixels from each quadrant. If the there are fewer than three noisy pixels in the level2.evt file, extra rows are filled as -1
| Pixel properties | Quadrant properties | ||||||
|---|---|---|---|---|---|---|---|
| Quadrant | DetID | PixID | Counts | Sigma | Mean | Median | Sigma |
| A | 10 | 83 | 361017 | 2792.22 | 638 | 625 | 129.1 |
| A | 9 | 143 | 138364 | 1067.17 | 638 | 625 | 129.1 |
| A | 12 | 189 | 16515 | 123.11 | 638 | 625 | 129.1 |
| B | 0 | 213 | 182825 | 1503.15 | 630 | 615 | 121.2 |
| B | 0 | 229 | 112970 | 926.88 | 630 | 615 | 121.2 |
| B | 5 | 255 | 68910 | 563.4 | 630 | 615 | 121.2 |
| C | 15 | 214 | 242021 | 1658.42 | 625 | 630 | 145.6 |
| C | 0 | 10 | 162594 | 1112.73 | 625 | 630 | 145.6 |
| C | 14 | 254 | 4279 | 25.07 | 625 | 630 | 145.6 |
| D | 12 | 235 | 1049230 | 6925.38 | 618 | 601 | 151.4 |
| D | 2 | 249 | 497110 | 3279.06 | 618 | 601 | 151.4 |
| D | 2 | 153 | 128086 | 841.94 | 618 | 601 | 151.4 |
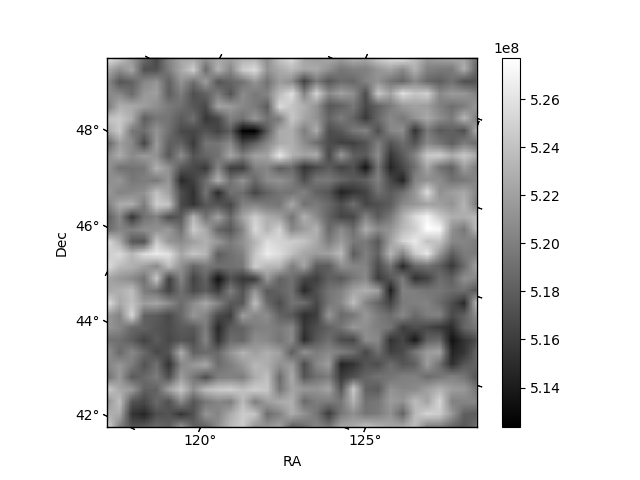
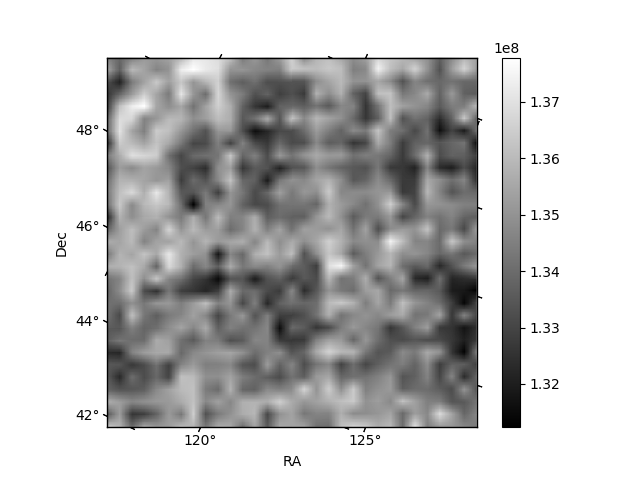
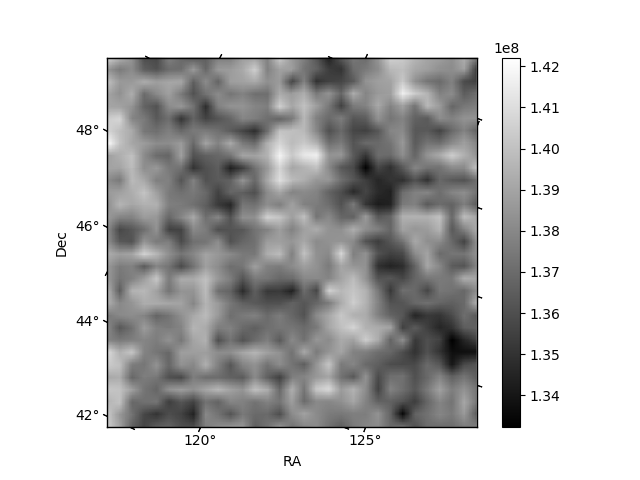
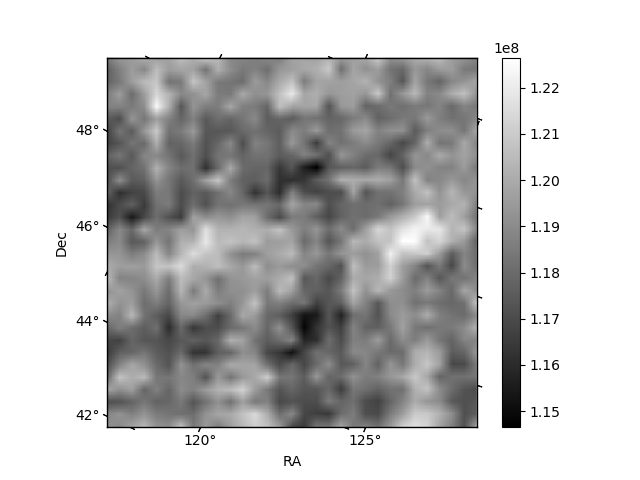
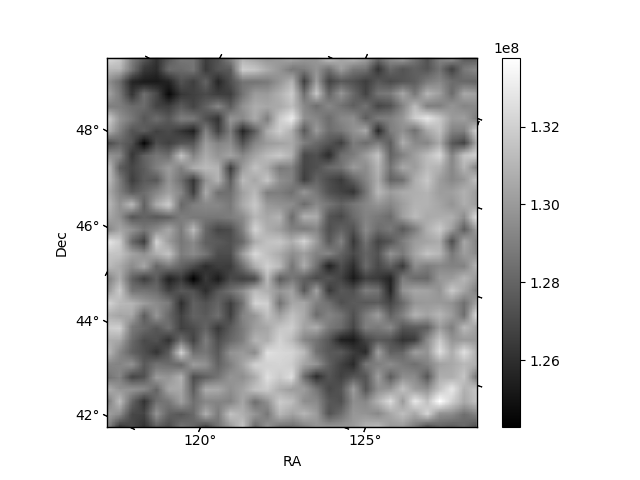
Histogram calculated using DETX and DETY for each event in the final _common_clean file
| Quadrant A | 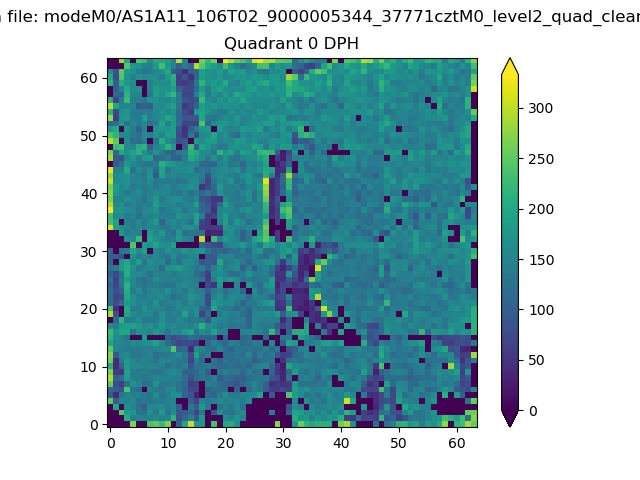 |
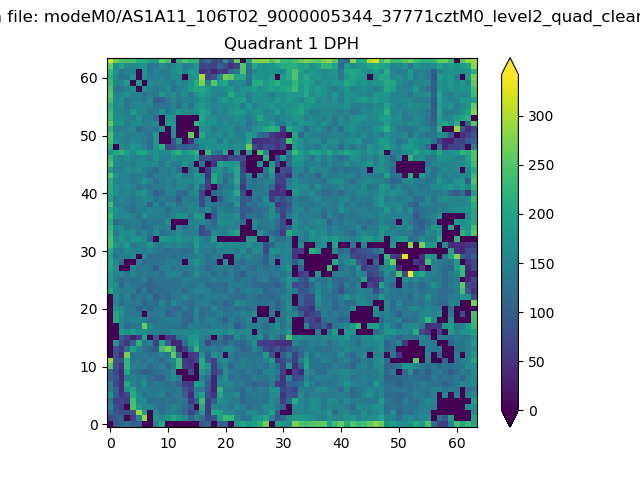 |
Quadrant B |
|---|---|---|---|
| Quadrant D | 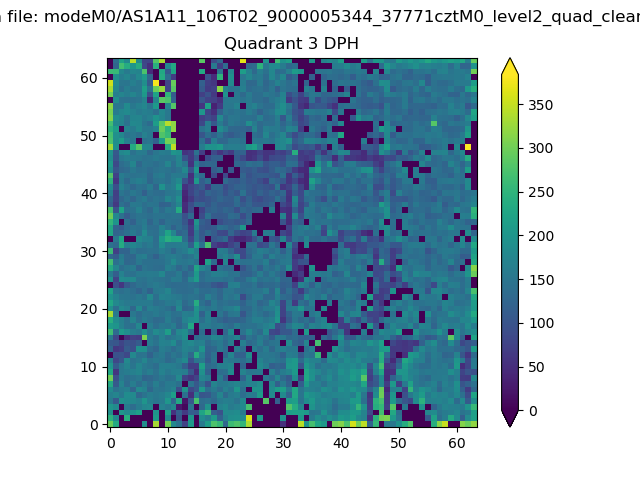 |
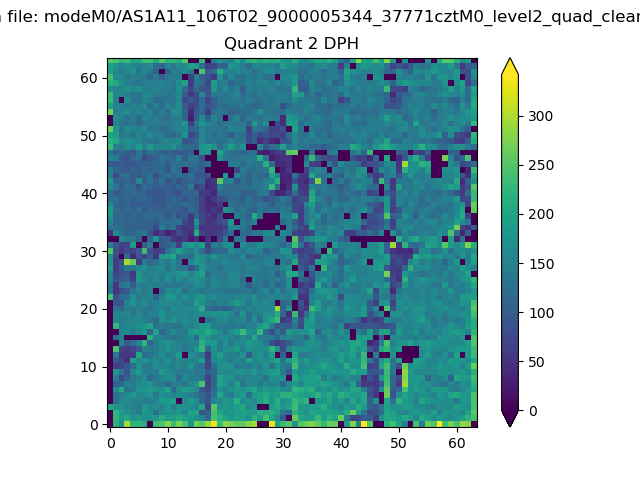 |
Quadrant C |
| Plot type | Count rate plots | Images |
|---|---|---|
| Comparison with Poisson distribution Blue bars denote a histogram of data divided into 1 sec bins. Red curve is a Poisson curve with rate = median count rate of data. |
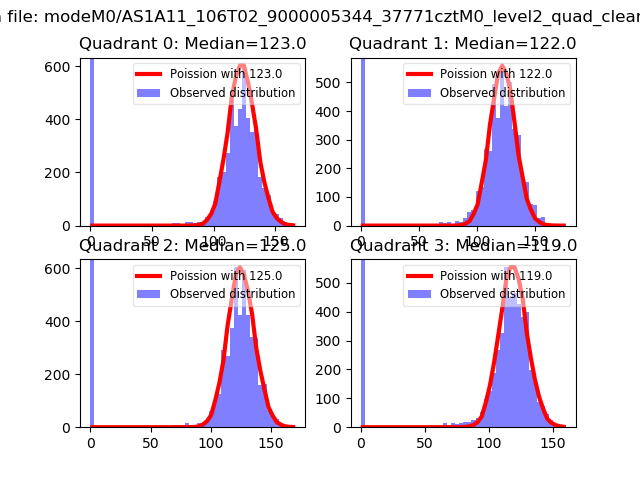 |
 |
| Quadrant-wise count rates Data is divided into 100 sec bins |
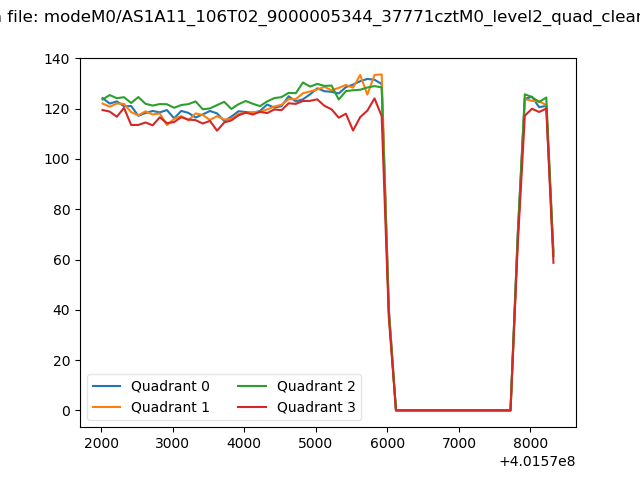 |
|
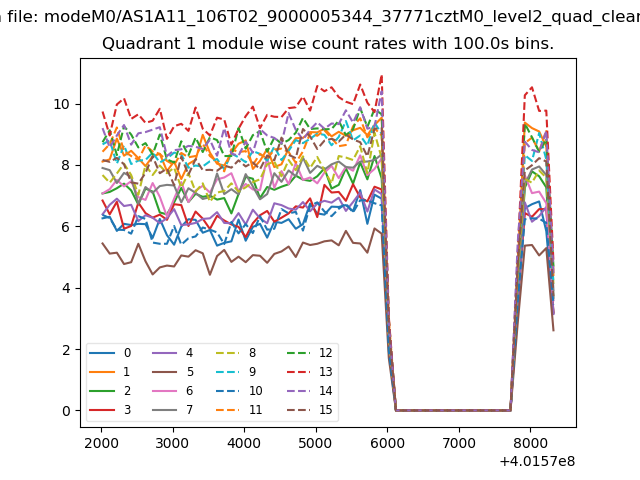
| Module-wise count rates for Quadrant A Data is divided into 100 sec bins |
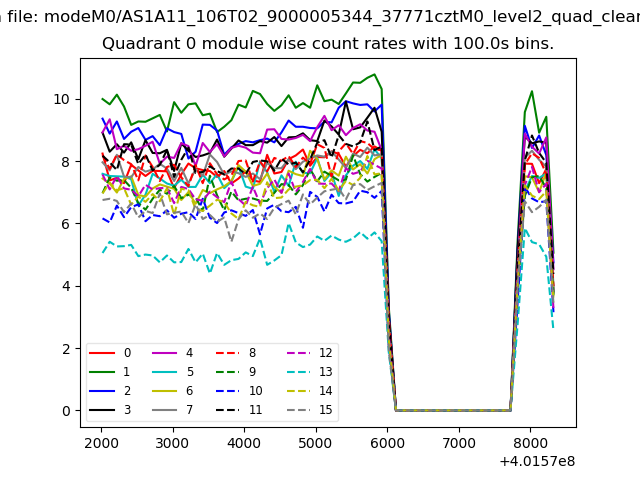 |
 |
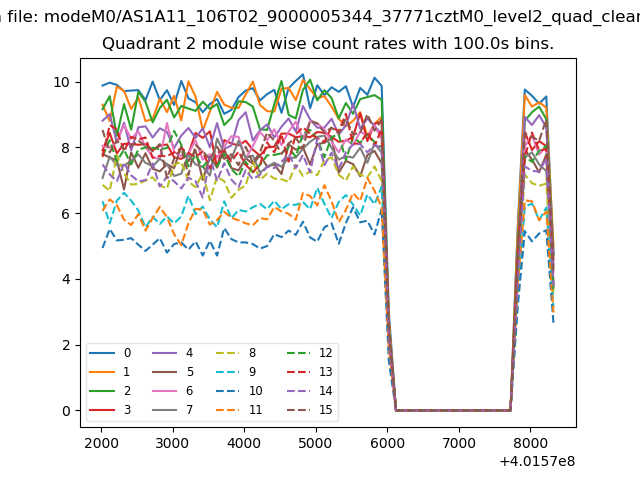
| Module-wise count rates for Quadrant B Data is divided into 100 sec bins |
 |
 |
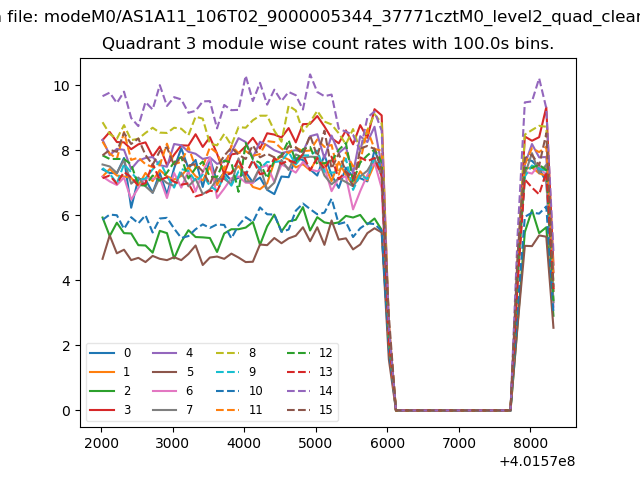
| Module-wise count rates for Quadrant C Data is divided into 100 sec bins |
 |
 |
| Module-wise count rates for Quadrant D Data is divided into 100 sec bins |
 |
 |
| Parameter | Plot |
|---|---|
| CZT HV Monitor | 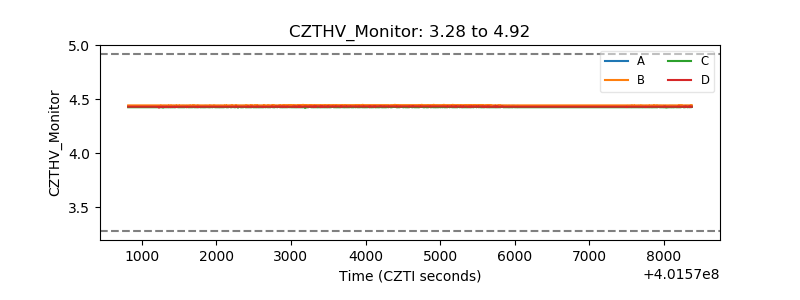 |
| D_VDD | 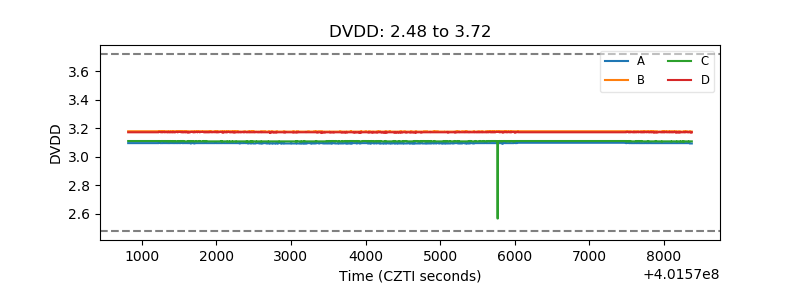 |
| Temperature 1 | 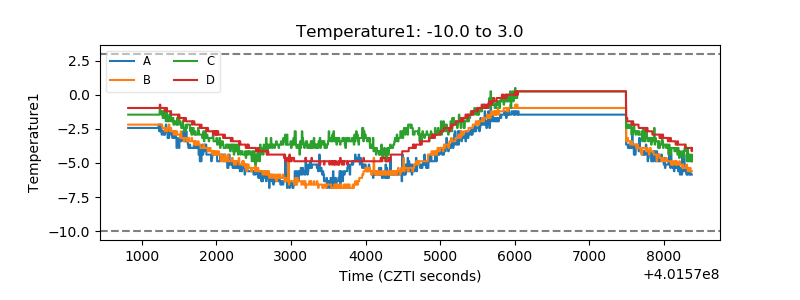 |
| Veto HV Monitor |  |
| Veto LLD | 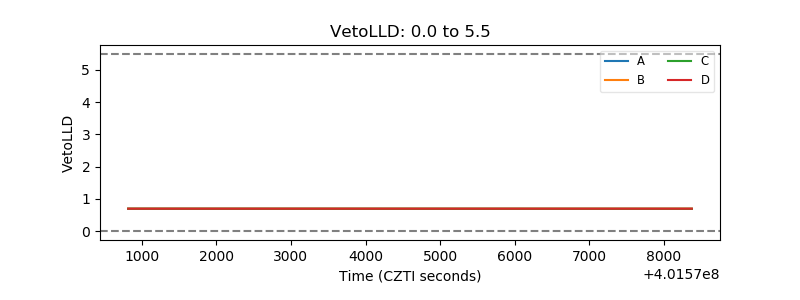 |
| Alpha Counter | 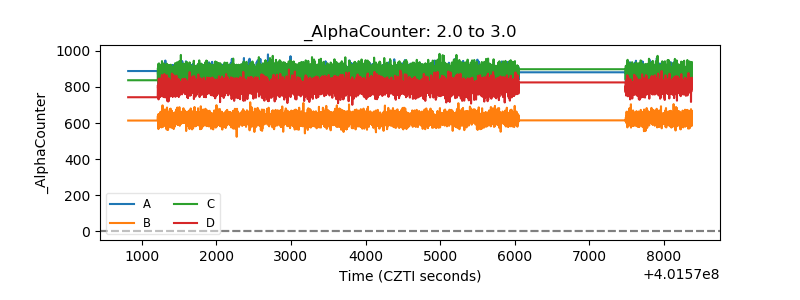 |
| _CPM_Rate | 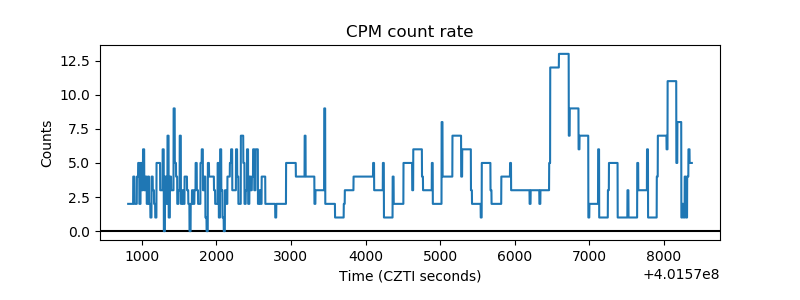 |
| CZT Counter |  |
| +2.5 Volts monitor | 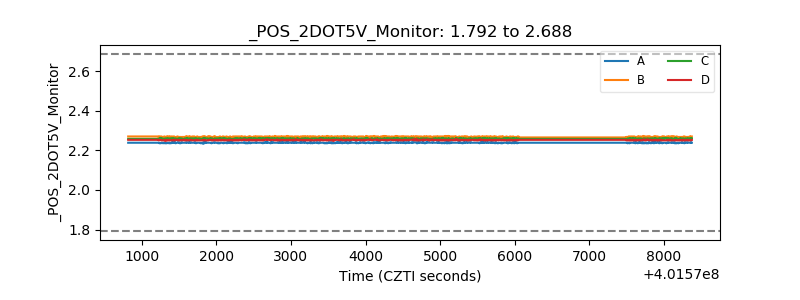 |
| +5 Volts monitor | 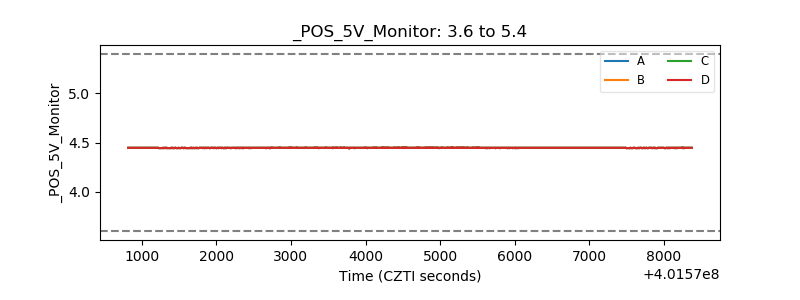 |
| _ROLL_ROT | 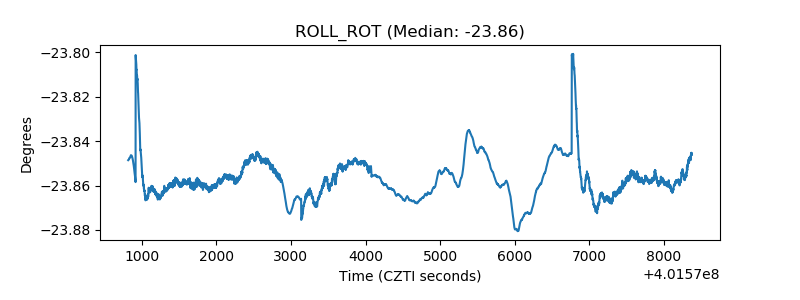 |
| _Roll_DEC | 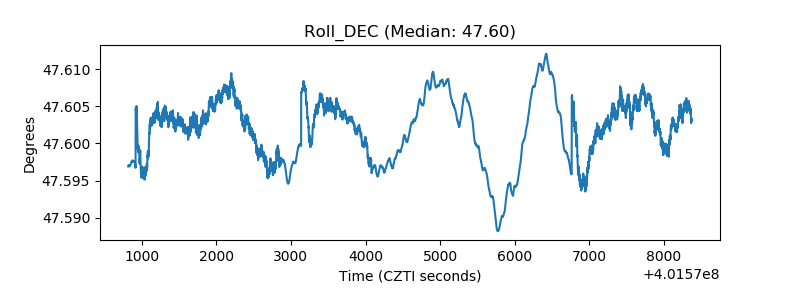 |
| _Roll_RA | 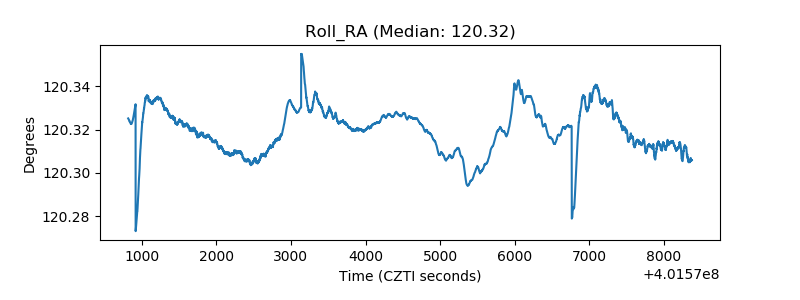 |
| Veto Counter | 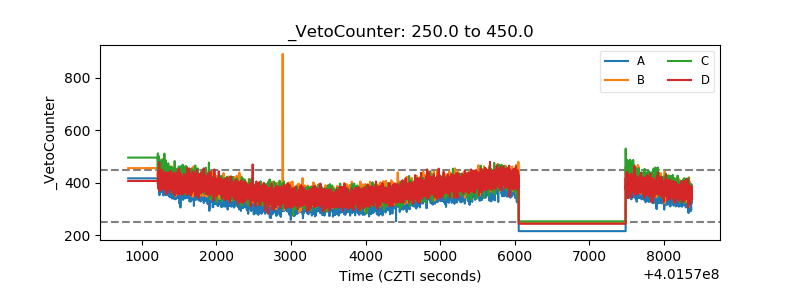 |