| Param | Original file | Final file |
|---|---|---|
| Filename | modeM0/AS1A11_106T02_9000005344_37772cztM0_level2.evt | modeM0/AS1A11_106T02_9000005344_37772cztM0_level2_quad_clean.evt |
| Size (bytes) | 446,184,000 | 90,339,840 |
| Size | 425.5 MB | 86.2 MB |
| Events in quadrant A | 2,994,535 | 586,645 |
| Events in quadrant B | 3,391,615 | 576,916 |
| Events in quadrant C | 2,859,899 | 597,282 |
| Events in quadrant D | 3,872,230 | 569,130 |
| Mode M9 | |||
|---|---|---|---|
| Quadrant | BADHDUFLAG | Total packets | Discarded packets |
| A | 0 | 20 | 0 |
| B | 0 | 20 | 0 |
| C | 0 | 20 | 0 |
| D | 0 | 21 | 0 |
| Mode SS | |||
|---|---|---|---|
| Quadrant | BADHDUFLAG | Total packets | Discarded packets |
| A | 0 | 118 | 0 |
| B | 0 | 118 | 0 |
| C | 0 | 118 | 0 |
| D | 0 | 118 | 0 |
| Mode M0 | |||
|---|---|---|---|
| Quadrant | BADHDUFLAG | Total packets | Discarded packets |
| A | 0 | 12740 | 3 |
| B | 0 | 14206 | 2 |
| C | 0 | 12178 | 2 |
| D | 0 | 15560 | 2 |
| Quadrant | Total seconds | Saturated seconds | Saturation percentage |
|---|---|---|---|
| A | 5807 | 32 | 0.551059% |
| B | 5807 | 197 | 3.392457% |
| C | 5807 | 40 | 0.688824% |
| D | 5807 | 104 | 1.790942% |
Noise dominated data is calculated using 1-second bins in cleaned event files. If a bin has >2000 counts, and if more than 50% of those come from <1% of pixels, then it is considered to be noise-dominated and hence unusable.
| Quadrant | # 1 sec bins | Bins with >0 counts | Bins with >2000 counts | High rate bins dominated by noise | Noise dominated (total time) | Noise dominated (detector-on time) | Marked lightcurve |
|---|---|---|---|---|---|---|---|
| A | 7119 | 5808 | 24 | 24 | 0.34% | 0.41% | 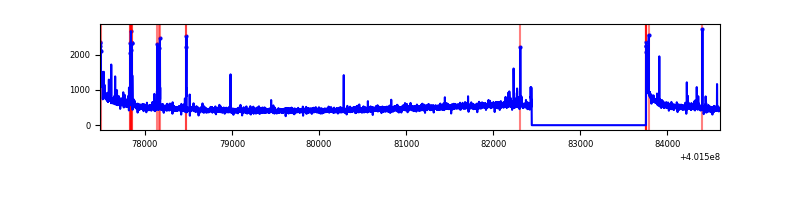 |
| B | 7119 | 5808 | 166 | 166 | 2.33% | 2.86% | 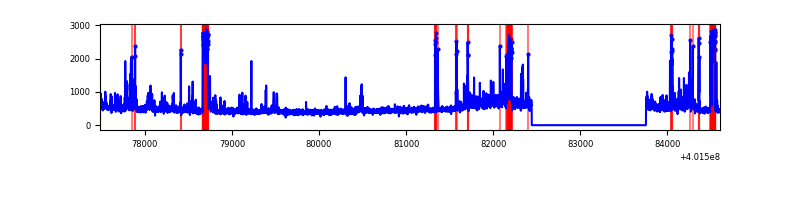 |
| C | 7119 | 5808 | 33 | 33 | 0.46% | 0.57% | 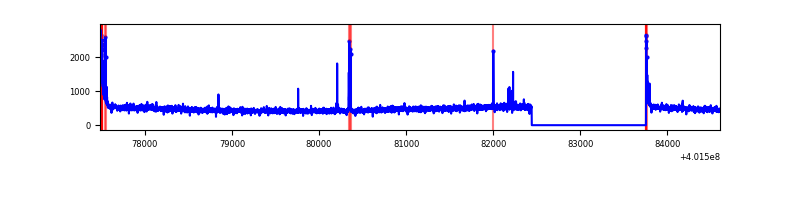 |
| D | 7119 | 5807 | 93 | 93 | 1.31% | 1.60% | 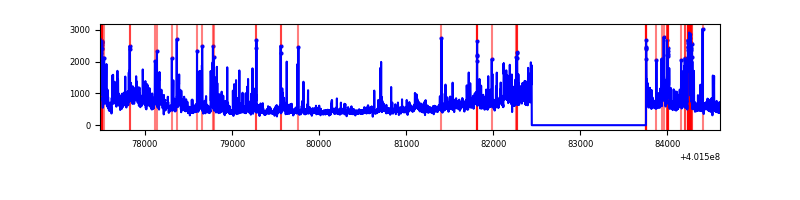 |
Top three noisy pixels from each quadrant. If the there are fewer than three noisy pixels in the level2.evt file, extra rows are filled as -1
| Pixel properties | Quadrant properties | ||||||
|---|---|---|---|---|---|---|---|
| Quadrant | DetID | PixID | Counts | Sigma | Mean | Median | Sigma |
| A | 10 | 83 | 353126 | 2700.83 | 644 | 630 | 130.5 |
| A | 9 | 143 | 98798 | 752.16 | 644 | 630 | 130.5 |
| A | 13 | 6 | 16202 | 119.31 | 644 | 630 | 130.5 |
| B | 4 | 81 | 292636 | 2417.66 | 630 | 616 | 120.8 |
| B | 5 | 172 | 247472 | 2043.74 | 630 | 616 | 120.8 |
| B | 0 | 213 | 129691 | 1068.62 | 630 | 616 | 120.8 |
| C | 15 | 214 | 240226 | 1616.96 | 631 | 635 | 148.2 |
| C | 0 | 10 | 116909 | 784.72 | 631 | 635 | 148.2 |
| C | 12 | 250 | 21937 | 143.76 | 631 | 635 | 148.2 |
| D | 12 | 235 | 625481 | 4086.87 | 627 | 611 | 152.9 |
| D | 13 | 249 | 243580 | 1589.1 | 627 | 611 | 152.9 |
| D | 2 | 249 | 134697 | 876.97 | 627 | 611 | 152.9 |
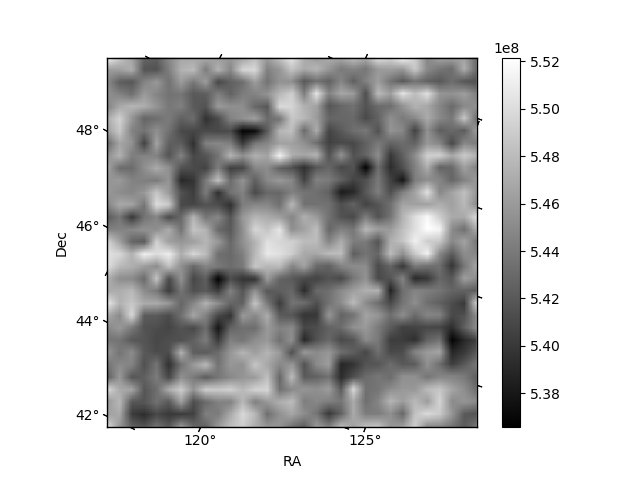
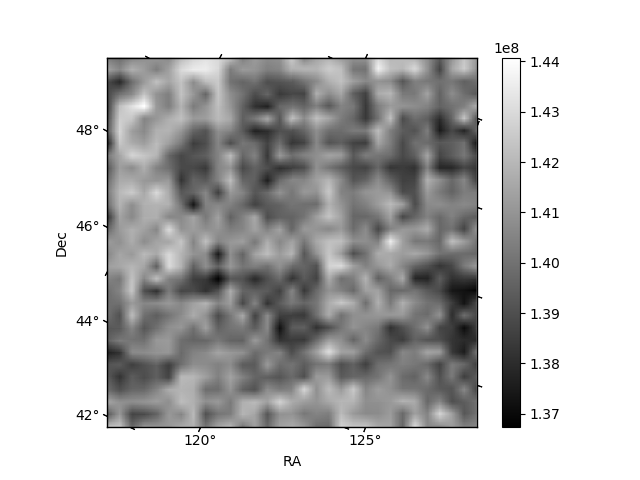
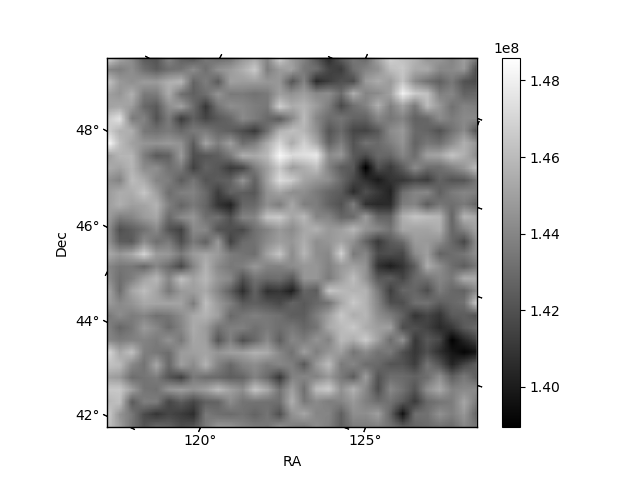
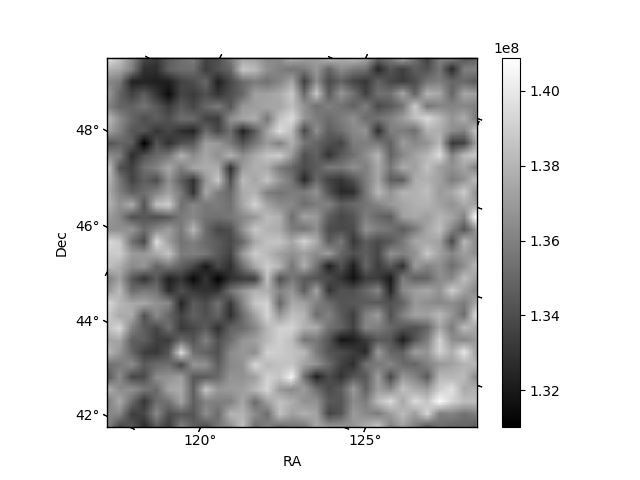
Histogram calculated using DETX and DETY for each event in the final _common_clean file
| Quadrant A | 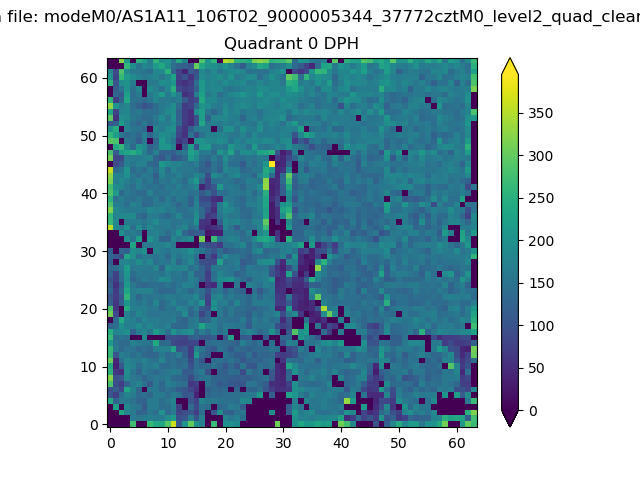 |
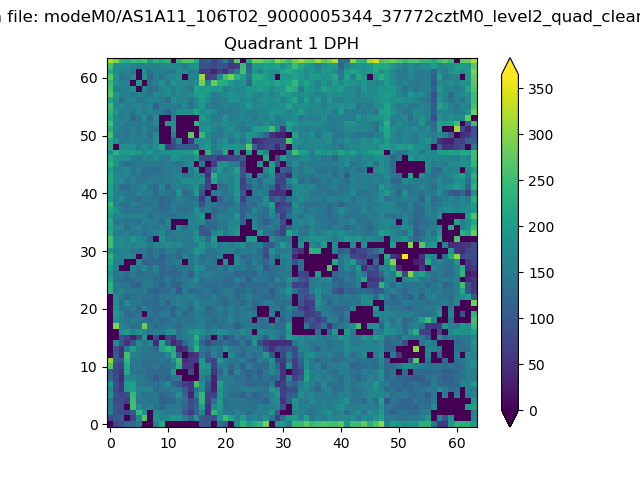 |
Quadrant B |
|---|---|---|---|
| Quadrant D | 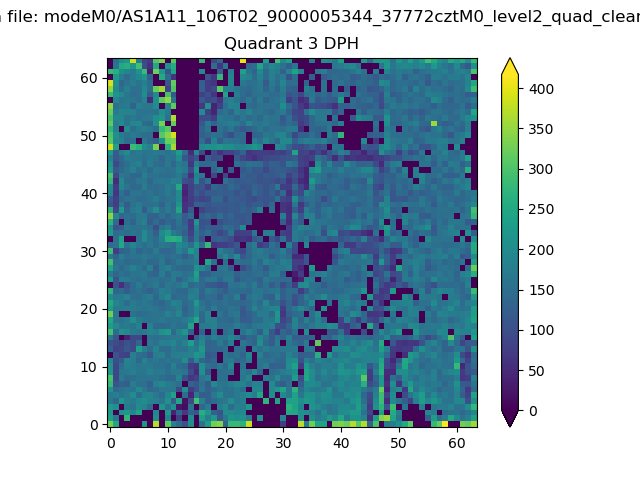 |
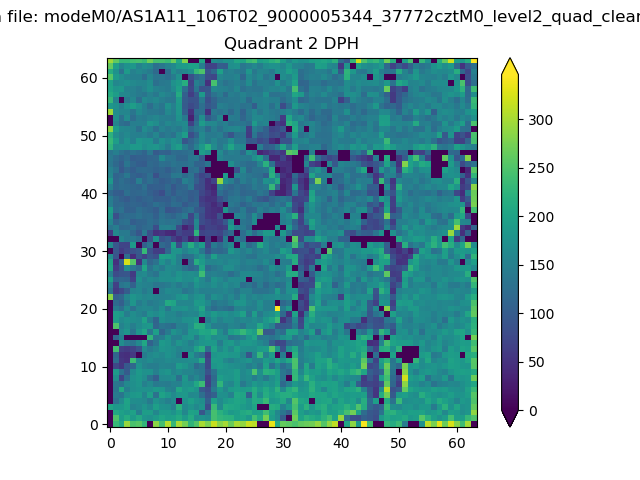 |
Quadrant C |
| Plot type | Count rate plots | Images |
|---|---|---|
| Comparison with Poisson distribution Blue bars denote a histogram of data divided into 1 sec bins. Red curve is a Poisson curve with rate = median count rate of data. |
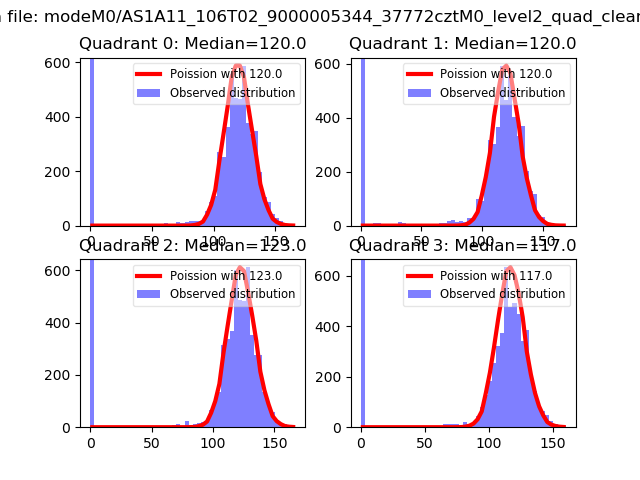 |
 |
| Quadrant-wise count rates Data is divided into 100 sec bins |
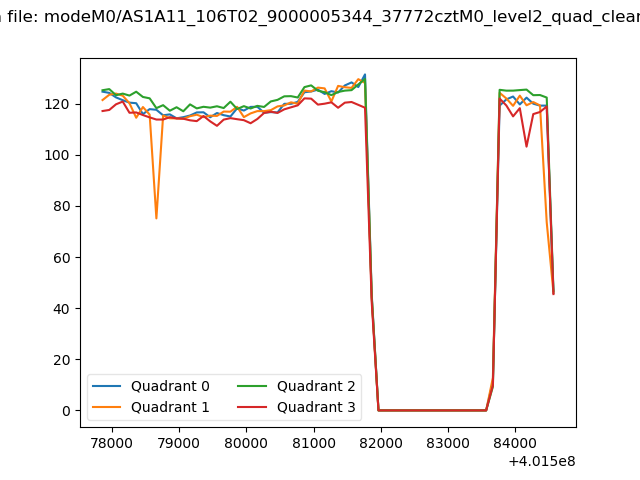 |
|
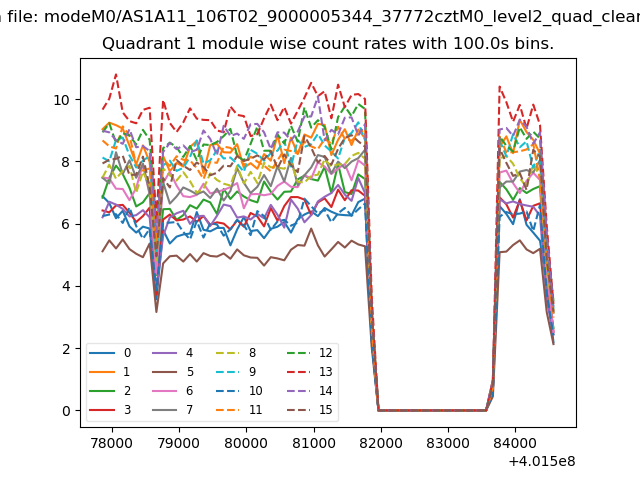
| Module-wise count rates for Quadrant A Data is divided into 100 sec bins |
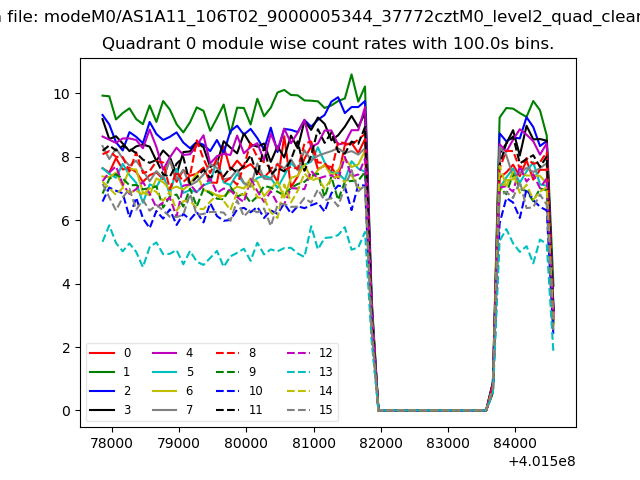 |
 |
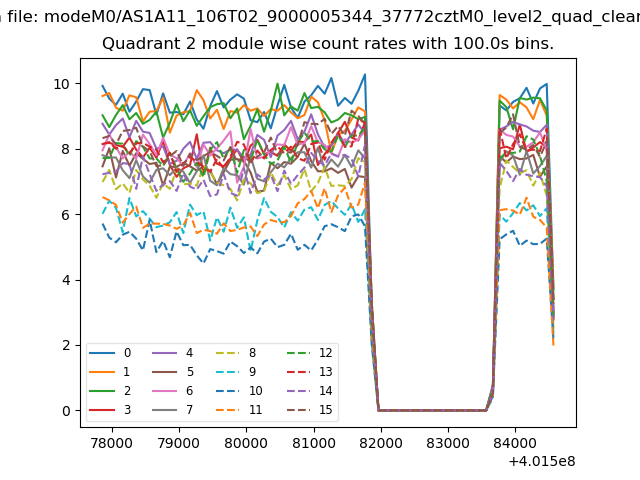
| Module-wise count rates for Quadrant B Data is divided into 100 sec bins |
 |
 |
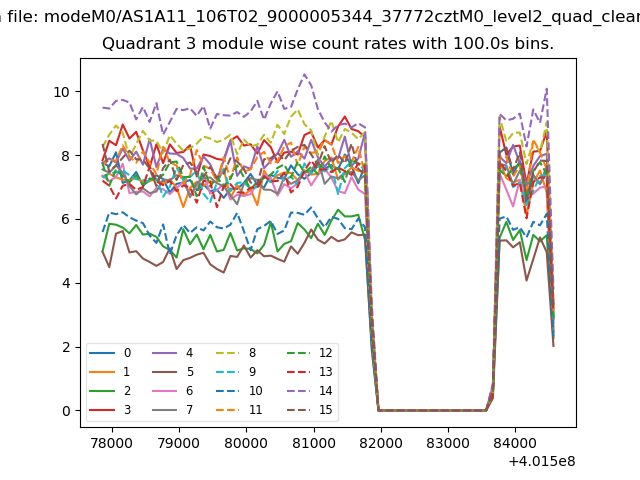
| Module-wise count rates for Quadrant C Data is divided into 100 sec bins |
 |
 |
| Module-wise count rates for Quadrant D Data is divided into 100 sec bins |
 |
 |
| Parameter | Plot |
|---|---|
| CZT HV Monitor | 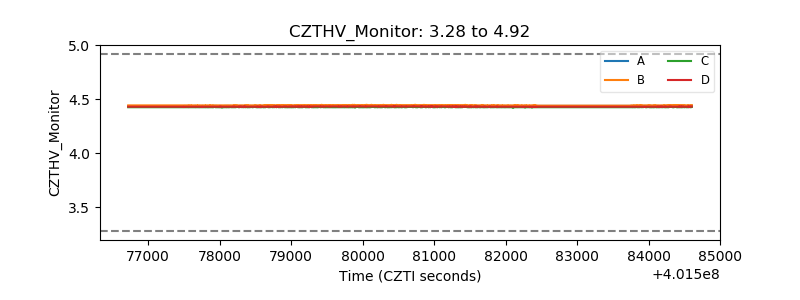 |
| D_VDD | 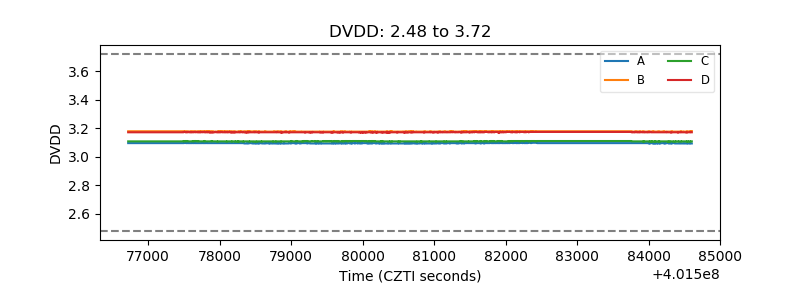 |
| Temperature 1 | 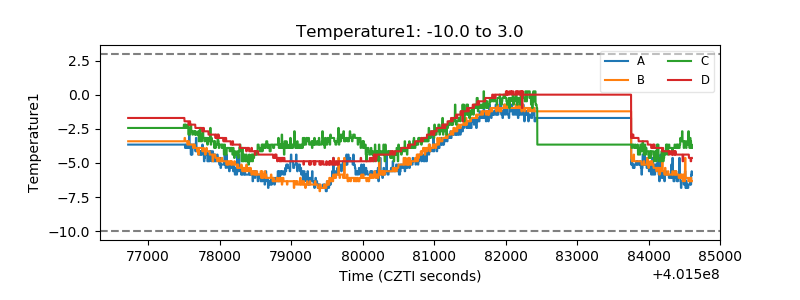 |
| Veto HV Monitor | 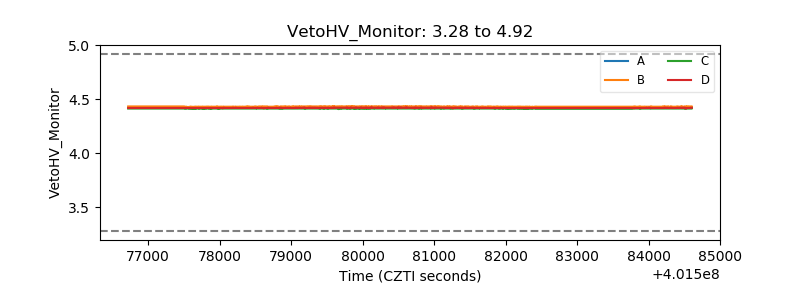 |
| Veto LLD | 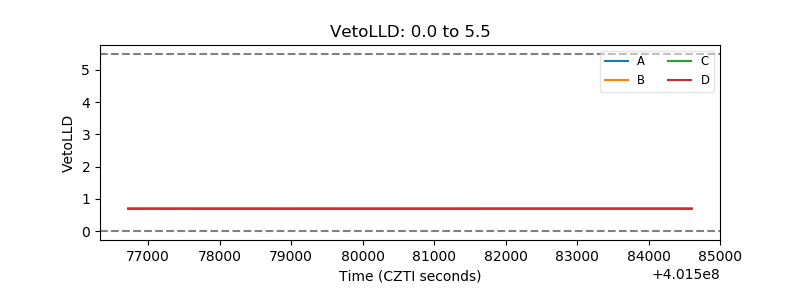 |
| Alpha Counter | 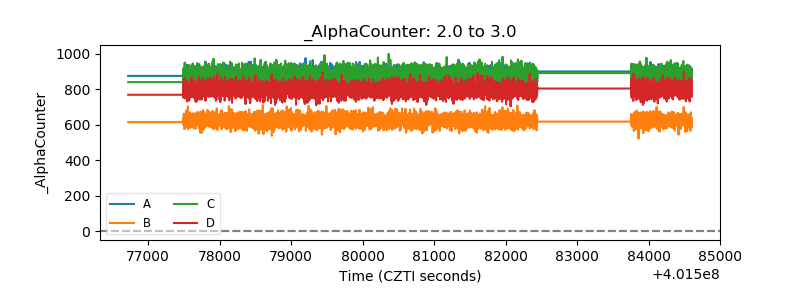 |
| _CPM_Rate | 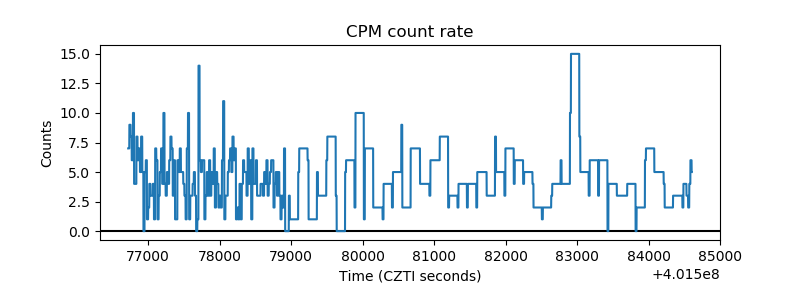 |
| CZT Counter | 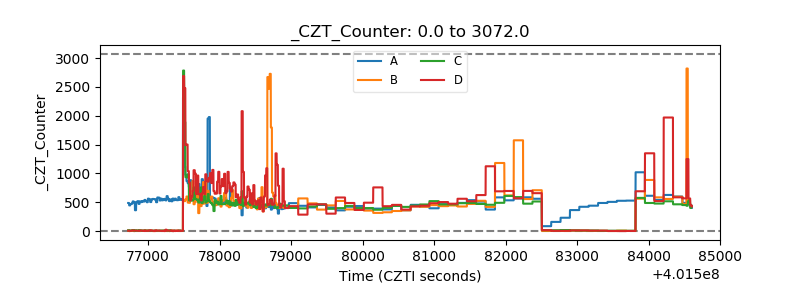 |
| +2.5 Volts monitor |  |
| +5 Volts monitor | 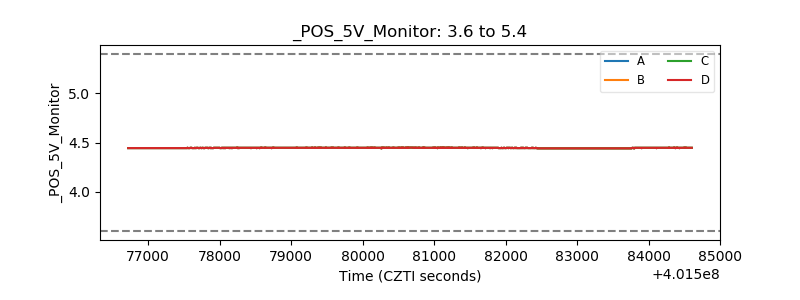 |
| _ROLL_ROT | 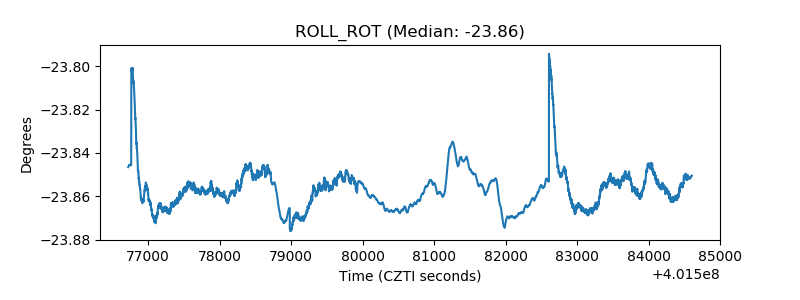 |
| _Roll_DEC | 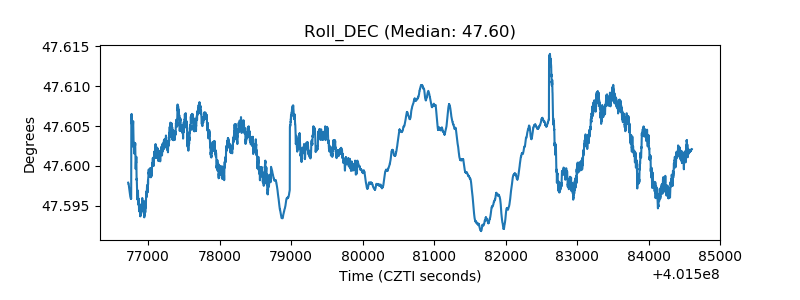 |
| _Roll_RA | 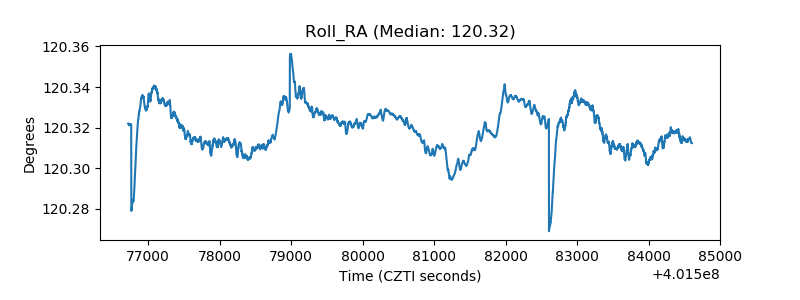 |
| Veto Counter | 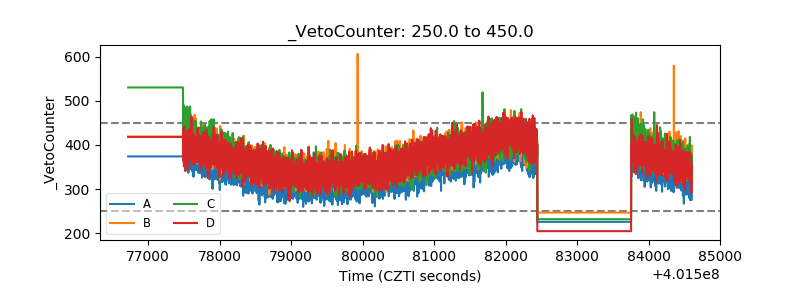 |