| Param | Original file | Final file |
|---|---|---|
| Filename | modeM0/AS1A11_106T02_9000005344_37775cztM0_level2.evt | modeM0/AS1A11_106T02_9000005344_37775cztM0_level2_quad_clean.evt |
| Size (bytes) | 1,176,664,320 | 215,536,320 |
| Size | 1.1 GB | 205.6 MB |
| Events in quadrant A | 7,826,742 | 1,361,439 |
| Events in quadrant B | 8,147,361 | 1,365,929 |
| Events in quadrant C | 7,536,795 | 1,392,174 |
| Events in quadrant D | 11,066,811 | 1,329,501 |
| Mode M9 | |||
|---|---|---|---|
| Quadrant | BADHDUFLAG | Total packets | Discarded packets |
| A | 0 | 52 | 0 |
| B | 0 | 52 | 0 |
| C | 0 | 52 | 0 |
| D | 0 | 53 | 0 |
| Mode SS | |||
|---|---|---|---|
| Quadrant | BADHDUFLAG | Total packets | Discarded packets |
| A | 0 | 318 | 0 |
| B | 0 | 318 | 0 |
| C | 0 | 318 | 0 |
| D | 0 | 318 | 0 |
| Mode M0 | |||
|---|---|---|---|
| Quadrant | BADHDUFLAG | Total packets | Discarded packets |
| A | 0 | 33506 | 5 |
| B | 0 | 35189 | 4 |
| C | 0 | 32575 | 4 |
| D | 0 | 44367 | 4 |
| Quadrant | Total seconds | Saturated seconds | Saturation percentage |
|---|---|---|---|
| A | 15647 | 58 | 0.370678% |
| B | 15647 | 228 | 1.457148% |
| C | 15647 | 57 | 0.364287% |
| D | 15647 | 1334 | 8.525596% |
Noise dominated data is calculated using 1-second bins in cleaned event files. If a bin has >2000 counts, and if more than 50% of those come from <1% of pixels, then it is considered to be noise-dominated and hence unusable.
| Quadrant | # 1 sec bins | Bins with >0 counts | Bins with >2000 counts | High rate bins dominated by noise | Noise dominated (total time) | Noise dominated (detector-on time) | Marked lightcurve |
|---|---|---|---|---|---|---|---|
| A | 19824 | 15650 | 35 | 35 | 0.18% | 0.22% | 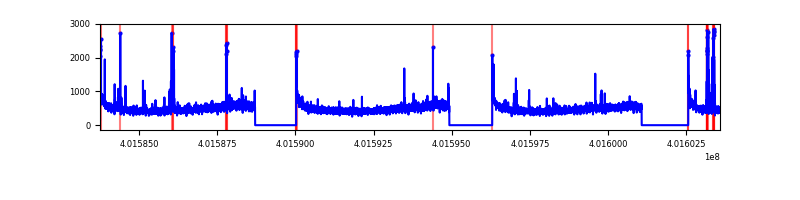 |
| B | 19824 | 15650 | 154 | 154 | 0.78% | 0.98% | 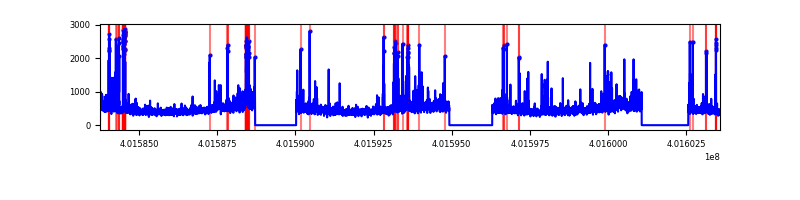 |
| C | 19824 | 15650 | 49 | 49 | 0.25% | 0.31% | 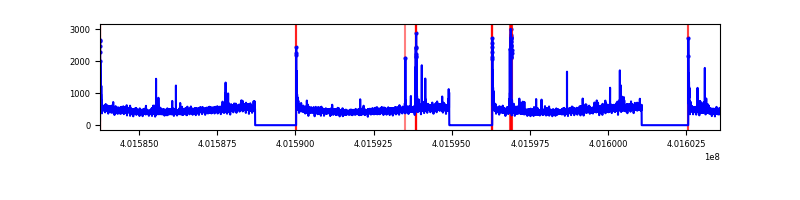 |
| D | 19824 | 15649 | 1106 | 1106 | 5.58% | 7.07% | 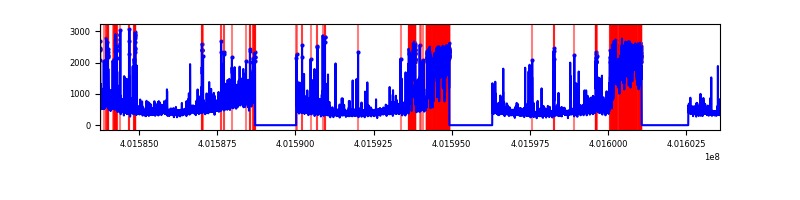 |
Top three noisy pixels from each quadrant. If the there are fewer than three noisy pixels in the level2.evt file, extra rows are filled as -1
| Pixel properties | Quadrant properties | ||||||
|---|---|---|---|---|---|---|---|
| Quadrant | DetID | PixID | Counts | Sigma | Mean | Median | Sigma |
| A | 10 | 83 | 861675 | 2490.55 | 1717 | 1681 | 345.3 |
| A | 9 | 143 | 224688 | 645.83 | 1717 | 1681 | 345.3 |
| A | 12 | 189 | 48374 | 135.22 | 1717 | 1681 | 345.3 |
| B | 5 | 172 | 284814 | 884.73 | 1694 | 1648 | 320.1 |
| B | 5 | 255 | 182729 | 565.77 | 1694 | 1648 | 320.1 |
| B | 4 | 81 | 181021 | 560.44 | 1694 | 1648 | 320.1 |
| C | 15 | 214 | 673041 | 1731.14 | 1674 | 1685 | 387.8 |
| C | 0 | 10 | 122366 | 311.18 | 1674 | 1685 | 387.8 |
| C | 0 | 207 | 119054 | 302.64 | 1674 | 1685 | 387.8 |
| D | 7 | 223 | 1420641 | 3617.37 | 1629 | 1585 | 392.3 |
| D | 10 | 1 | 1179264 | 3002.06 | 1629 | 1585 | 392.3 |
| D | 12 | 235 | 972590 | 2475.22 | 1629 | 1585 | 392.3 |
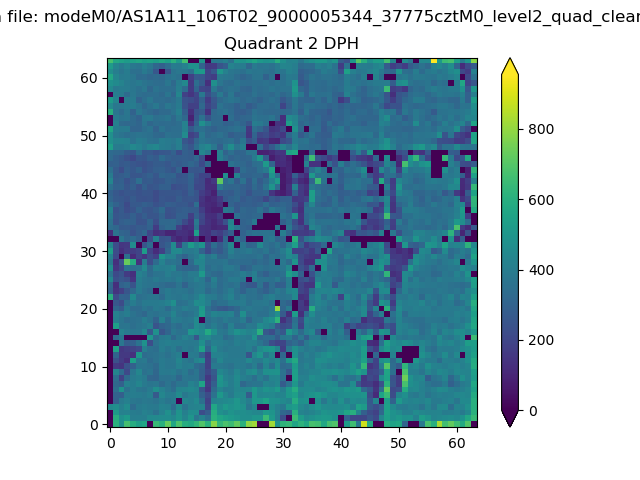
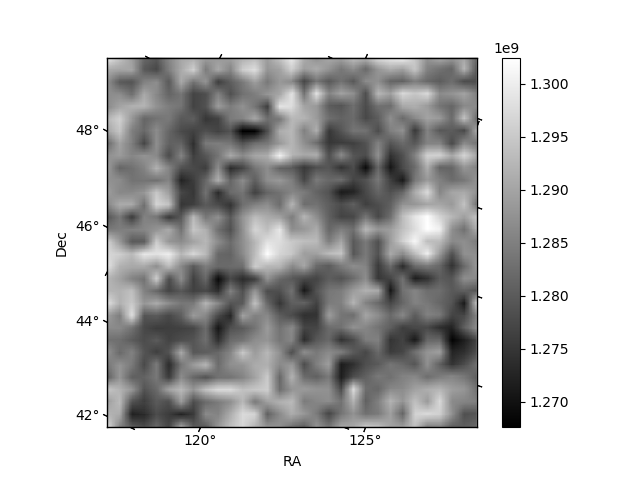
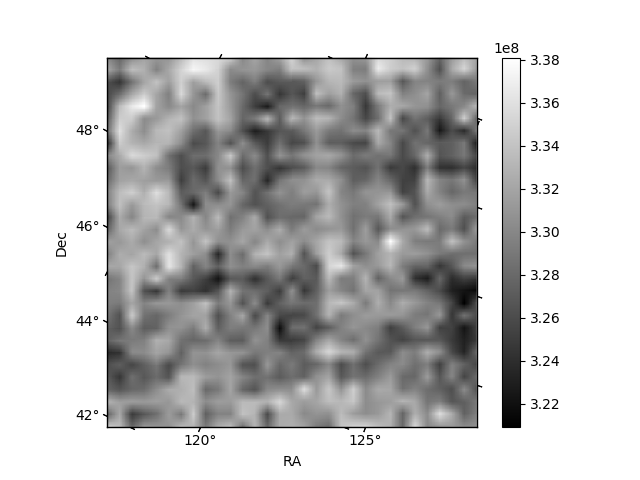
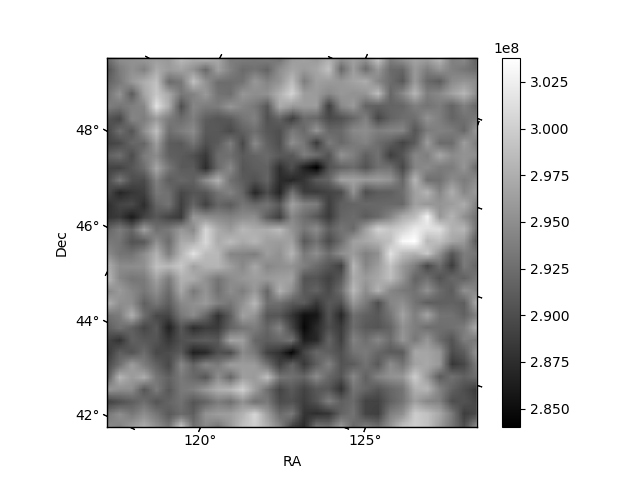
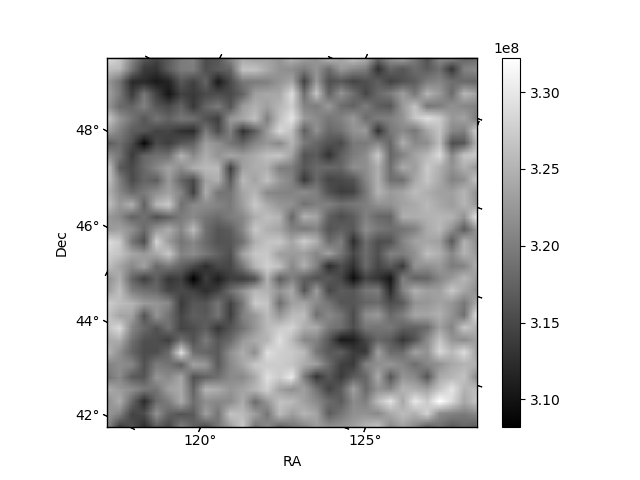
Histogram calculated using DETX and DETY for each event in the final _common_clean file
| Quadrant A | 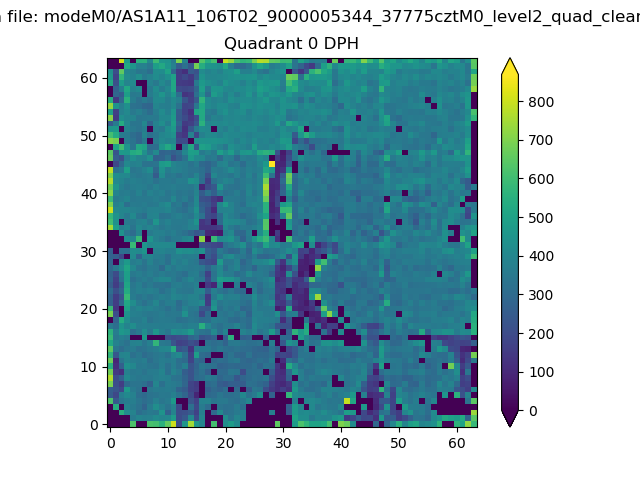 |
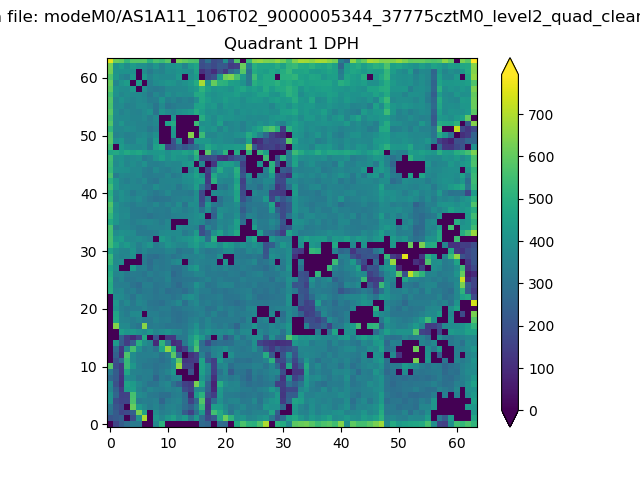 |
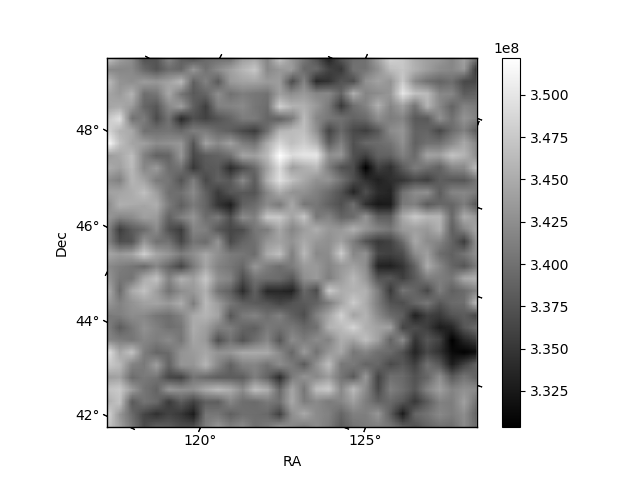
Quadrant B |
|---|---|---|---|
| Quadrant D | 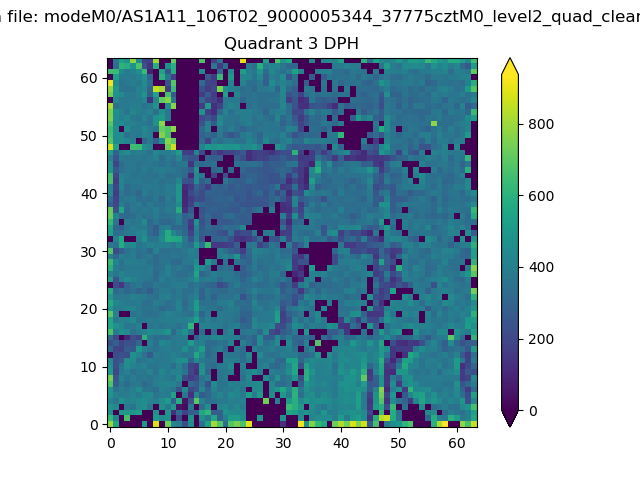 |
 |
Quadrant C |
| Plot type | Count rate plots | Images |
|---|---|---|
| Comparison with Poisson distribution Blue bars denote a histogram of data divided into 1 sec bins. Red curve is a Poisson curve with rate = median count rate of data. |
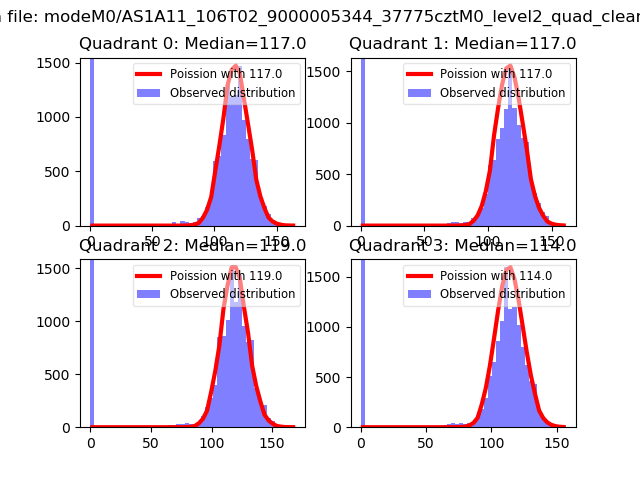 |
 |
| Quadrant-wise count rates Data is divided into 100 sec bins |
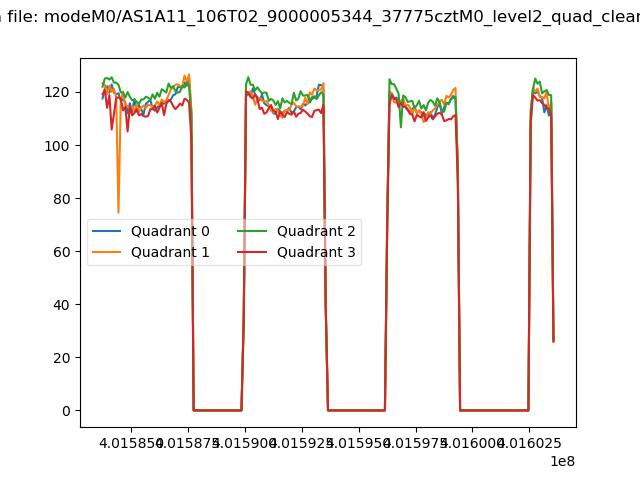 |
|
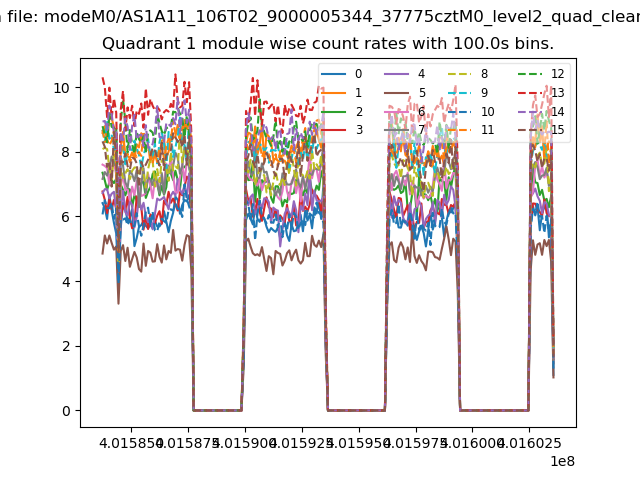
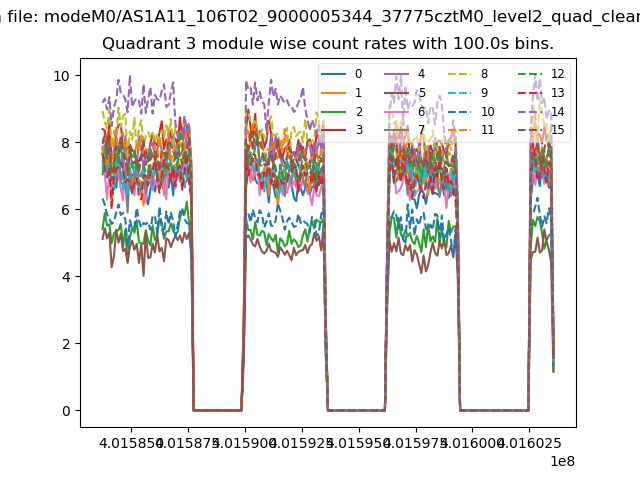
| Module-wise count rates for Quadrant A Data is divided into 100 sec bins |
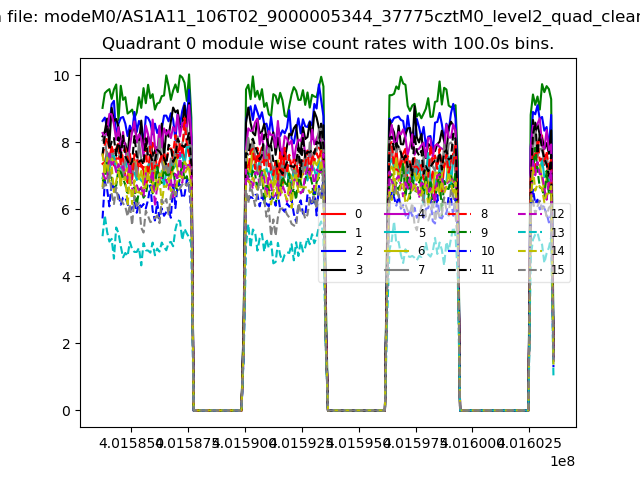 |
 |
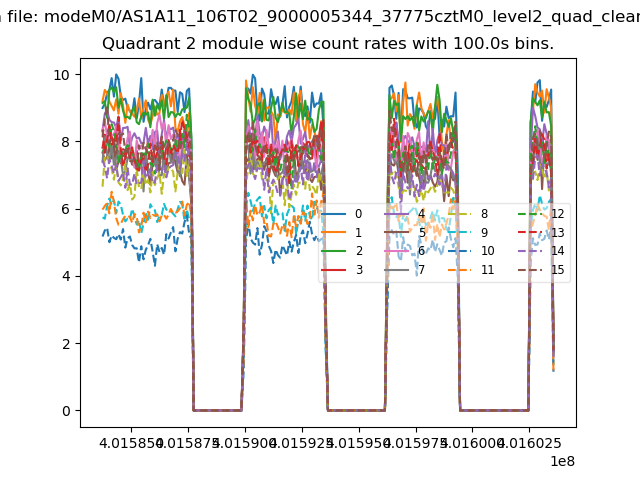
| Module-wise count rates for Quadrant B Data is divided into 100 sec bins |
 |
 |
| Module-wise count rates for Quadrant C Data is divided into 100 sec bins |
 |
 |
| Module-wise count rates for Quadrant D Data is divided into 100 sec bins |
 |
 |
| Parameter | Plot |
|---|---|
| CZT HV Monitor |  |
| D_VDD | 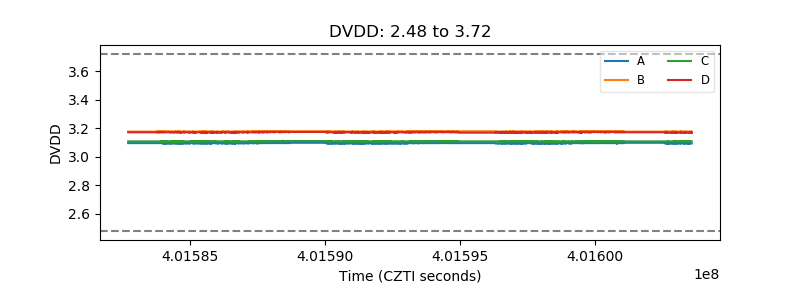 |
| Temperature 1 | 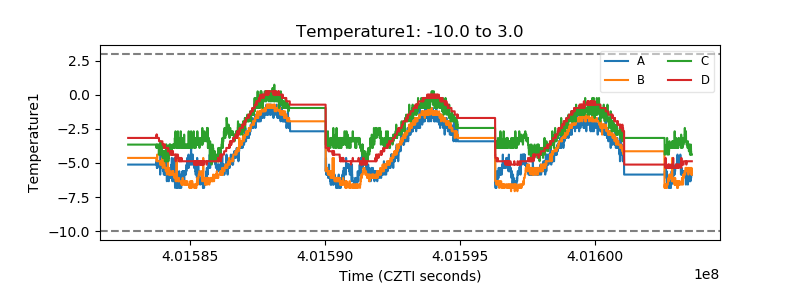 |
| Veto HV Monitor | 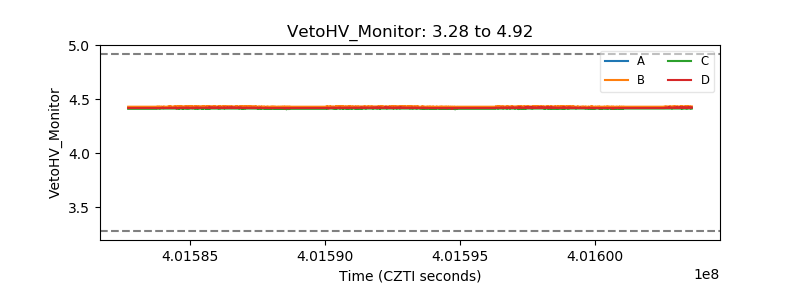 |
| Veto LLD | 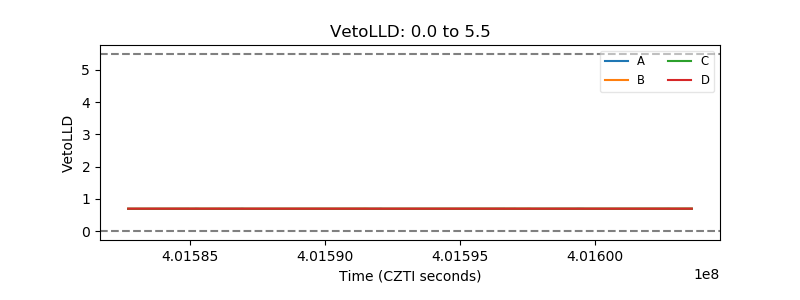 |
| Alpha Counter | 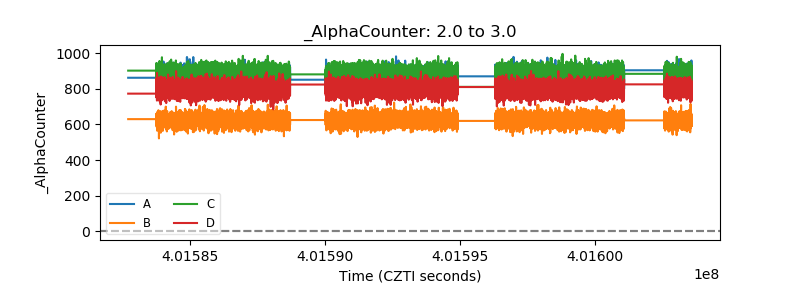 |
| _CPM_Rate | 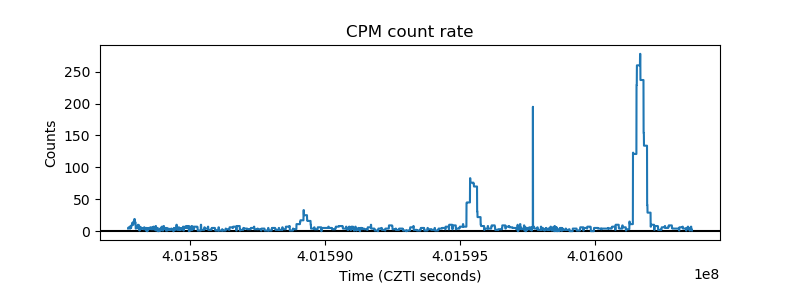 |
| CZT Counter | 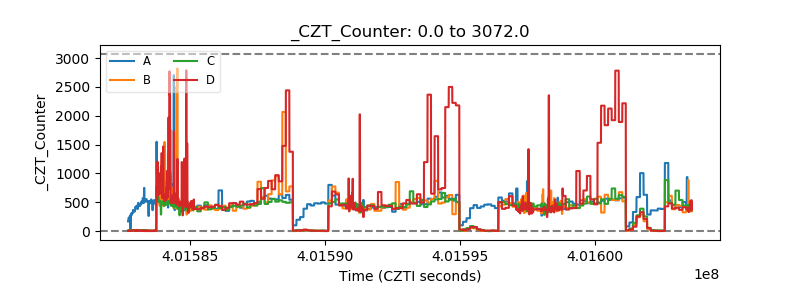 |
| +2.5 Volts monitor | 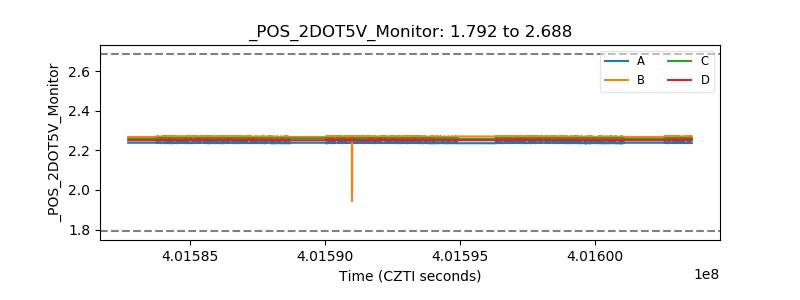 |
| +5 Volts monitor | 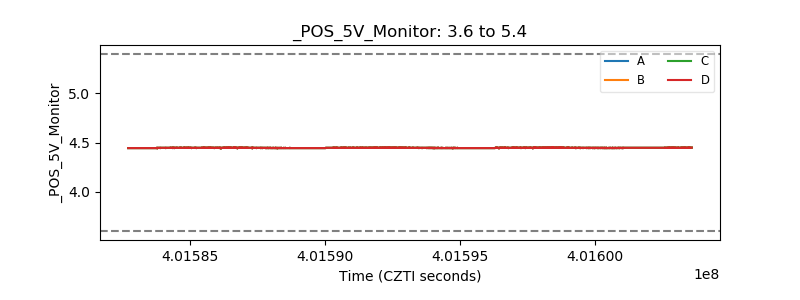 |
| _ROLL_ROT | 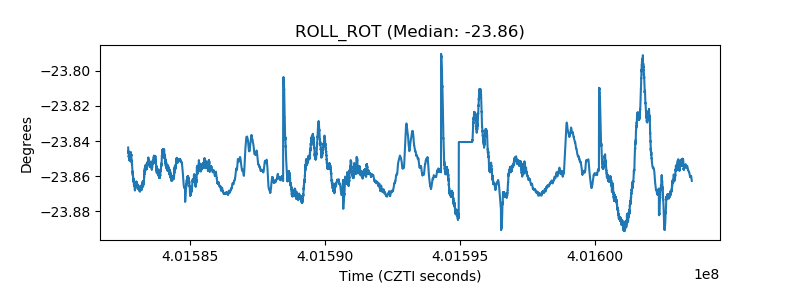 |
| _Roll_DEC | 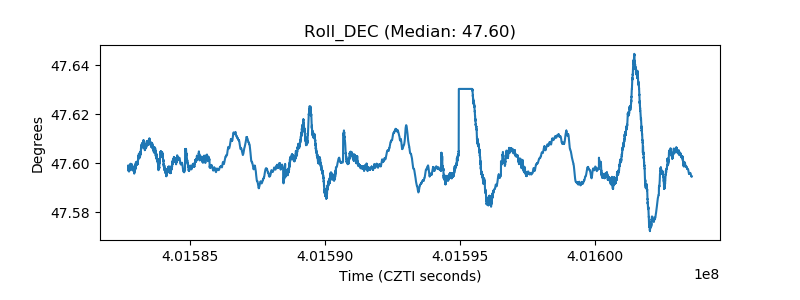 |
| _Roll_RA | 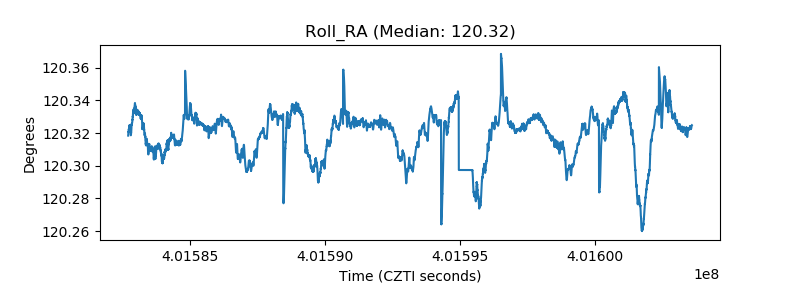 |
| Veto Counter | 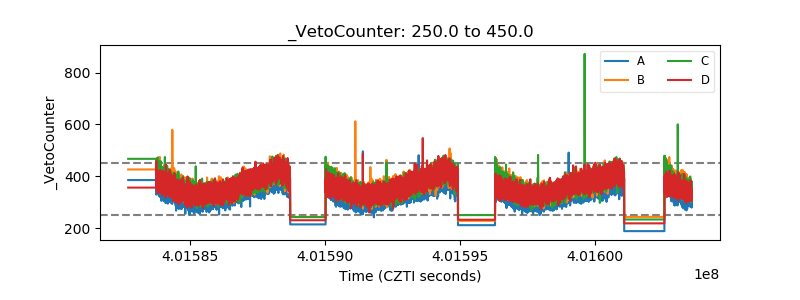 |