| Param | Original file | Final file |
|---|---|---|
| Filename | modeM0/AS1A11_106T02_9000005344_37776cztM0_level2.evt | modeM0/AS1A11_106T02_9000005344_37776cztM0_level2_quad_clean.evt |
| Size (bytes) | 380,799,360 | 70,787,520 |
| Size | 363.2 MB | 67.5 MB |
| Events in quadrant A | 2,804,090 | 438,817 |
| Events in quadrant B | 2,752,144 | 443,746 |
| Events in quadrant C | 2,671,784 | 445,919 |
| Events in quadrant D | 2,926,871 | 426,803 |
| Mode M9 | |||
|---|---|---|---|
| Quadrant | BADHDUFLAG | Total packets | Discarded packets |
| A | 0 | 16 | 0 |
| B | 0 | 16 | 0 |
| C | 0 | 16 | 0 |
| D | 0 | 16 | 0 |
| Mode SS | |||
|---|---|---|---|
| Quadrant | BADHDUFLAG | Total packets | Discarded packets |
| A | 0 | 114 | 0 |
| B | 0 | 114 | 0 |
| C | 0 | 114 | 0 |
| D | 0 | 114 | 0 |
| Mode M0 | |||
|---|---|---|---|
| Quadrant | BADHDUFLAG | Total packets | Discarded packets |
| A | 0 | 11802 | 2 |
| B | 0 | 11971 | 1 |
| C | 0 | 11424 | 1 |
| D | 0 | 12706 | 1 |
| Quadrant | Total seconds | Saturated seconds | Saturation percentage |
|---|---|---|---|
| A | 5543 | 32 | 0.577305% |
| B | 5543 | 26 | 0.469060% |
| C | 5543 | 9 | 0.162367% |
| D | 5543 | 74 | 1.335017% |
Noise dominated data is calculated using 1-second bins in cleaned event files. If a bin has >2000 counts, and if more than 50% of those come from <1% of pixels, then it is considered to be noise-dominated and hence unusable.
| Quadrant | # 1 sec bins | Bins with >0 counts | Bins with >2000 counts | High rate bins dominated by noise | Noise dominated (total time) | Noise dominated (detector-on time) | Marked lightcurve |
|---|---|---|---|---|---|---|---|
| A | 7157 | 5544 | 21 | 21 | 0.29% | 0.38% | 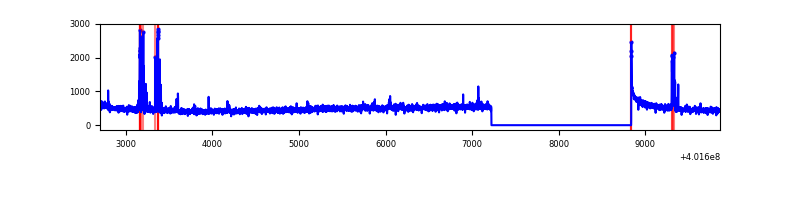 |
| B | 7157 | 5544 | 16 | 16 | 0.22% | 0.29% | 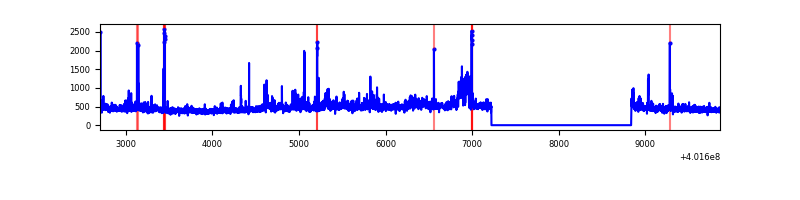 |
| C | 7157 | 5544 | 9 | 9 | 0.13% | 0.16% | 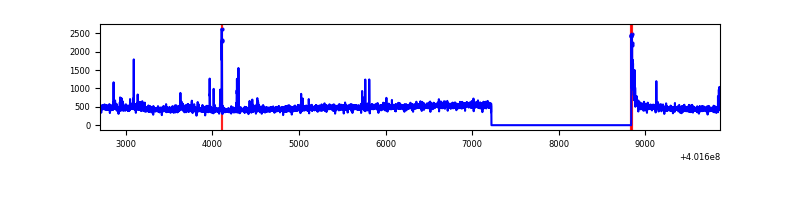 |
| D | 7157 | 5544 | 67 | 67 | 0.94% | 1.21% | 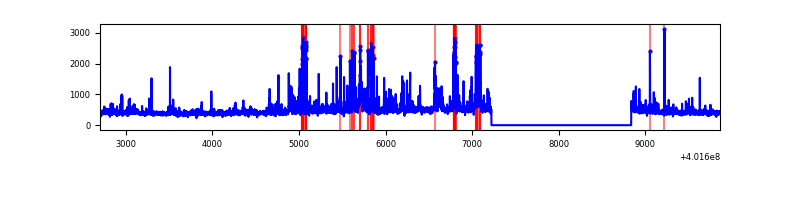 |
Top three noisy pixels from each quadrant. If the there are fewer than three noisy pixels in the level2.evt file, extra rows are filled as -1
| Pixel properties | Quadrant properties | ||||||
|---|---|---|---|---|---|---|---|
| Quadrant | DetID | PixID | Counts | Sigma | Mean | Median | Sigma |
| A | 10 | 83 | 299014 | 2453.68 | 606 | 595 | 121.6 |
| A | 9 | 143 | 71383 | 582.04 | 606 | 595 | 121.6 |
| A | 15 | 222 | 62247 | 506.92 | 606 | 595 | 121.6 |
| B | 0 | 189 | 145388 | 1259.02 | 600 | 584 | 115.0 |
| B | 5 | 255 | 96522 | 834.15 | 600 | 584 | 115.0 |
| B | 0 | 229 | 64817 | 558.48 | 600 | 584 | 115.0 |
| C | 15 | 214 | 255575 | 1856.21 | 588 | 591 | 137.4 |
| C | 0 | 10 | 43663 | 313.55 | 588 | 591 | 137.4 |
| C | 0 | 207 | 36420 | 260.82 | 588 | 591 | 137.4 |
| D | 2 | 249 | 115467 | 793.2 | 588 | 570 | 144.9 |
| D | 13 | 249 | 106380 | 730.47 | 588 | 570 | 144.9 |
| D | 10 | 199 | 87399 | 599.43 | 588 | 570 | 144.9 |
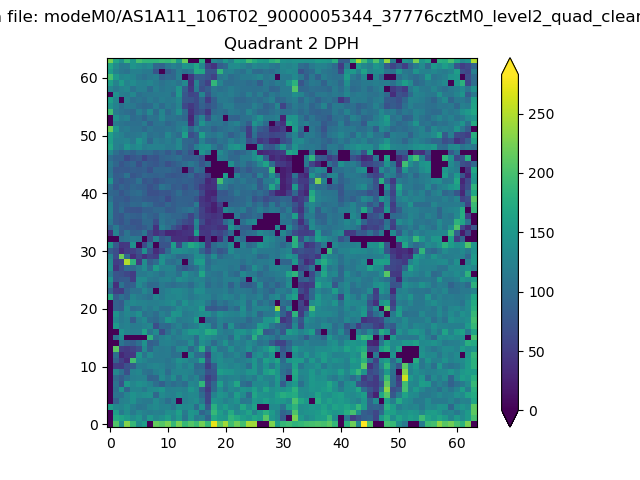
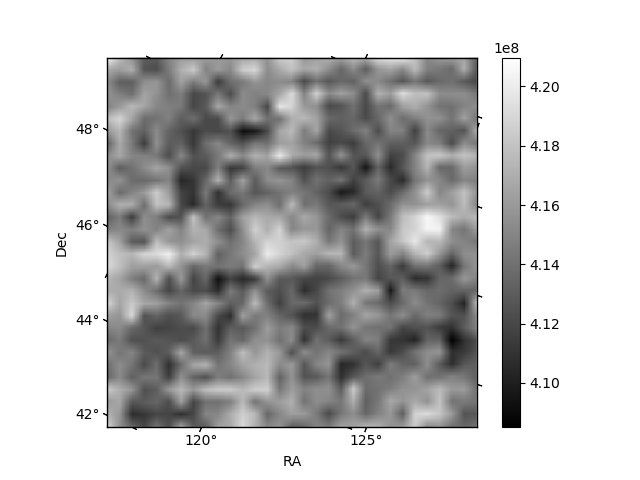
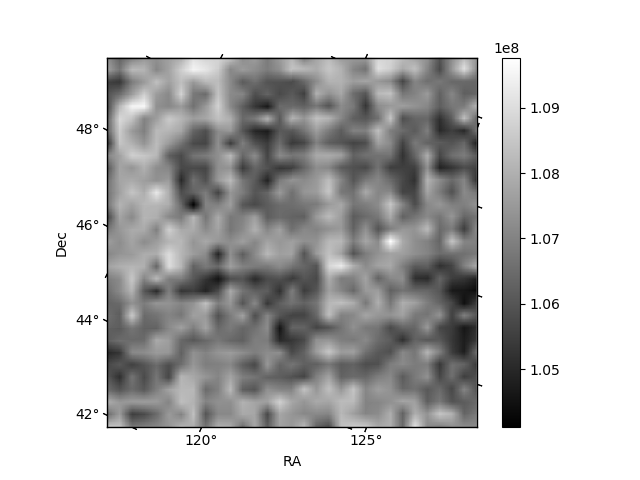
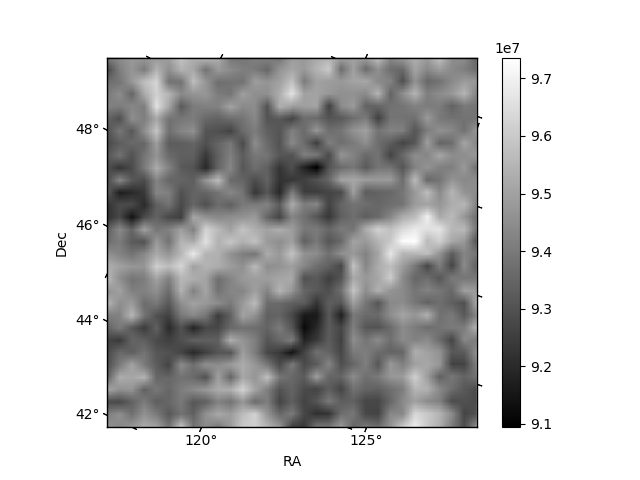
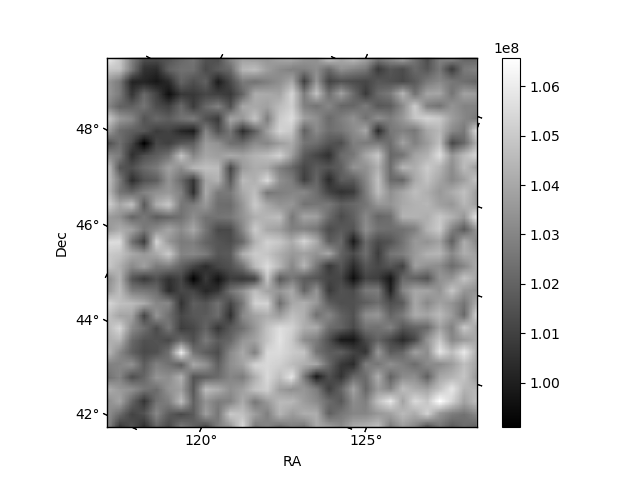
Histogram calculated using DETX and DETY for each event in the final _common_clean file
| Quadrant A | 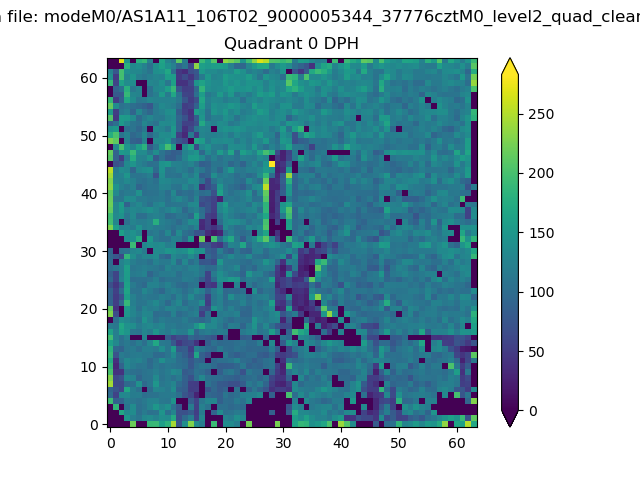 |
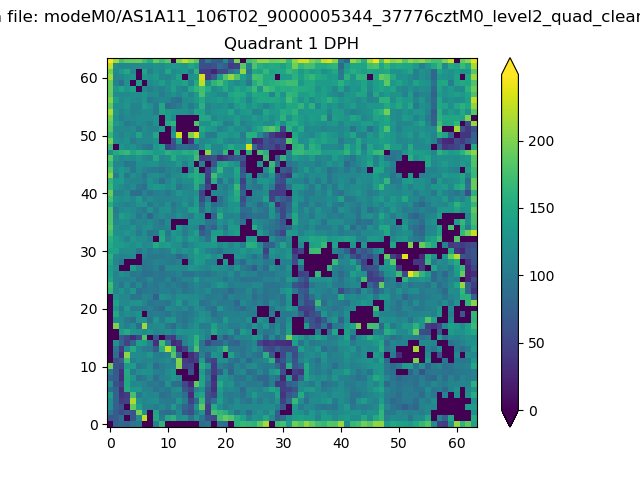 |
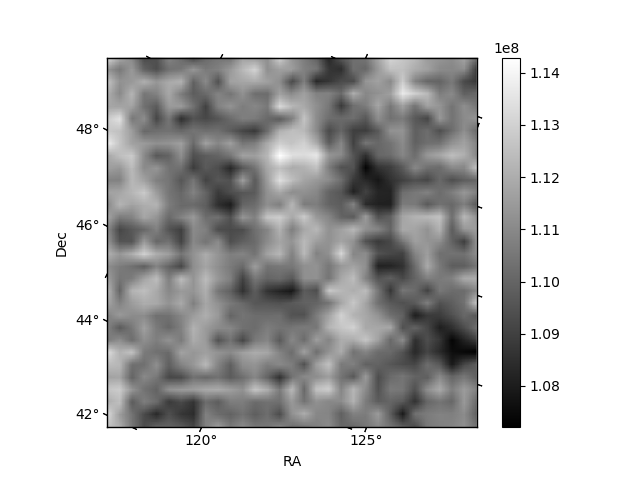
Quadrant B |
|---|---|---|---|
| Quadrant D | 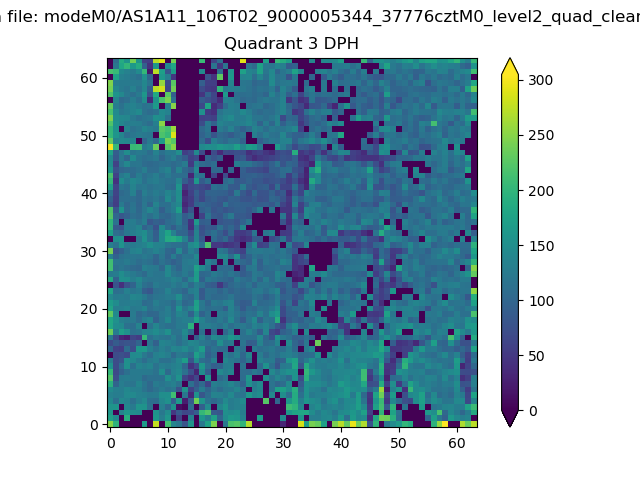 |
 |
Quadrant C |
| Plot type | Count rate plots | Images |
|---|---|---|
| Comparison with Poisson distribution Blue bars denote a histogram of data divided into 1 sec bins. Red curve is a Poisson curve with rate = median count rate of data. |
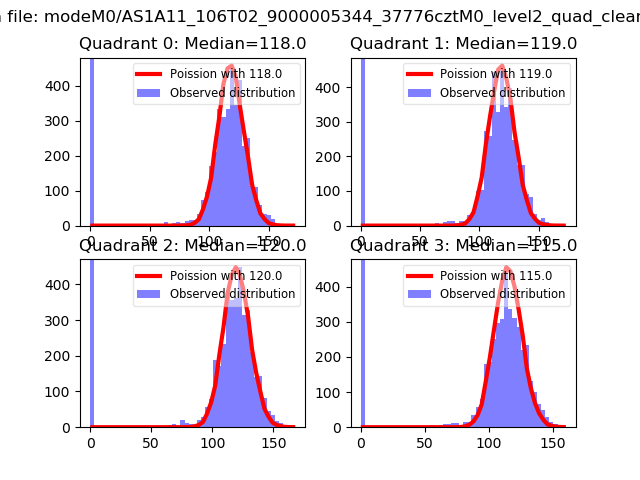 |
 |
| Quadrant-wise count rates Data is divided into 100 sec bins |
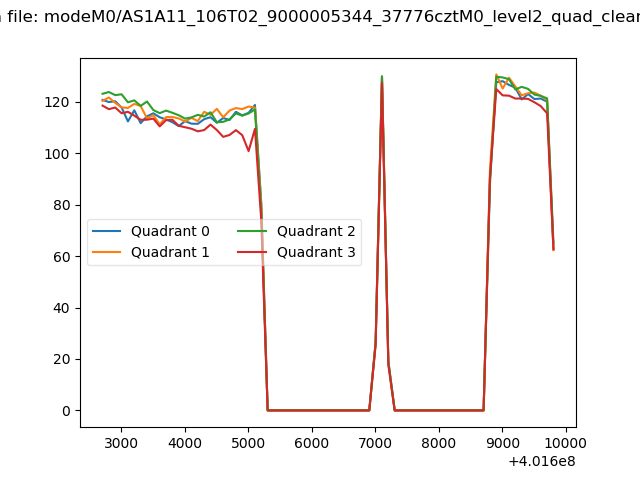 |
|
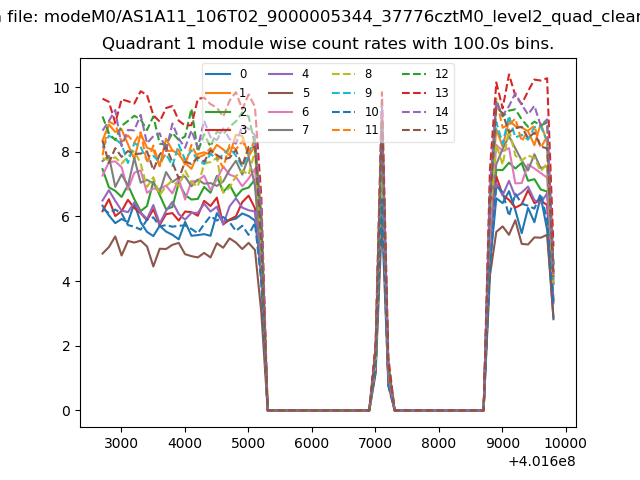
| Module-wise count rates for Quadrant A Data is divided into 100 sec bins |
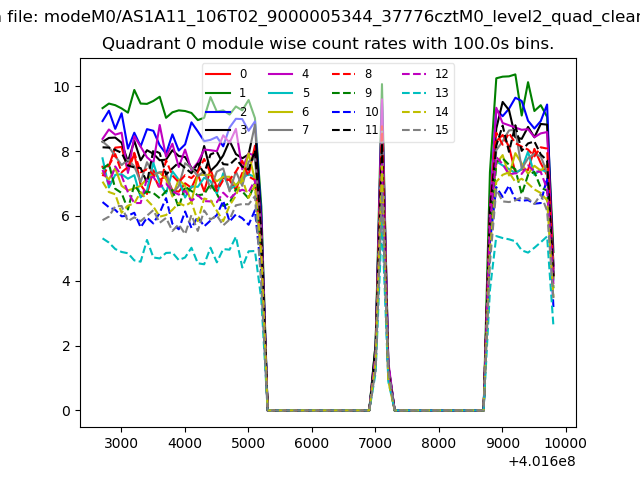 |
 |
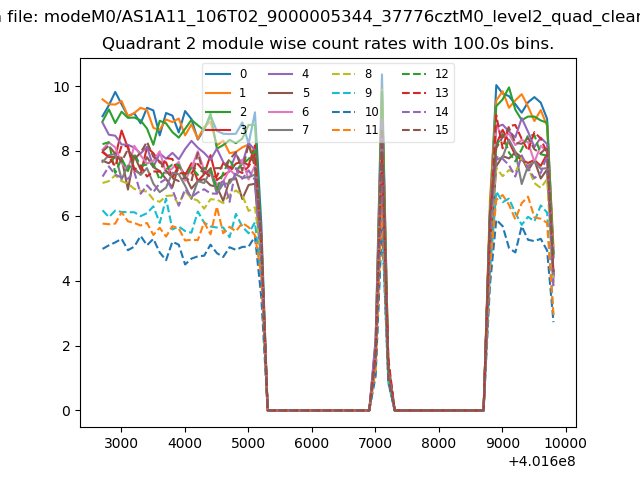
| Module-wise count rates for Quadrant B Data is divided into 100 sec bins |
 |
 |
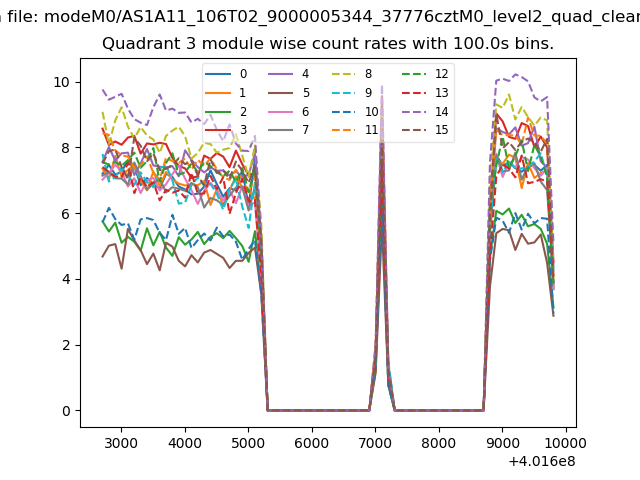
| Module-wise count rates for Quadrant C Data is divided into 100 sec bins |
 |
 |
| Module-wise count rates for Quadrant D Data is divided into 100 sec bins |
 |
 |
| Parameter | Plot |
|---|---|
| CZT HV Monitor | 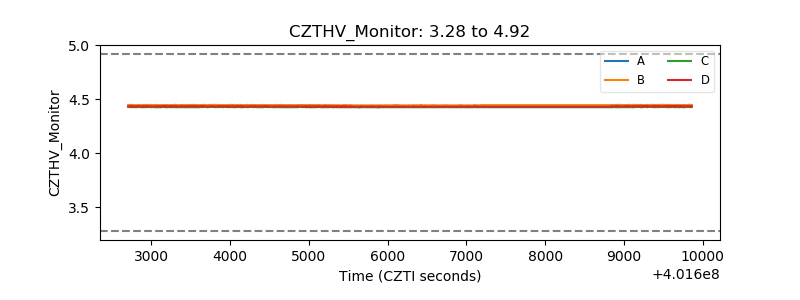 |
| D_VDD | 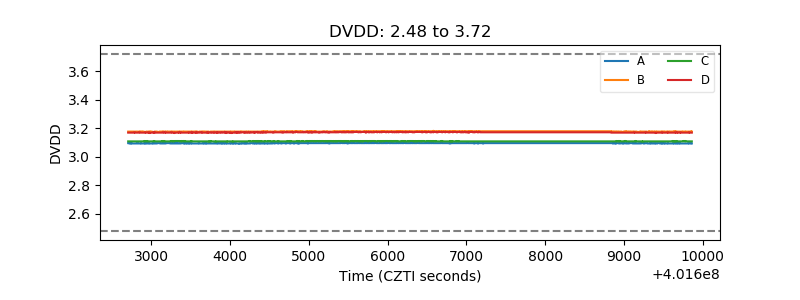 |
| Temperature 1 | 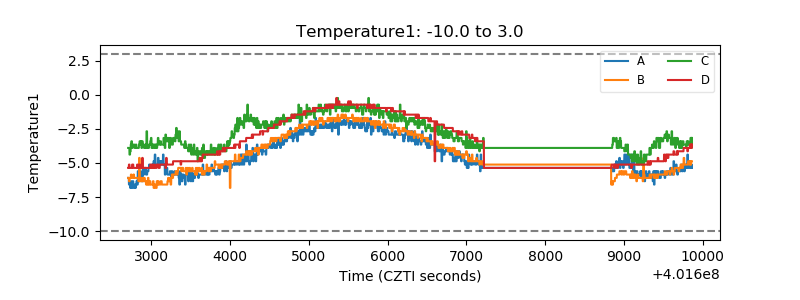 |
| Veto HV Monitor | 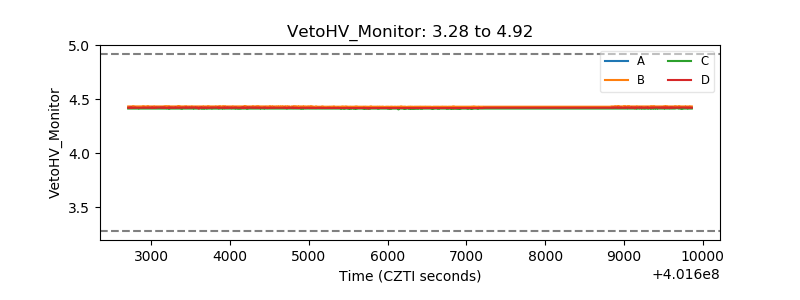 |
| Veto LLD | 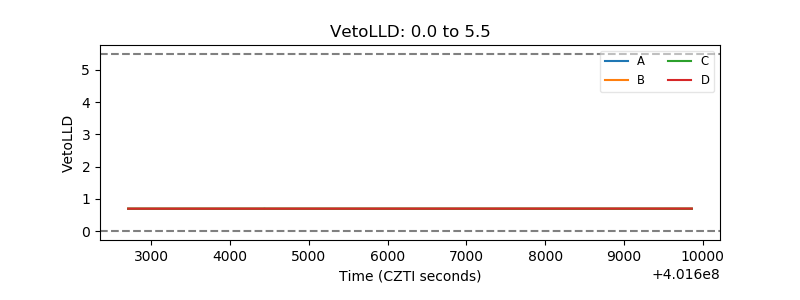 |
| Alpha Counter | 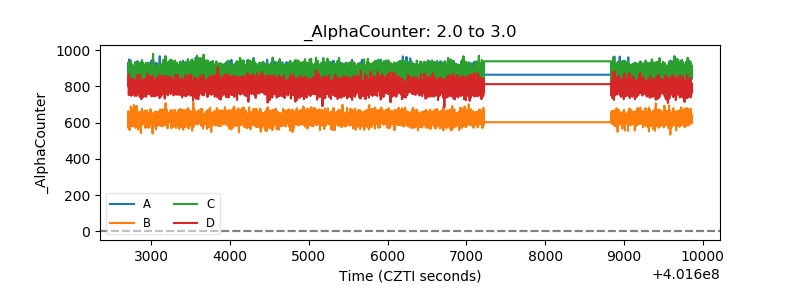 |
| _CPM_Rate | 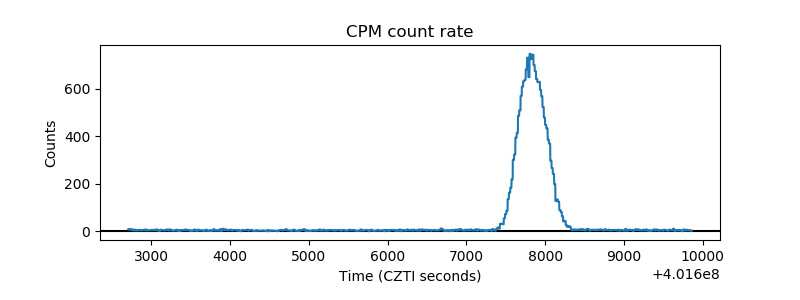 |
| CZT Counter | 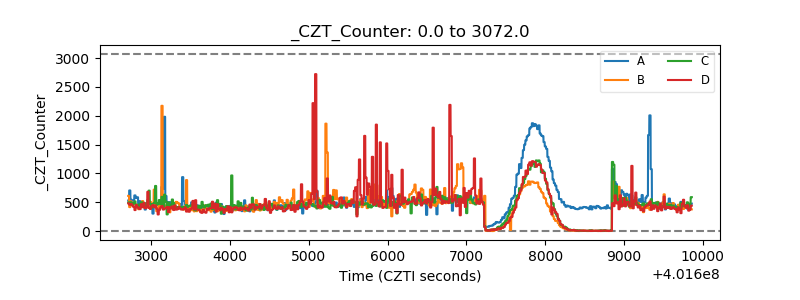 |
| +2.5 Volts monitor | 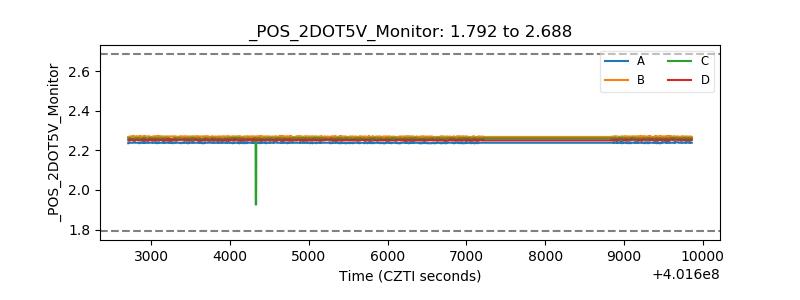 |
| +5 Volts monitor | 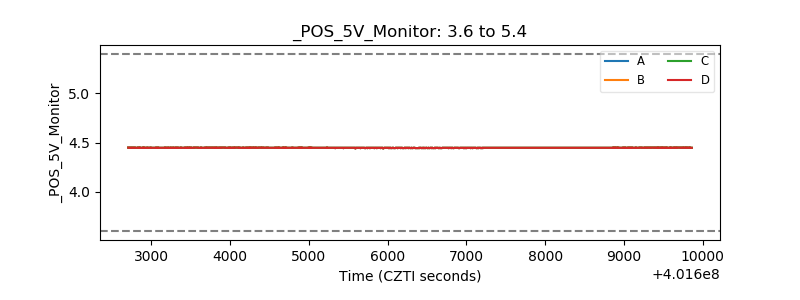 |
| _ROLL_ROT | 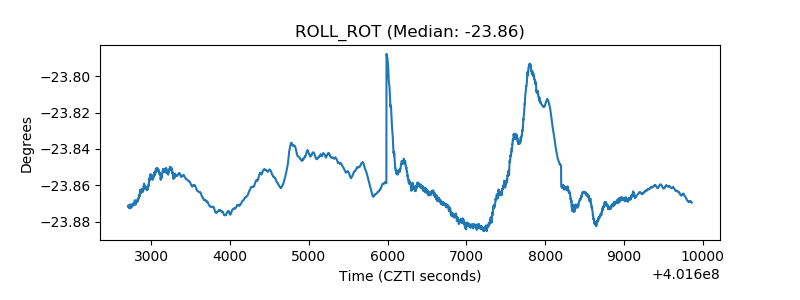 |
| _Roll_DEC | 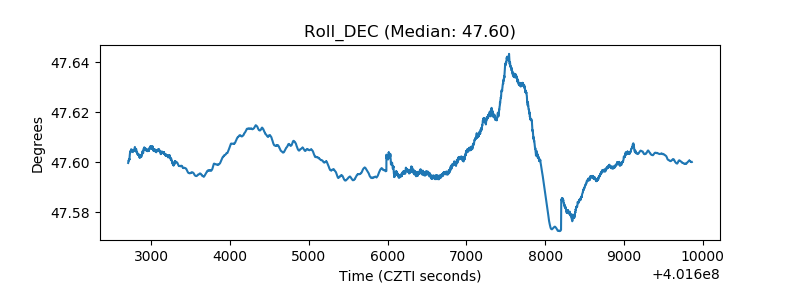 |
| _Roll_RA | 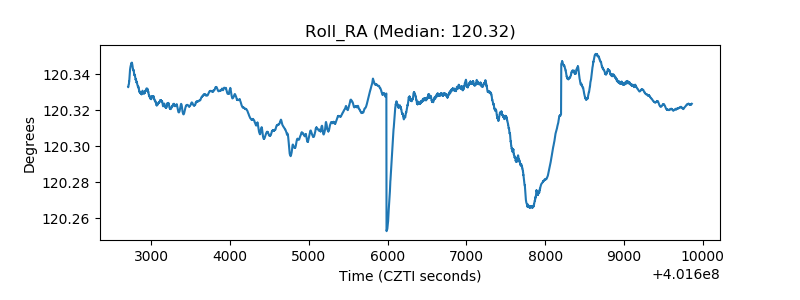 |
| Veto Counter | 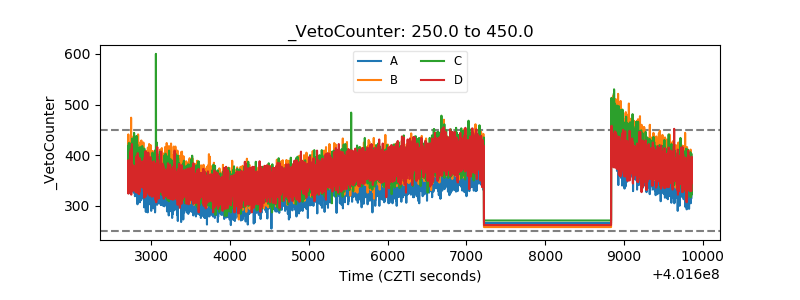 |