| Param | Original file | Final file |
|---|---|---|
| Filename | modeM0/AS1A11_106T02_9000005344_37778cztM0_level2.evt | modeM0/AS1A11_106T02_9000005344_37778cztM0_level2_quad_clean.evt |
| Size (bytes) | 405,676,800 | 71,426,880 |
| Size | 386.9 MB | 68.1 MB |
| Events in quadrant A | 2,822,189 | 448,405 |
| Events in quadrant B | 2,920,306 | 453,359 |
| Events in quadrant C | 2,668,951 | 451,931 |
| Events in quadrant D | 3,506,448 | 430,180 |
| Mode M9 | |||
|---|---|---|---|
| Quadrant | BADHDUFLAG | Total packets | Discarded packets |
| A | 0 | 18 | 0 |
| B | 0 | 18 | 0 |
| C | 0 | 18 | 0 |
| D | 0 | 19 | 0 |
| Mode SS | |||
|---|---|---|---|
| Quadrant | BADHDUFLAG | Total packets | Discarded packets |
| A | 0 | 110 | 0 |
| B | 0 | 110 | 0 |
| C | 0 | 110 | 0 |
| D | 0 | 110 | 0 |
| Mode M0 | |||
|---|---|---|---|
| Quadrant | BADHDUFLAG | Total packets | Discarded packets |
| A | 0 | 11687 | 3 |
| B | 0 | 12260 | 2 |
| C | 0 | 11257 | 2 |
| D | 0 | 14242 | 2 |
| Quadrant | Total seconds | Saturated seconds | Saturation percentage |
|---|---|---|---|
| A | 5414 | 15 | 0.277059% |
| B | 5414 | 62 | 1.145179% |
| C | 5414 | 18 | 0.332471% |
| D | 5414 | 220 | 4.063539% |
Noise dominated data is calculated using 1-second bins in cleaned event files. If a bin has >2000 counts, and if more than 50% of those come from <1% of pixels, then it is considered to be noise-dominated and hence unusable.
| Quadrant | # 1 sec bins | Bins with >0 counts | Bins with >2000 counts | High rate bins dominated by noise | Noise dominated (total time) | Noise dominated (detector-on time) | Marked lightcurve |
|---|---|---|---|---|---|---|---|
| A | 7147 | 5415 | 8 | 8 | 0.11% | 0.15% | 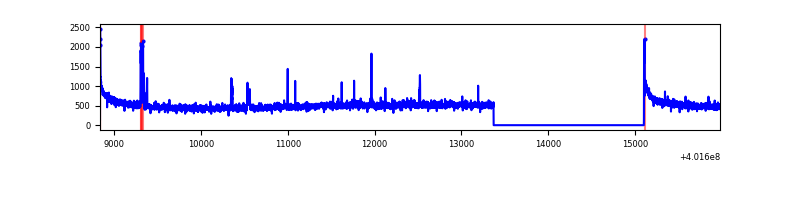 |
| B | 7147 | 5415 | 46 | 46 | 0.64% | 0.85% | 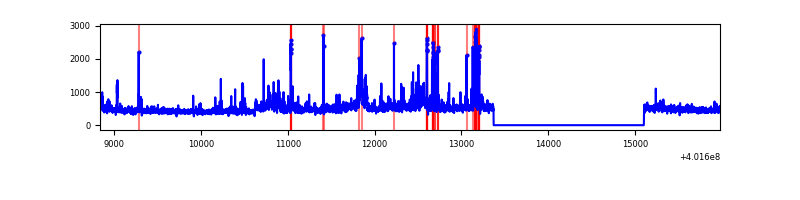 |
| C | 7147 | 5415 | 21 | 21 | 0.29% | 0.39% | 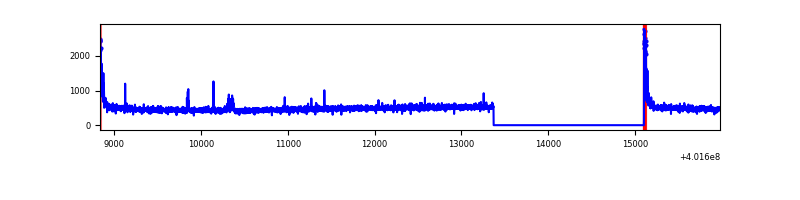 |
| D | 7147 | 5415 | 193 | 193 | 2.70% | 3.56% | 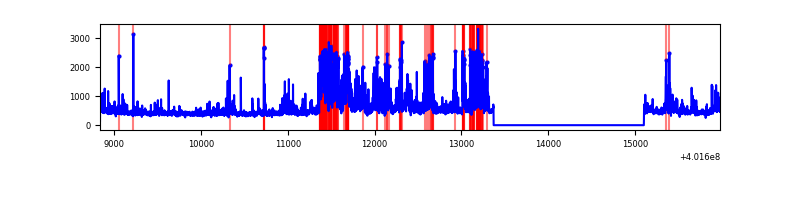 |
Top three noisy pixels from each quadrant. If the there are fewer than three noisy pixels in the level2.evt file, extra rows are filled as -1
| Pixel properties | Quadrant properties | ||||||
|---|---|---|---|---|---|---|---|
| Quadrant | DetID | PixID | Counts | Sigma | Mean | Median | Sigma |
| A | 10 | 83 | 334659 | 2737.66 | 609 | 596 | 122.0 |
| A | 15 | 222 | 82973 | 675.08 | 609 | 596 | 122.0 |
| A | 13 | 6 | 24639 | 197.03 | 609 | 596 | 122.0 |
| B | 5 | 255 | 158142 | 1387.21 | 599 | 583 | 113.6 |
| B | 5 | 172 | 151653 | 1330.08 | 599 | 583 | 113.6 |
| B | 0 | 189 | 96674 | 846.02 | 599 | 583 | 113.6 |
| C | 15 | 214 | 248325 | 1825.78 | 587 | 590 | 135.7 |
| C | 0 | 10 | 98995 | 725.23 | 587 | 590 | 135.7 |
| C | 15 | 159 | 19244 | 137.48 | 587 | 590 | 135.7 |
| D | 2 | 249 | 778834 | 5477.01 | 582 | 566 | 142.1 |
| D | 2 | 250 | 132507 | 928.53 | 582 | 566 | 142.1 |
| D | 13 | 249 | 118379 | 829.1 | 582 | 566 | 142.1 |
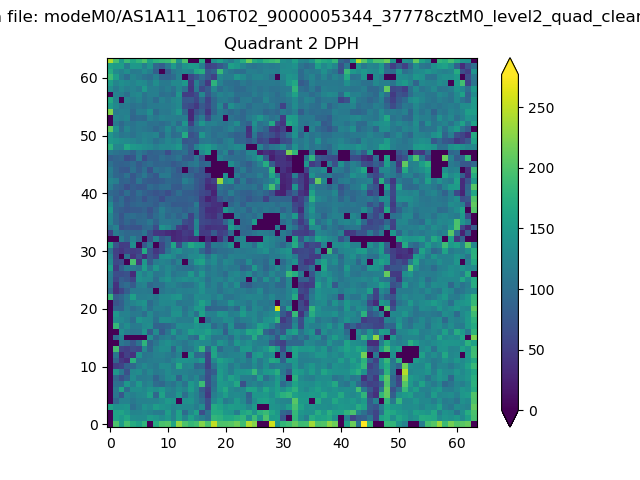
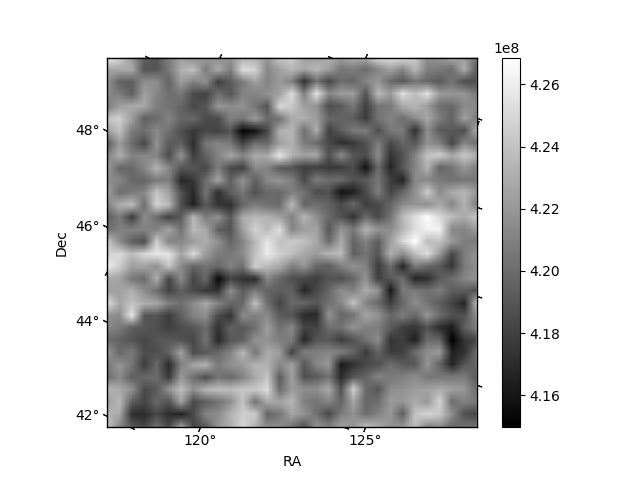
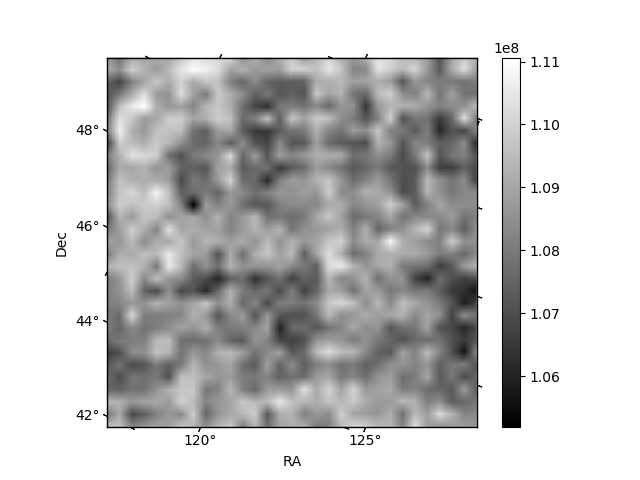
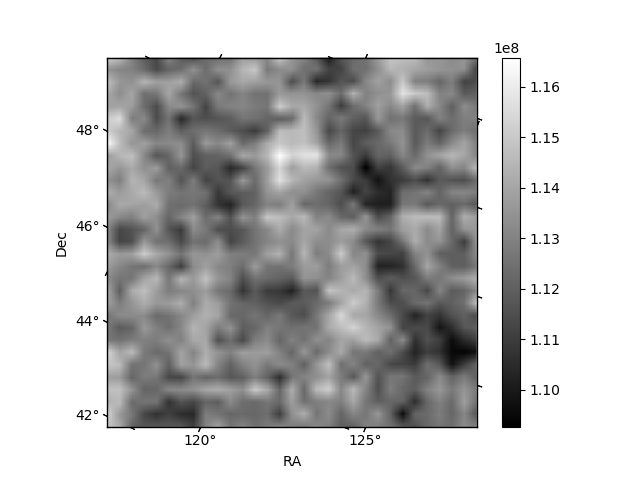
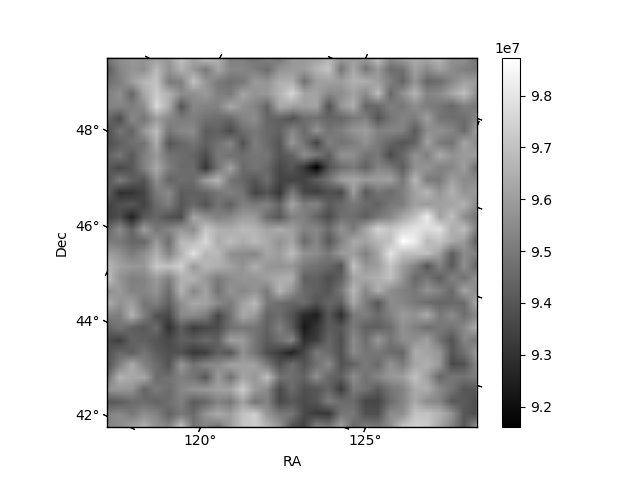
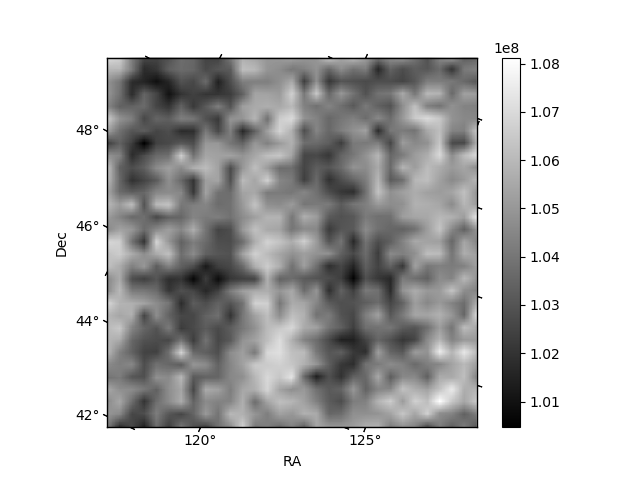
Histogram calculated using DETX and DETY for each event in the final _common_clean file
| Quadrant A | 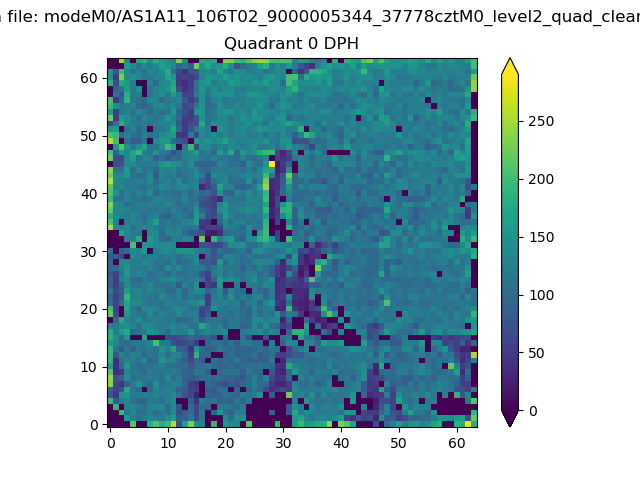 |
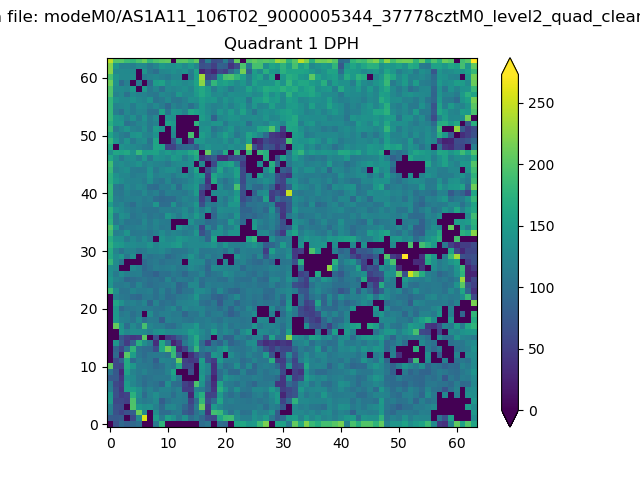 |
Quadrant B |
|---|---|---|---|
| Quadrant D | 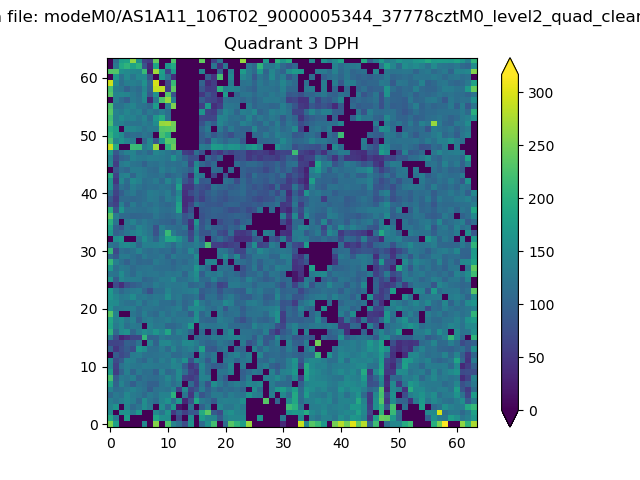 |
 |
Quadrant C |
| Plot type | Count rate plots | Images |
|---|---|---|
| Comparison with Poisson distribution Blue bars denote a histogram of data divided into 1 sec bins. Red curve is a Poisson curve with rate = median count rate of data. |
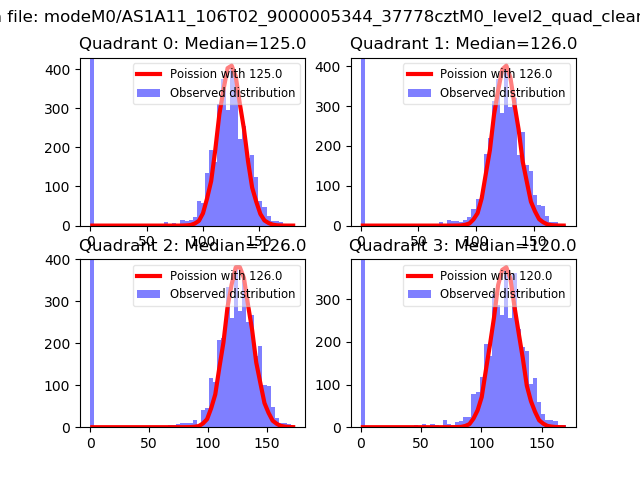 |
 |
| Quadrant-wise count rates Data is divided into 100 sec bins |
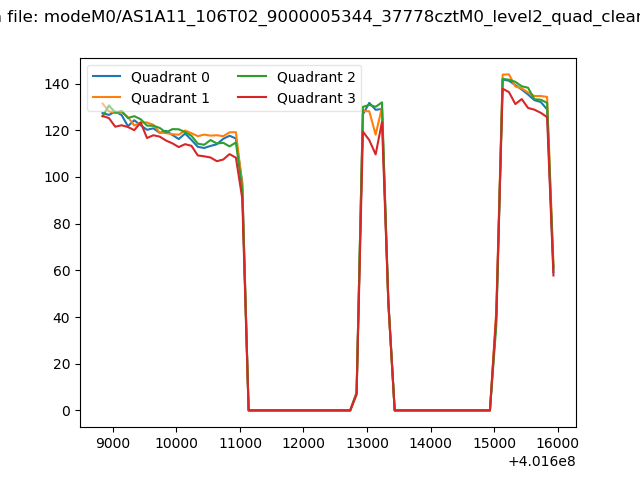 |
|
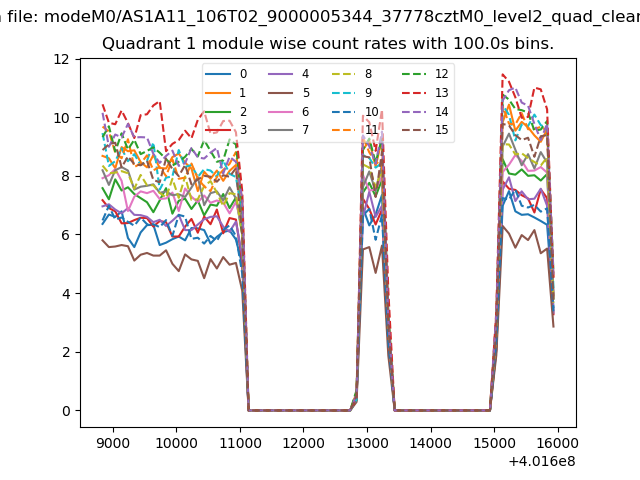
| Module-wise count rates for Quadrant A Data is divided into 100 sec bins |
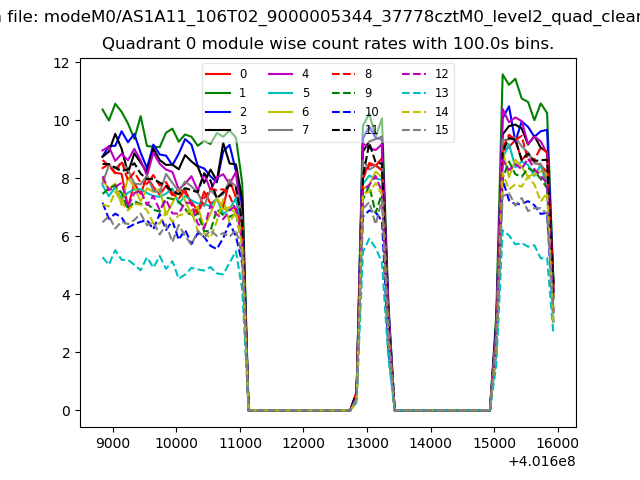 |
 |
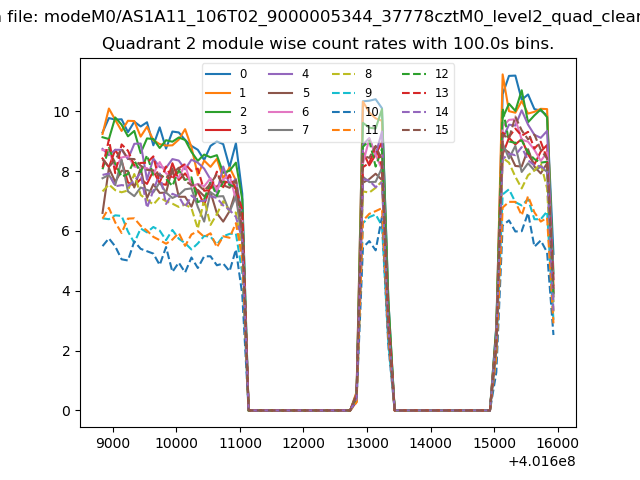
| Module-wise count rates for Quadrant B Data is divided into 100 sec bins |
 |
 |
| Module-wise count rates for Quadrant C Data is divided into 100 sec bins |
 |
 |
| Module-wise count rates for Quadrant D Data is divided into 100 sec bins |
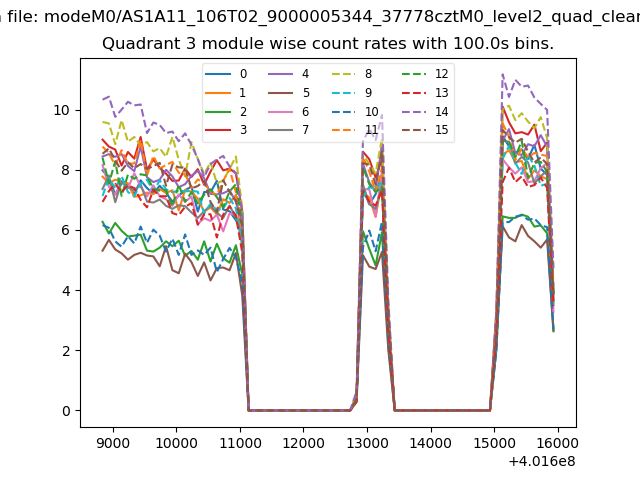 |
 |
| Parameter | Plot |
|---|---|
| CZT HV Monitor | 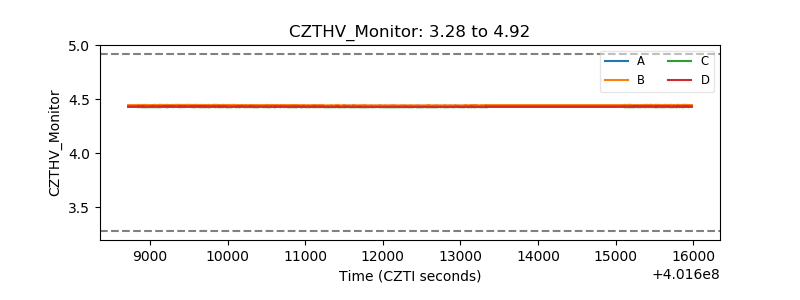 |
| D_VDD |  |
| Temperature 1 | 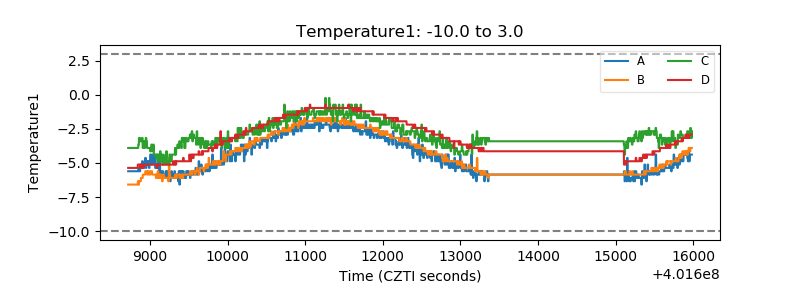 |
| Veto HV Monitor | 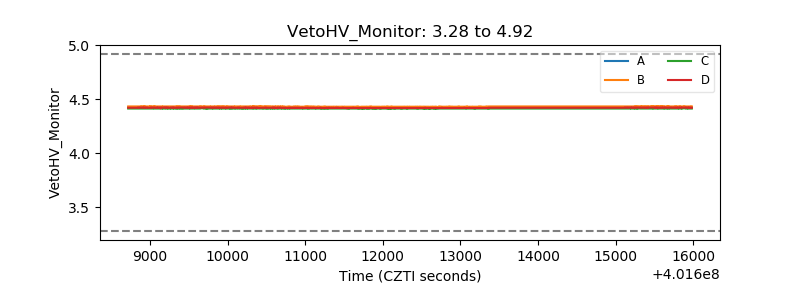 |
| Veto LLD | 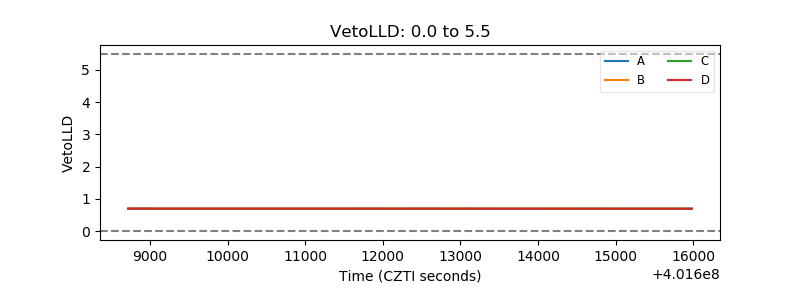 |
| Alpha Counter | 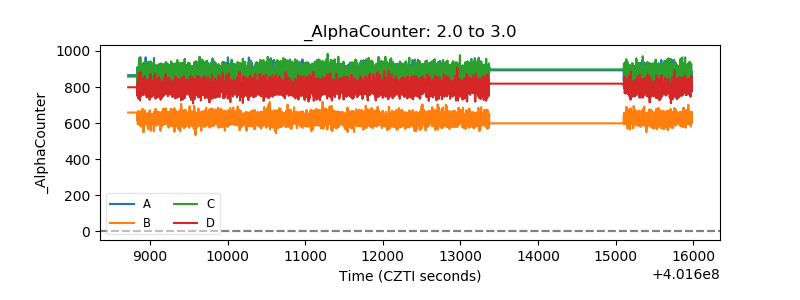 |
| _CPM_Rate | 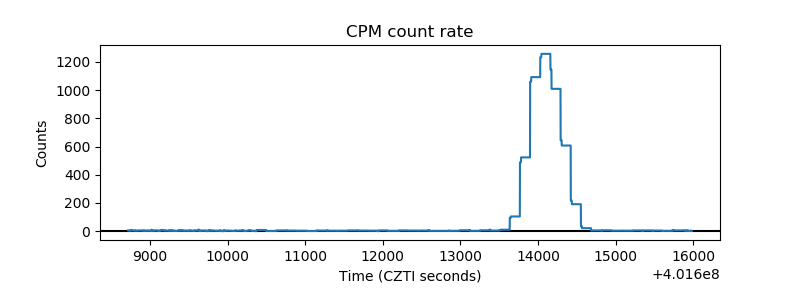 |
| CZT Counter | 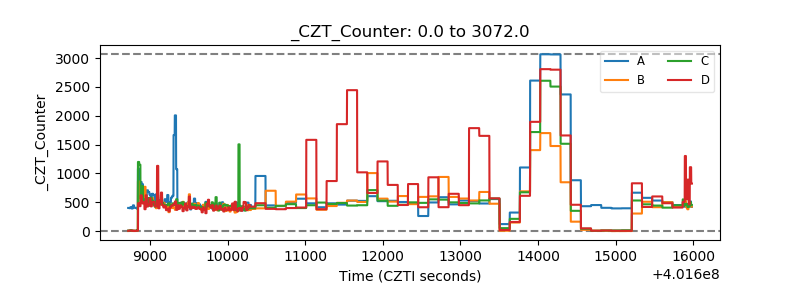 |
| +2.5 Volts monitor | 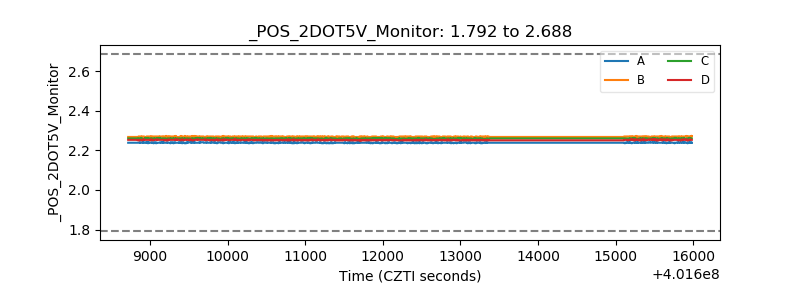 |
| +5 Volts monitor | 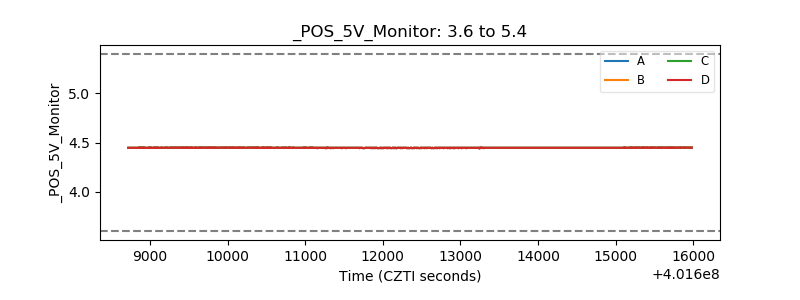 |
| _ROLL_ROT | 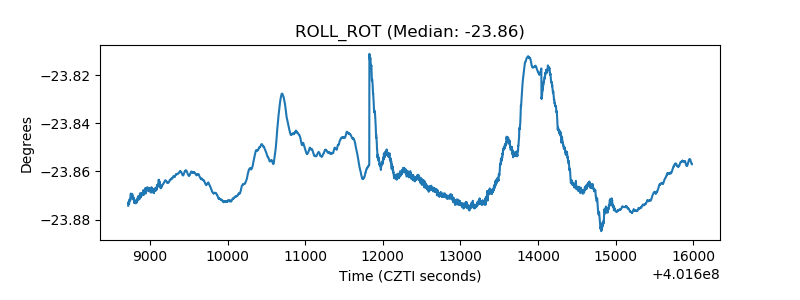 |
| _Roll_DEC | 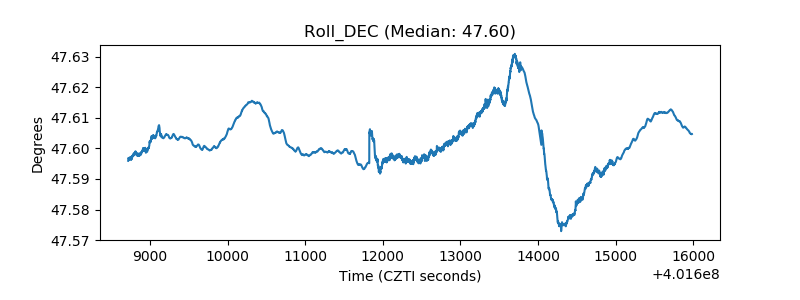 |
| _Roll_RA | 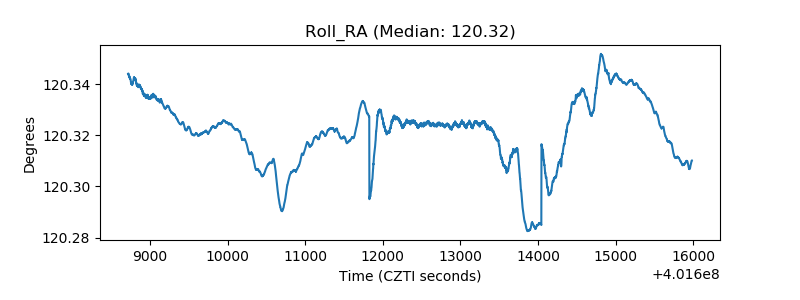 |
| Veto Counter | 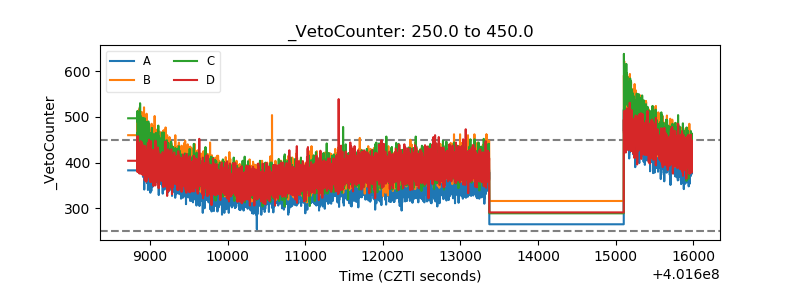 |