| Param | Original file | Final file |
|---|---|---|
| Filename | modeM0/AS1A11_106T02_9000005344_37779cztM0_level2.evt | modeM0/AS1A11_106T02_9000005344_37779cztM0_level2_quad_clean.evt |
| Size (bytes) | 436,691,520 | 72,031,680 |
| Size | 416.5 MB | 68.7 MB |
| Events in quadrant A | 2,752,194 | 461,811 |
| Events in quadrant B | 2,938,512 | 463,454 |
| Events in quadrant C | 2,675,039 | 459,612 |
| Events in quadrant D | 4,504,120 | 429,496 |
| Mode M9 | |||
|---|---|---|---|
| Quadrant | BADHDUFLAG | Total packets | Discarded packets |
| A | 0 | 23 | 0 |
| B | 0 | 23 | 0 |
| C | 0 | 23 | 0 |
| D | 0 | 24 | 0 |
| Mode SS | |||
|---|---|---|---|
| Quadrant | BADHDUFLAG | Total packets | Discarded packets |
| A | 0 | 108 | 0 |
| B | 0 | 108 | 0 |
| C | 0 | 108 | 0 |
| D | 0 | 108 | 0 |
| Mode M0 | |||
|---|---|---|---|
| Quadrant | BADHDUFLAG | Total packets | Discarded packets |
| A | 0 | 11211 | 3 |
| B | 0 | 11950 | 2 |
| C | 0 | 10981 | 2 |
| D | 0 | 16994 | 2 |
| Quadrant | Total seconds | Saturated seconds | Saturation percentage |
|---|---|---|---|
| A | 5231 | 7 | 0.133818% |
| B | 5231 | 49 | 0.936723% |
| C | 5231 | 25 | 0.477920% |
| D | 5231 | 291 | 5.562990% |
Noise dominated data is calculated using 1-second bins in cleaned event files. If a bin has >2000 counts, and if more than 50% of those come from <1% of pixels, then it is considered to be noise-dominated and hence unusable.
| Quadrant | # 1 sec bins | Bins with >0 counts | Bins with >2000 counts | High rate bins dominated by noise | Noise dominated (total time) | Noise dominated (detector-on time) | Marked lightcurve |
|---|---|---|---|---|---|---|---|
| A | 7114 | 5232 | 4 | 4 | 0.06% | 0.08% | 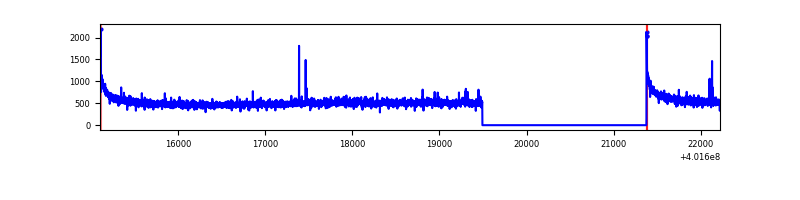 |
| B | 7114 | 5232 | 43 | 43 | 0.60% | 0.82% | 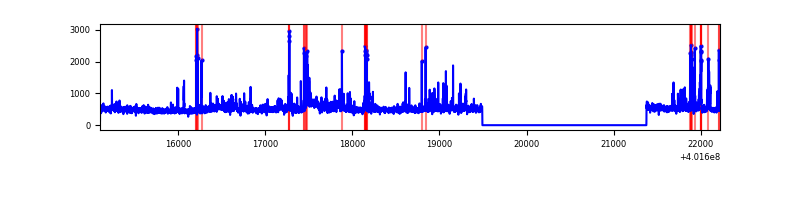 |
| C | 7114 | 5232 | 26 | 26 | 0.37% | 0.50% | 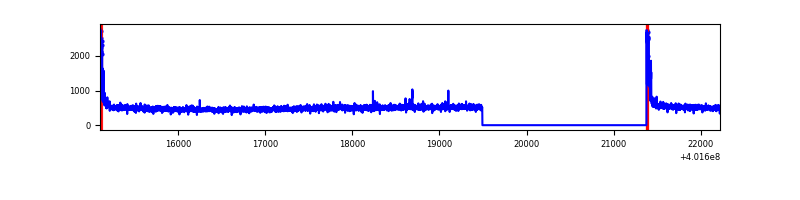 |
| D | 7114 | 5232 | 308 | 308 | 4.33% | 5.89% | 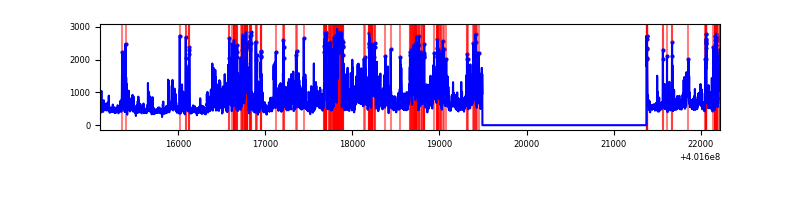 |
Top three noisy pixels from each quadrant. If the there are fewer than three noisy pixels in the level2.evt file, extra rows are filled as -1
| Pixel properties | Quadrant properties | ||||||
|---|---|---|---|---|---|---|---|
| Quadrant | DetID | PixID | Counts | Sigma | Mean | Median | Sigma |
| A | 10 | 83 | 331240 | 2701.01 | 614 | 603 | 122.4 |
| A | 9 | 143 | 14434 | 112.99 | 614 | 603 | 122.4 |
| A | 13 | 6 | 11932 | 92.55 | 614 | 603 | 122.4 |
| B | 5 | 255 | 268249 | 2359.25 | 602 | 586 | 113.5 |
| B | 0 | 189 | 82552 | 722.47 | 602 | 586 | 113.5 |
| B | 5 | 172 | 81567 | 713.79 | 602 | 586 | 113.5 |
| C | 15 | 214 | 242164 | 1770.49 | 589 | 593 | 136.4 |
| C | 0 | 10 | 123328 | 899.53 | 589 | 593 | 136.4 |
| C | 15 | 159 | 5416 | 35.34 | 589 | 593 | 136.4 |
| D | 12 | 235 | 832045 | 5830.4 | 583 | 565 | 142.6 |
| D | 2 | 249 | 721325 | 5054.03 | 583 | 565 | 142.6 |
| D | 10 | 253 | 205474 | 1436.84 | 583 | 565 | 142.6 |
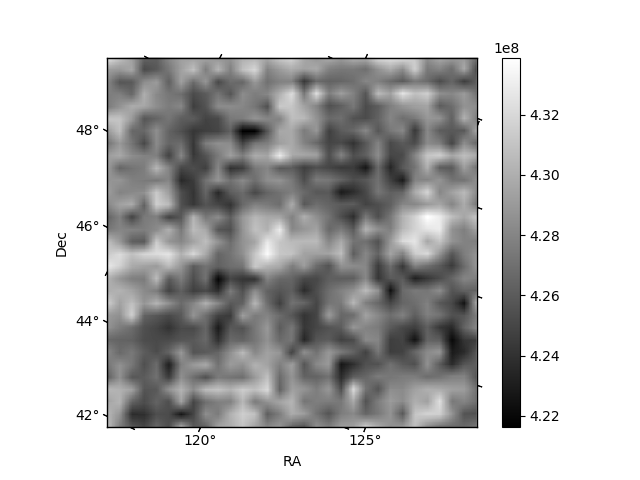
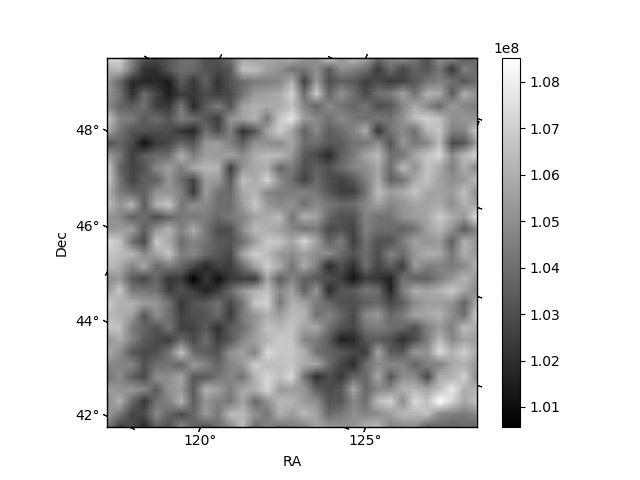
Histogram calculated using DETX and DETY for each event in the final _common_clean file
| Quadrant A | 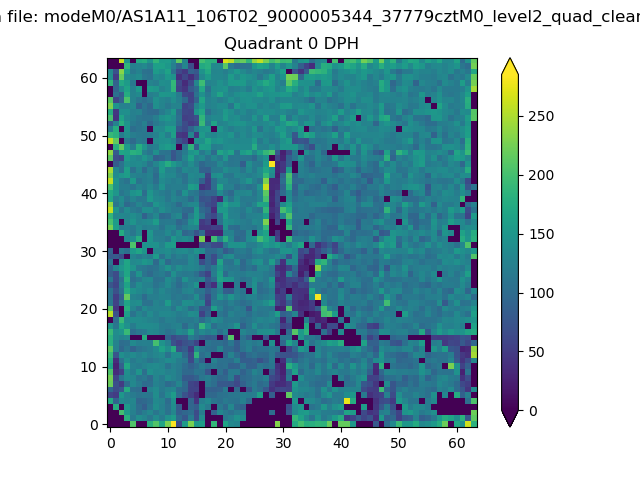 |
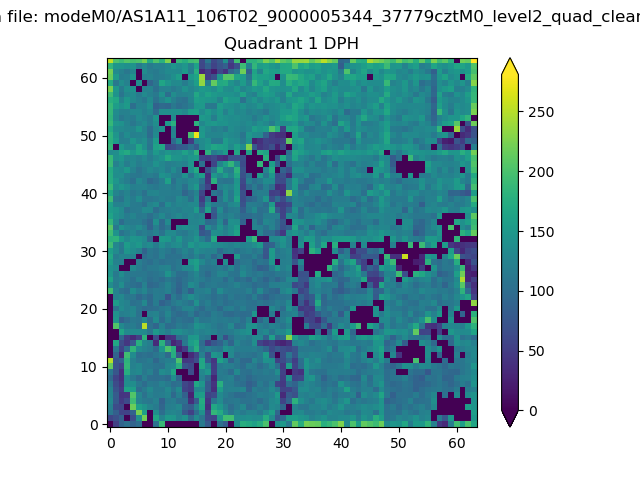 |
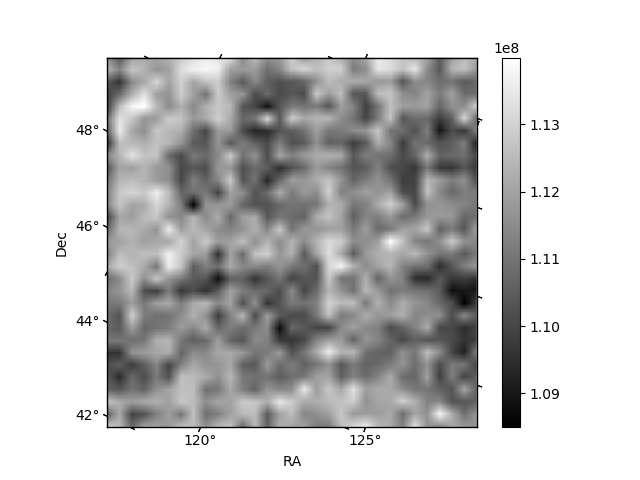
Quadrant B |
|---|---|---|---|
| Quadrant D | 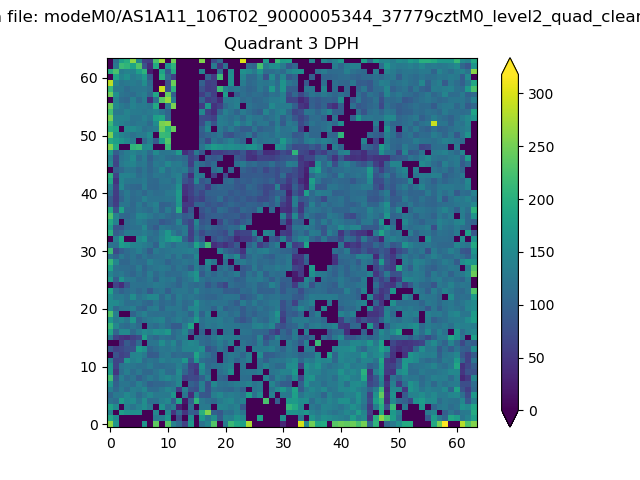 |
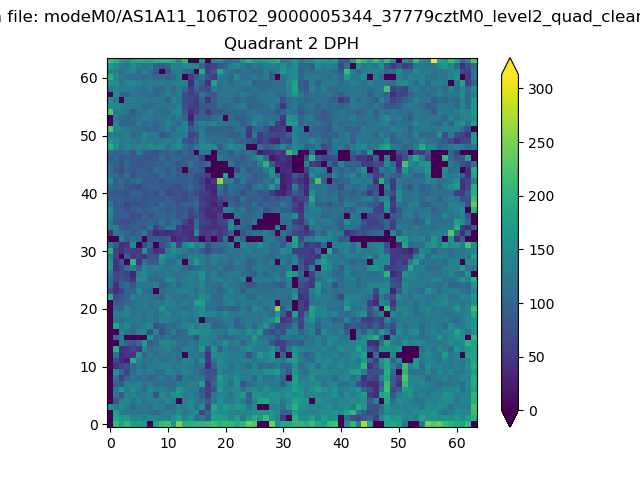 |
Quadrant C |
| Plot type | Count rate plots | Images |
|---|---|---|
| Comparison with Poisson distribution Blue bars denote a histogram of data divided into 1 sec bins. Red curve is a Poisson curve with rate = median count rate of data. |
 |
 |
| Quadrant-wise count rates Data is divided into 100 sec bins |
 |
|
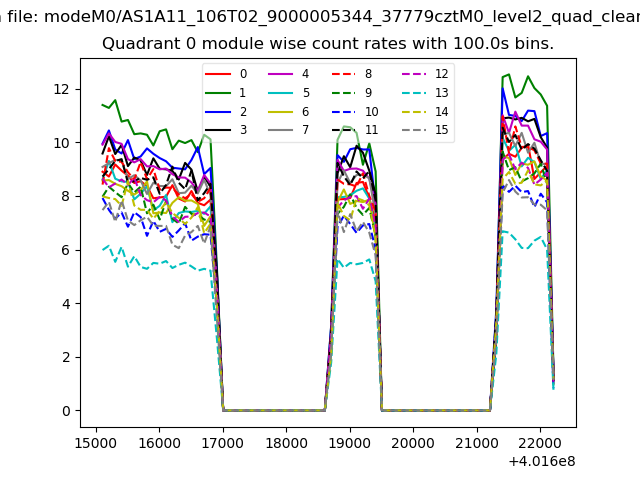
| Module-wise count rates for Quadrant A Data is divided into 100 sec bins |
 |
 |
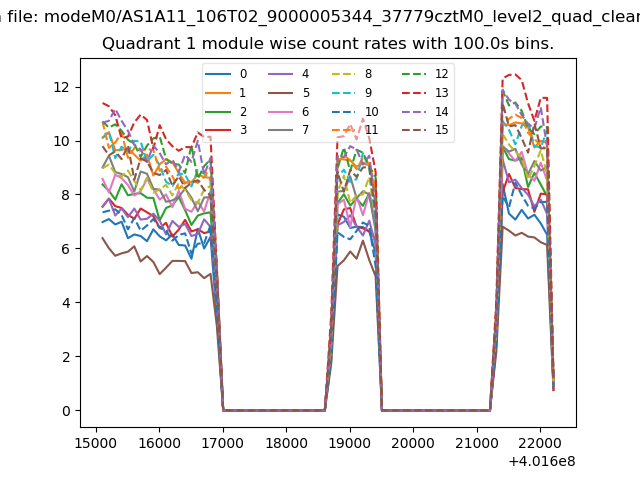
| Module-wise count rates for Quadrant B Data is divided into 100 sec bins |
 |
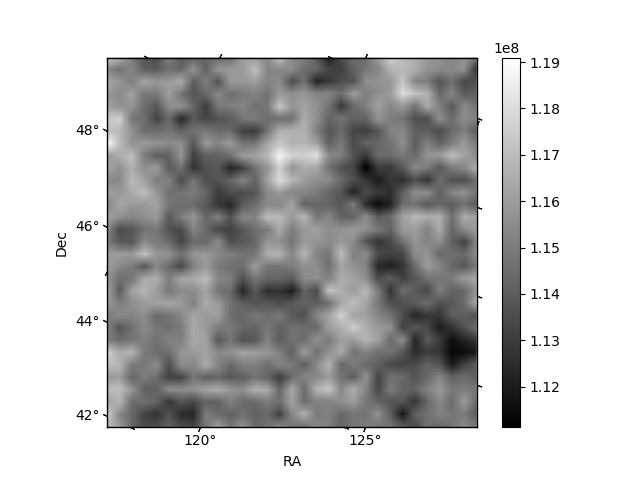 |
| Module-wise count rates for Quadrant C Data is divided into 100 sec bins |
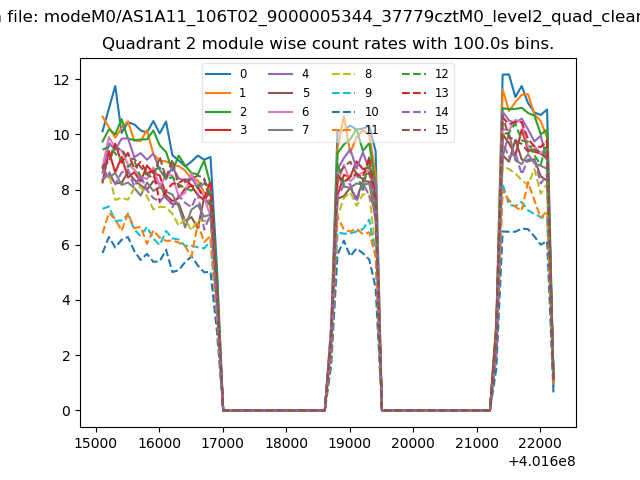 |
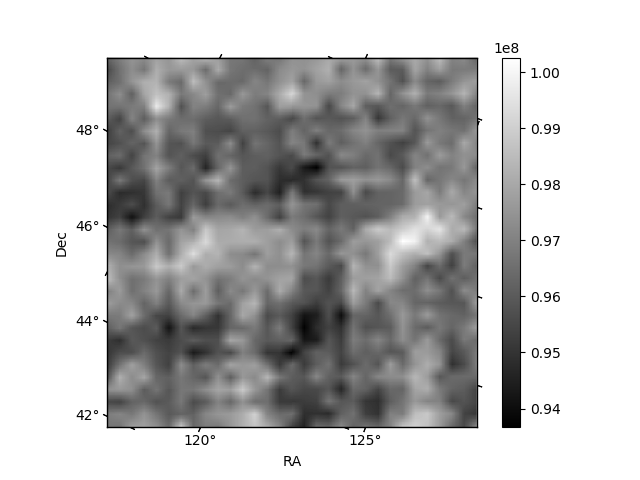 |
| Module-wise count rates for Quadrant D Data is divided into 100 sec bins |
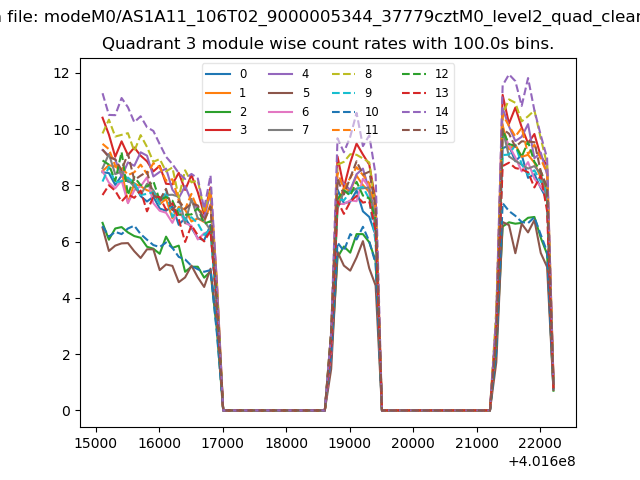 |
 |
| Parameter | Plot |
|---|---|
| CZT HV Monitor | 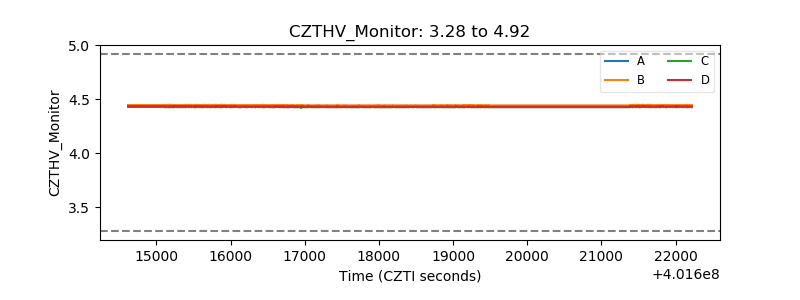 |
| D_VDD | 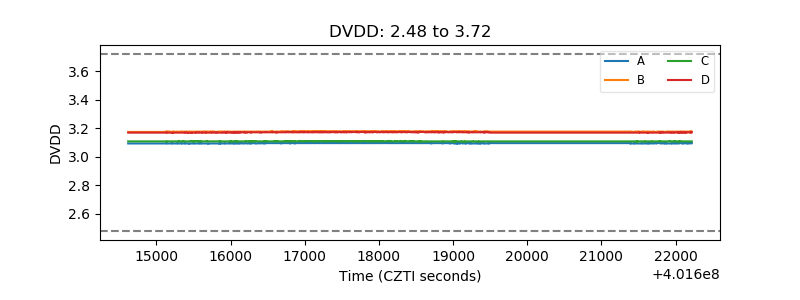 |
| Temperature 1 | 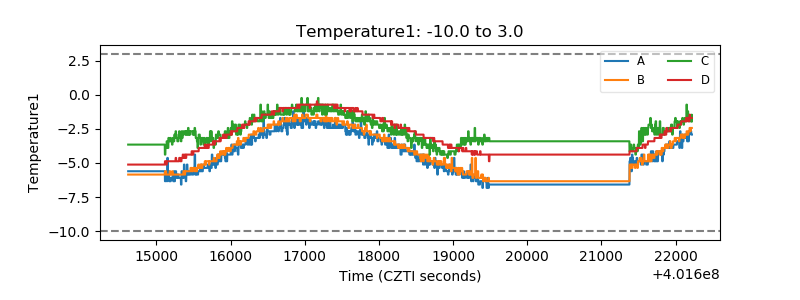 |
| Veto HV Monitor |  |
| Veto LLD | 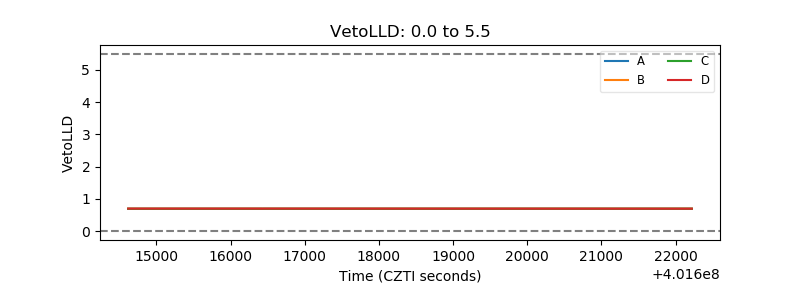 |
| Alpha Counter |  |
| _CPM_Rate |  |
| CZT Counter |  |
| +2.5 Volts monitor | 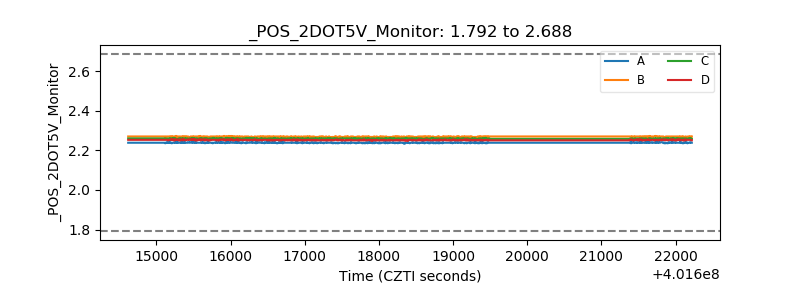 |
| +5 Volts monitor |  |
| _ROLL_ROT | 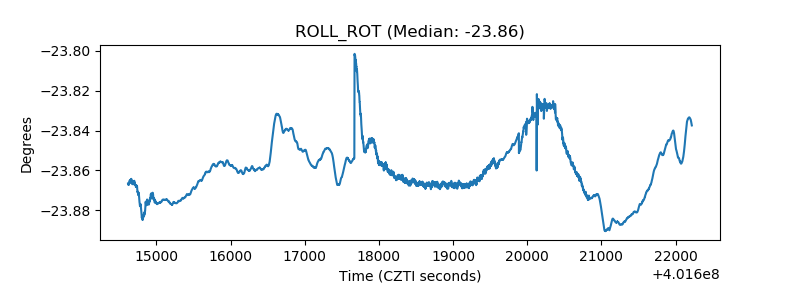 |
| _Roll_DEC | 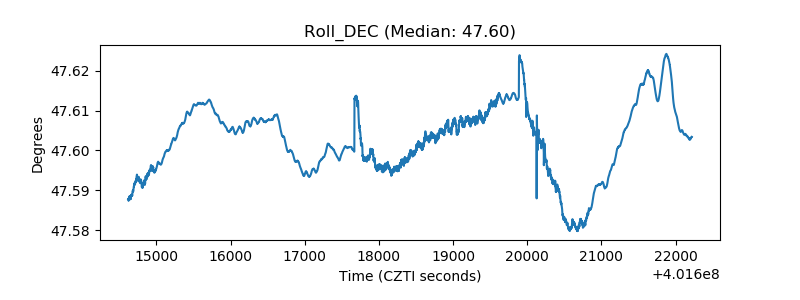 |
| _Roll_RA |  |
| Veto Counter | 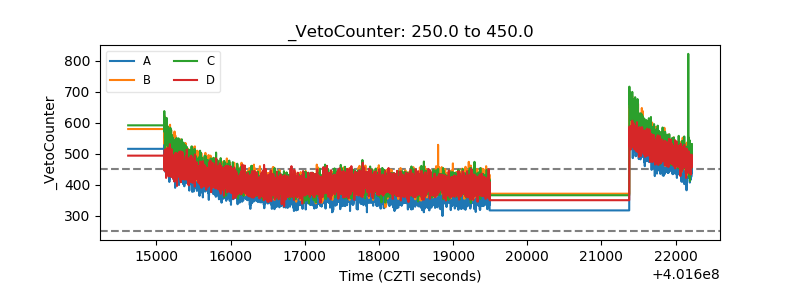 |