| Param | Original file | Final file |
|---|---|---|
| Filename | modeM0/AS1A11_106T02_9000005344_37780cztM0_level2.evt | modeM0/AS1A11_106T02_9000005344_37780cztM0_level2_quad_clean.evt |
| Size (bytes) | 495,895,680 | 72,722,880 |
| Size | 472.9 MB | 69.4 MB |
| Events in quadrant A | 2,866,673 | 472,790 |
| Events in quadrant B | 3,119,258 | 470,763 |
| Events in quadrant C | 2,722,150 | 467,567 |
| Events in quadrant D | 5,965,489 | 434,208 |
| Mode M9 | |||
|---|---|---|---|
| Quadrant | BADHDUFLAG | Total packets | Discarded packets |
| A | 0 | 25 | 0 |
| B | 0 | 25 | 0 |
| C | 0 | 25 | 0 |
| D | 0 | 26 | 0 |
| Mode SS | |||
|---|---|---|---|
| Quadrant | BADHDUFLAG | Total packets | Discarded packets |
| A | 0 | 104 | 0 |
| B | 0 | 104 | 0 |
| C | 0 | 104 | 0 |
| D | 0 | 104 | 0 |
| Mode M0 | |||
|---|---|---|---|
| Quadrant | BADHDUFLAG | Total packets | Discarded packets |
| A | 0 | 11427 | 3 |
| B | 0 | 12312 | 2 |
| C | 0 | 10859 | 2 |
| D | 0 | 21246 | 2 |
| Quadrant | Total seconds | Saturated seconds | Saturation percentage |
|---|---|---|---|
| A | 5087 | 14 | 0.275211% |
| B | 5087 | 100 | 1.965795% |
| C | 5087 | 28 | 0.550423% |
| D | 5087 | 675 | 13.269117% |
Noise dominated data is calculated using 1-second bins in cleaned event files. If a bin has >2000 counts, and if more than 50% of those come from <1% of pixels, then it is considered to be noise-dominated and hence unusable.
| Quadrant | # 1 sec bins | Bins with >0 counts | Bins with >2000 counts | High rate bins dominated by noise | Noise dominated (total time) | Noise dominated (detector-on time) | Marked lightcurve |
|---|---|---|---|---|---|---|---|
| A | 7090 | 5088 | 11 | 11 | 0.16% | 0.22% | 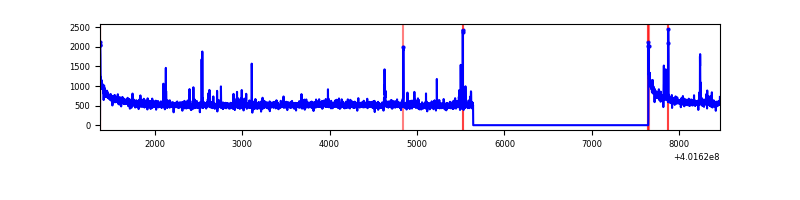 |
| B | 7090 | 5088 | 79 | 79 | 1.11% | 1.55% | 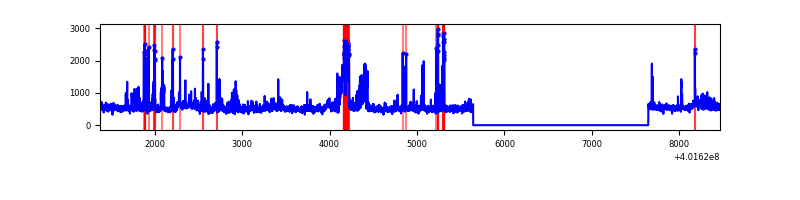 |
| C | 7090 | 5088 | 27 | 27 | 0.38% | 0.53% | 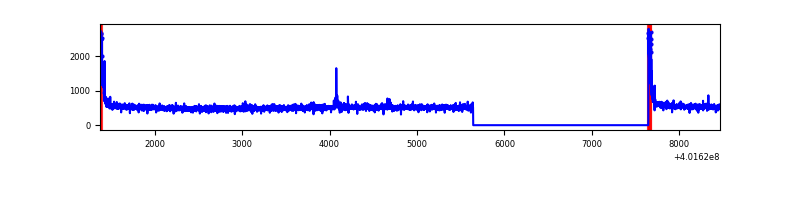 |
| D | 7090 | 5088 | 730 | 730 | 10.30% | 14.35% | 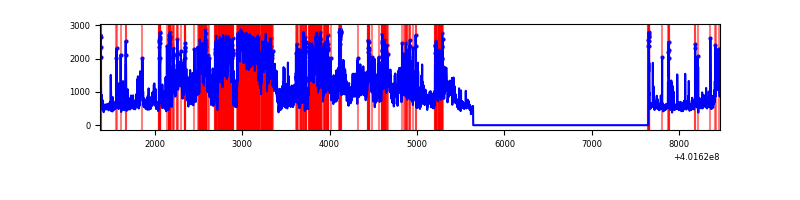 |
Top three noisy pixels from each quadrant. If the there are fewer than three noisy pixels in the level2.evt file, extra rows are filled as -1
| Pixel properties | Quadrant properties | ||||||
|---|---|---|---|---|---|---|---|
| Quadrant | DetID | PixID | Counts | Sigma | Mean | Median | Sigma |
| A | 10 | 83 | 337030 | 2702.51 | 624 | 615 | 124.5 |
| A | 9 | 143 | 36008 | 284.32 | 624 | 615 | 124.5 |
| A | 15 | 222 | 22487 | 175.7 | 624 | 615 | 124.5 |
| B | 0 | 189 | 182129 | 1609.03 | 606 | 593 | 112.8 |
| B | 5 | 172 | 158752 | 1401.83 | 606 | 593 | 112.8 |
| B | 5 | 255 | 158105 | 1396.09 | 606 | 593 | 112.8 |
| C | 15 | 214 | 235927 | 1720.26 | 598 | 604 | 136.8 |
| C | 0 | 10 | 125783 | 915.08 | 598 | 604 | 136.8 |
| C | 0 | 207 | 13143 | 91.66 | 598 | 604 | 136.8 |
| D | 12 | 235 | 1928692 | 13626.86 | 584 | 567 | 141.5 |
| D | 9 | 49 | 385410 | 2719.84 | 584 | 567 | 141.5 |
| D | 12 | 16 | 324769 | 2291.27 | 584 | 567 | 141.5 |
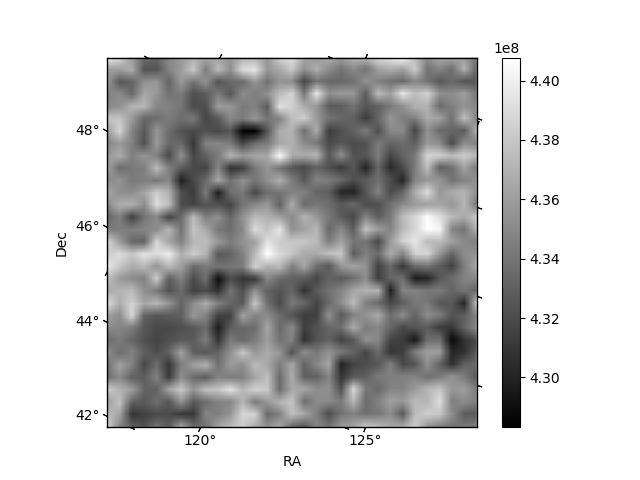
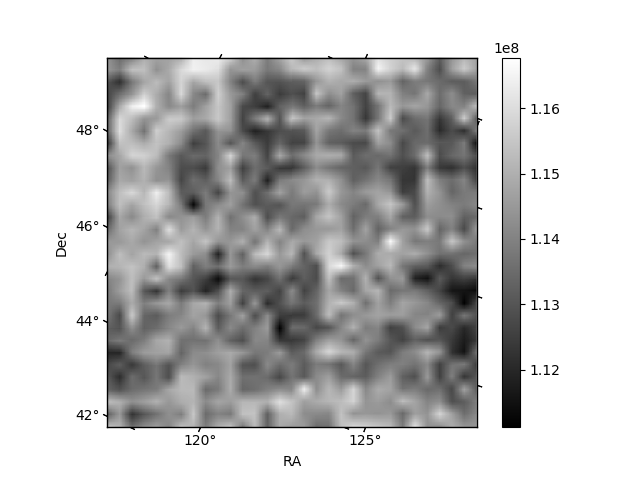
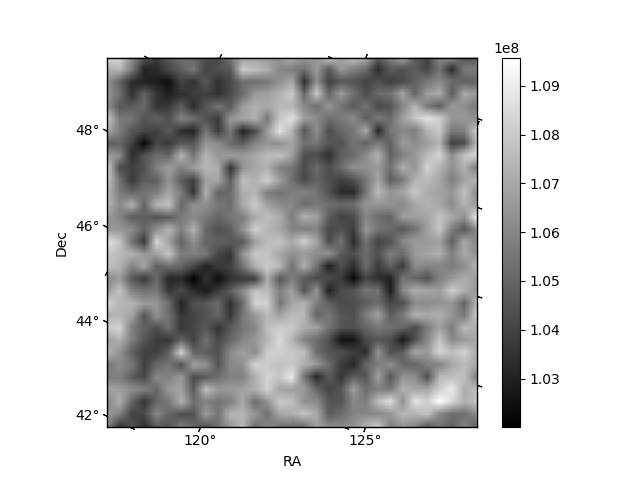
Histogram calculated using DETX and DETY for each event in the final _common_clean file
| Quadrant A | 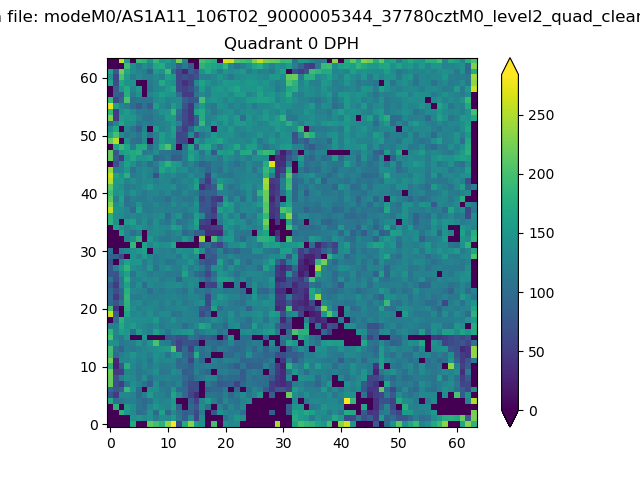 |
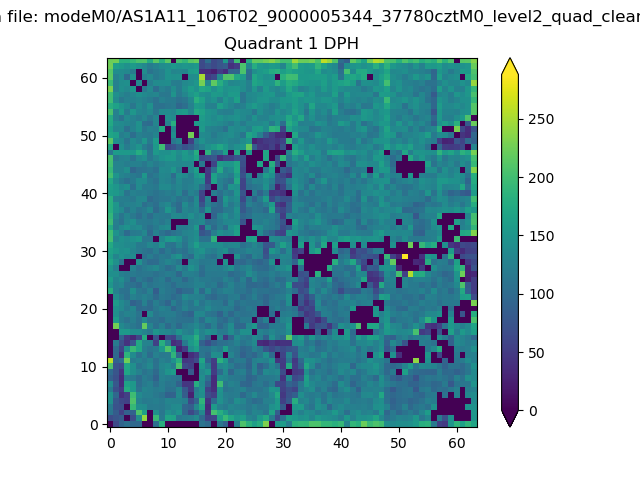 |
Quadrant B |
|---|---|---|---|
| Quadrant D |  |
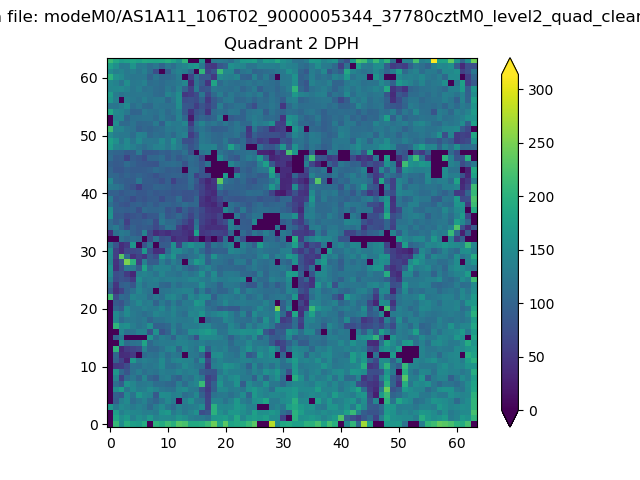 |
Quadrant C |
| Plot type | Count rate plots | Images |
|---|---|---|
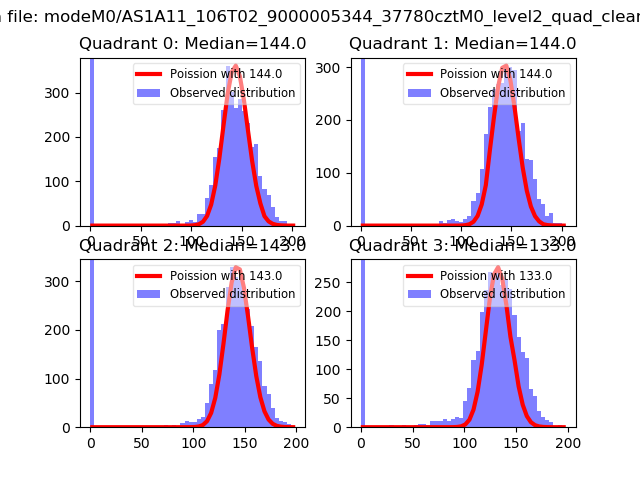
| Comparison with Poisson distribution Blue bars denote a histogram of data divided into 1 sec bins. Red curve is a Poisson curve with rate = median count rate of data. |
 |
 |
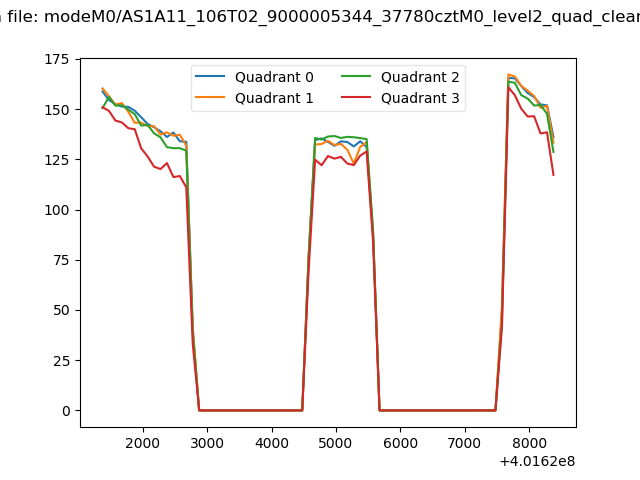
| Quadrant-wise count rates Data is divided into 100 sec bins |
 |
|
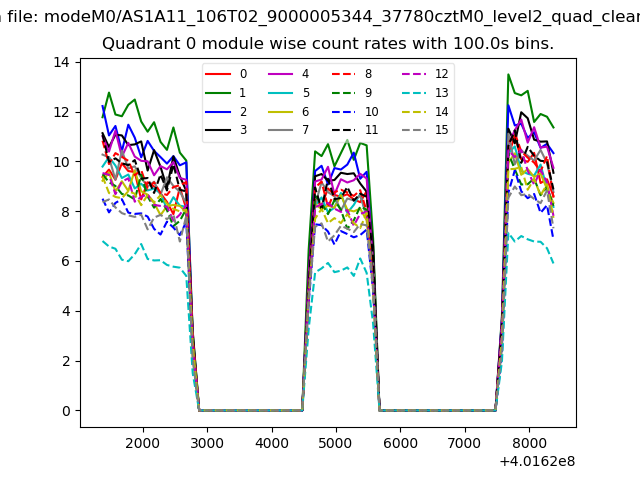
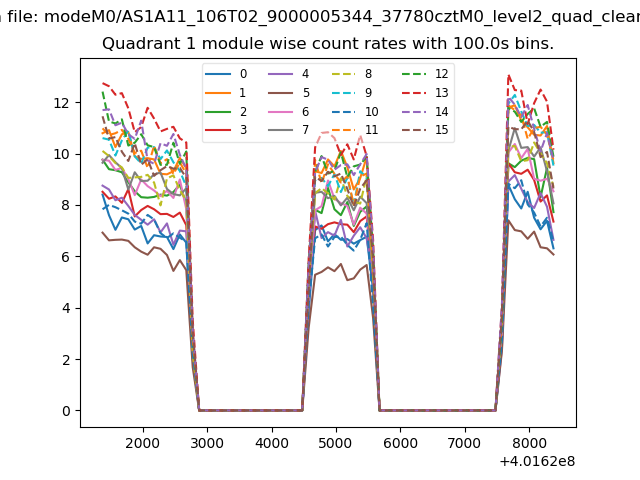
| Module-wise count rates for Quadrant A Data is divided into 100 sec bins |
 |
 |
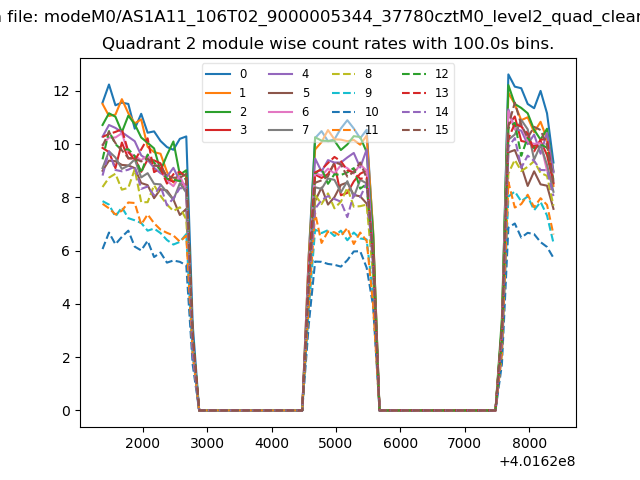
| Module-wise count rates for Quadrant B Data is divided into 100 sec bins |
 |
 |
| Module-wise count rates for Quadrant C Data is divided into 100 sec bins |
 |
 |
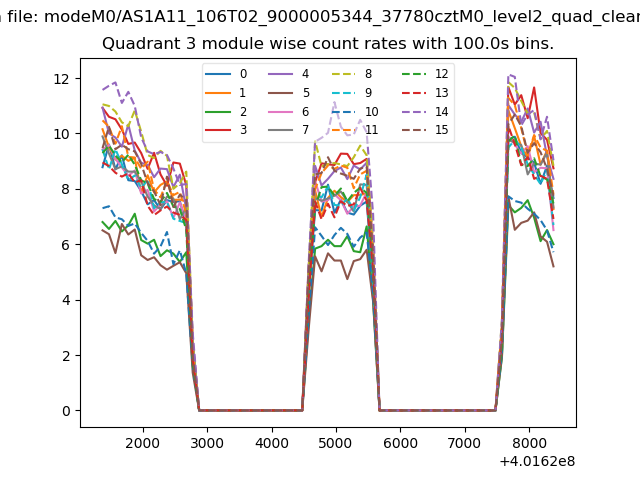
| Module-wise count rates for Quadrant D Data is divided into 100 sec bins |
 |
 |
| Parameter | Plot |
|---|---|
| CZT HV Monitor | 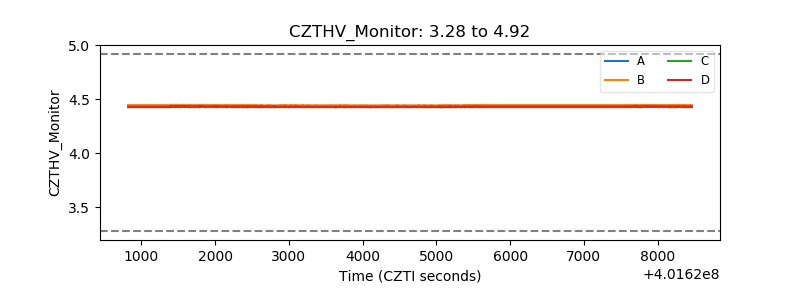 |
| D_VDD | 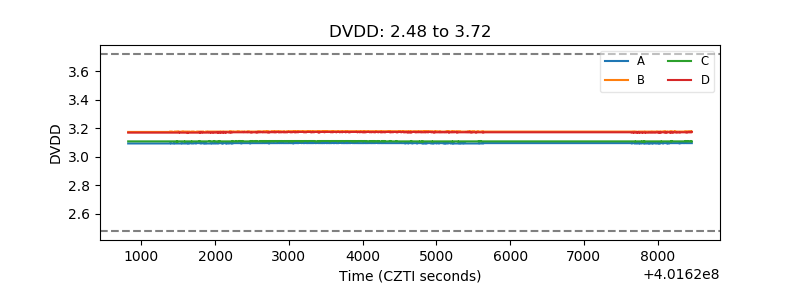 |
| Temperature 1 | 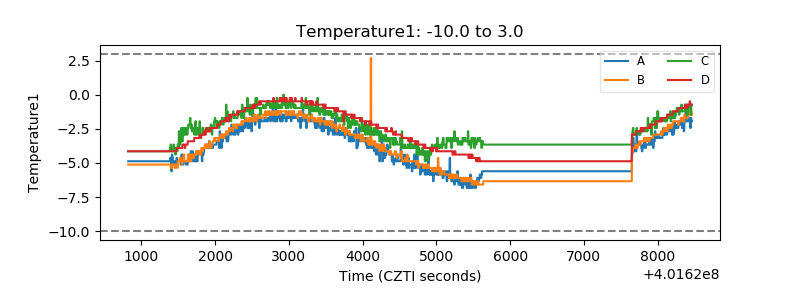 |
| Veto HV Monitor | 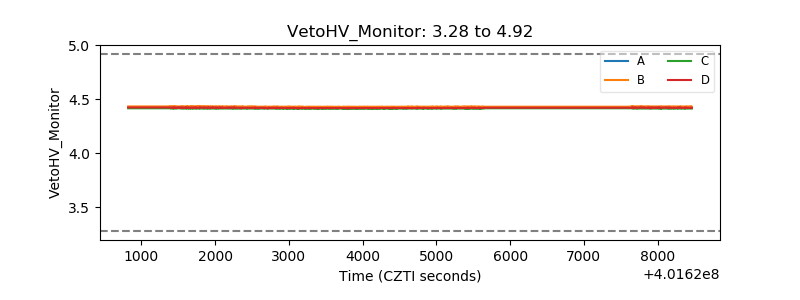 |
| Veto LLD | 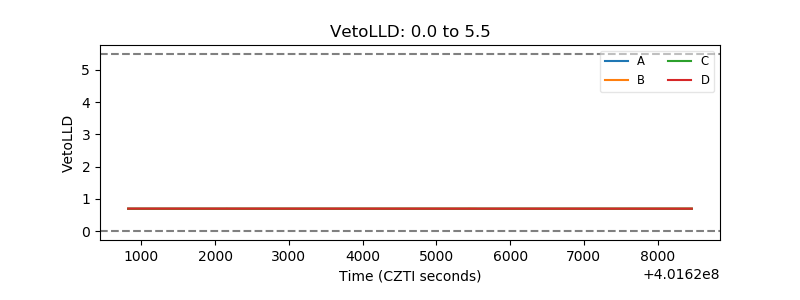 |
| Alpha Counter | 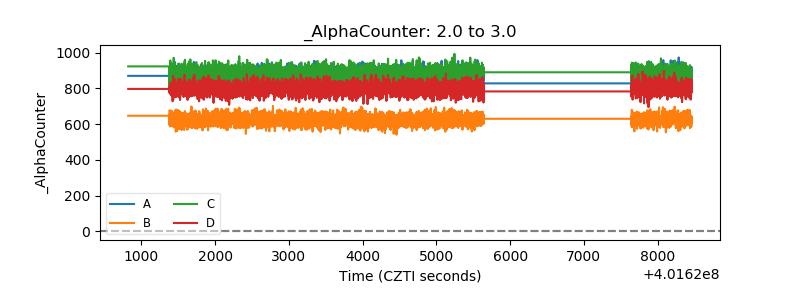 |
| _CPM_Rate | 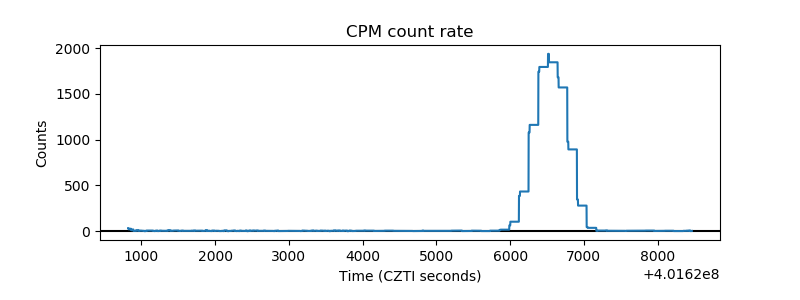 |
| CZT Counter | 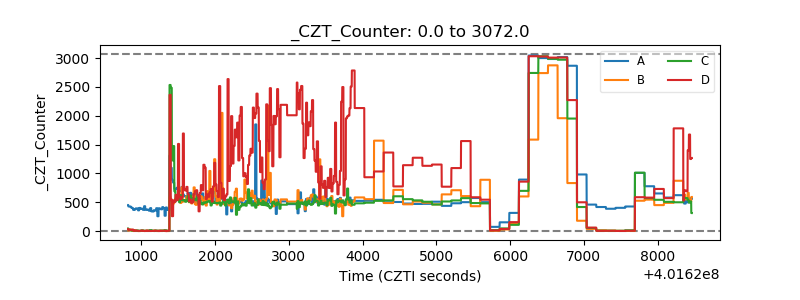 |
| +2.5 Volts monitor | 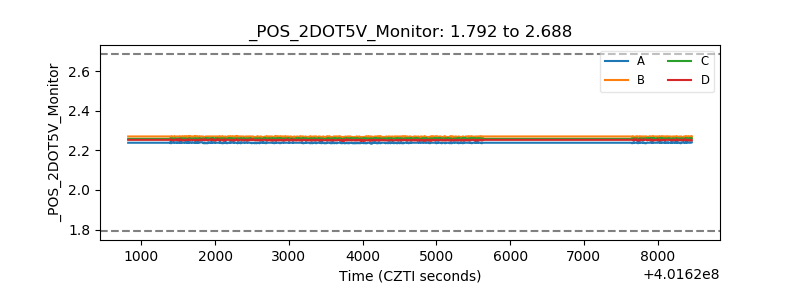 |
| +5 Volts monitor | 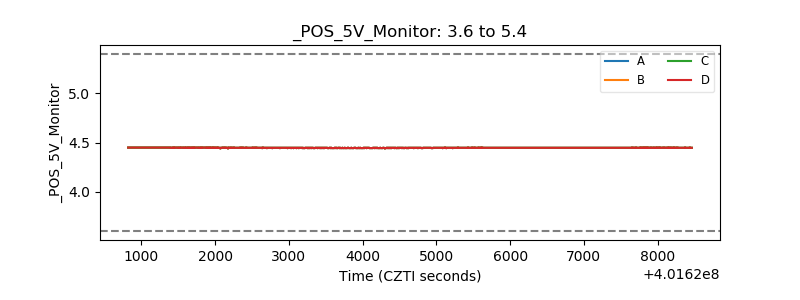 |
| _ROLL_ROT | 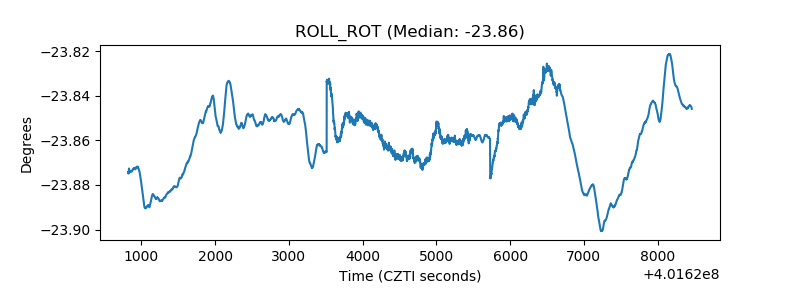 |
| _Roll_DEC | 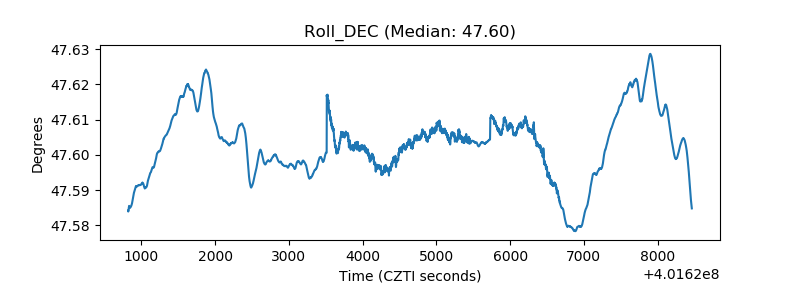 |
| _Roll_RA |  |
| Veto Counter | 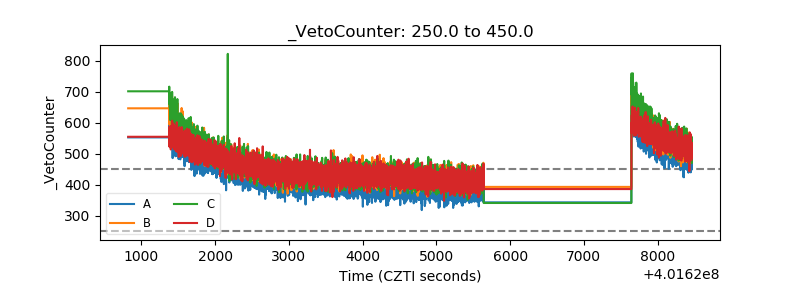 |