| Param | Original file | Final file |
|---|---|---|
| Filename | modeM0/AS1A11_106T02_9000005344_37781cztM0_level2.evt | modeM0/AS1A11_106T02_9000005344_37781cztM0_level2_quad_clean.evt |
| Size (bytes) | 364,944,960 | 39,144,960 |
| Size | 348.0 MB | 37.3 MB |
| Events in quadrant A | 1,921,844 | 242,714 |
| Events in quadrant B | 2,201,523 | 238,734 |
| Events in quadrant C | 1,805,268 | 239,671 |
| Events in quadrant D | 4,888,556 | 218,510 |
| Mode SS | |||
|---|---|---|---|
| Quadrant | BADHDUFLAG | Total packets | Discarded packets |
| A | 0 | 68 | 0 |
| B | 0 | 68 | 0 |
| C | 0 | 68 | 0 |
| D | 0 | 68 | 0 |
| Mode M0 | |||
|---|---|---|---|
| Quadrant | BADHDUFLAG | Total packets | Discarded packets |
| A | 0 | 7629 | 0 |
| B | 0 | 8639 | 0 |
| C | 0 | 7154 | 0 |
| D | 0 | 16900 | 0 |
| Quadrant | Total seconds | Saturated seconds | Saturation percentage |
|---|---|---|---|
| A | 3462 | 14 | 0.404391% |
| B | 3462 | 55 | 1.588677% |
| C | 3462 | 2 | 0.057770% |
| D | 3462 | 752 | 21.721548% |
Noise dominated data is calculated using 1-second bins in cleaned event files. If a bin has >2000 counts, and if more than 50% of those come from <1% of pixels, then it is considered to be noise-dominated and hence unusable.
| Quadrant | # 1 sec bins | Bins with >0 counts | Bins with >2000 counts | High rate bins dominated by noise | Noise dominated (total time) | Noise dominated (detector-on time) | Marked lightcurve |
|---|---|---|---|---|---|---|---|
| A | 3462 | 3462 | 10 | 10 | 0.29% | 0.29% | 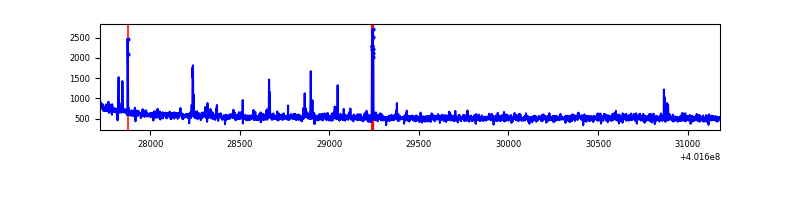 |
| B | 3462 | 3462 | 41 | 41 | 1.18% | 1.18% | 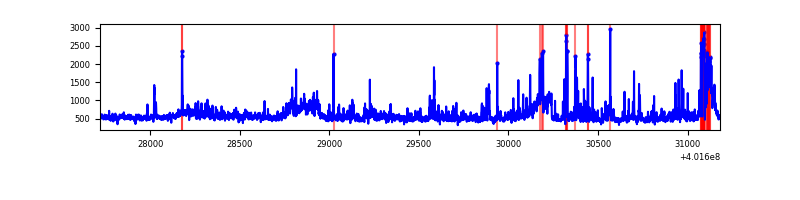 |
| C | 3462 | 3462 | 2 | 2 | 0.06% | 0.06% | 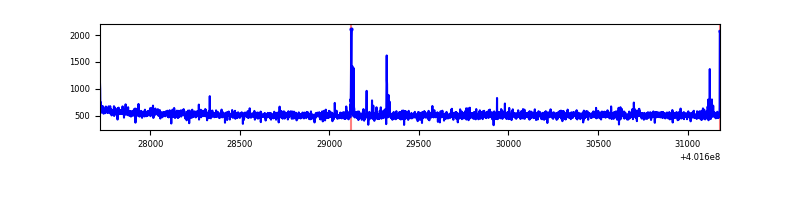 |
| D | 3462 | 3462 | 891 | 891 | 25.74% | 25.74% | 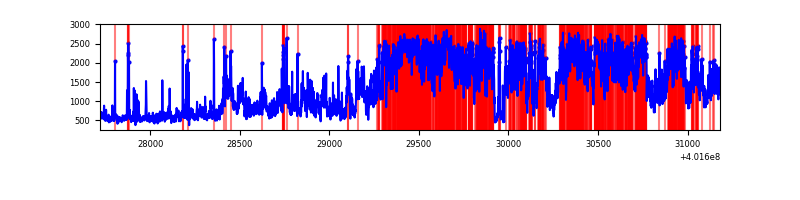 |
Top three noisy pixels from each quadrant. If the there are fewer than three noisy pixels in the level2.evt file, extra rows are filled as -1
| Pixel properties | Quadrant properties | ||||||
|---|---|---|---|---|---|---|---|
| Quadrant | DetID | PixID | Counts | Sigma | Mean | Median | Sigma |
| A | 10 | 83 | 183427 | 2123.2 | 429 | 421 | 86.2 |
| A | 15 | 222 | 23897 | 272.36 | 429 | 421 | 86.2 |
| A | 9 | 143 | 14683 | 165.47 | 429 | 421 | 86.2 |
| B | 0 | 189 | 179654 | 2279.27 | 414 | 405 | 78.6 |
| B | 4 | 81 | 99013 | 1253.87 | 414 | 405 | 78.6 |
| B | 0 | 229 | 87354 | 1105.61 | 414 | 405 | 78.6 |
| C | 15 | 214 | 159910 | 1673.42 | 412 | 416 | 95.3 |
| C | 1 | 23 | 17689 | 181.22 | 412 | 416 | 95.3 |
| C | 15 | 159 | 5508 | 53.42 | 412 | 416 | 95.3 |
| D | 12 | 235 | 2930890 | 30043.1 | 400 | 389 | 97.5 |
| D | 7 | 223 | 78462 | 800.39 | 400 | 389 | 97.5 |
| D | 2 | 250 | 60378 | 615.0 | 400 | 389 | 97.5 |
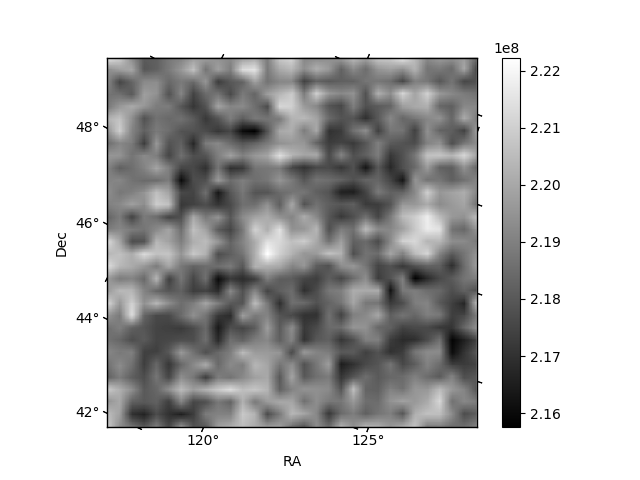
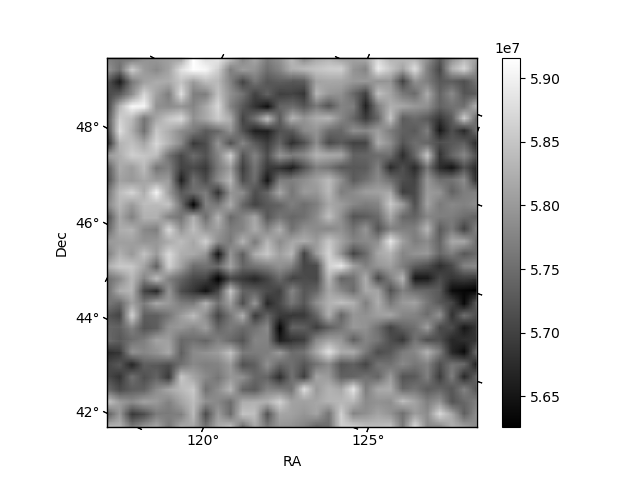
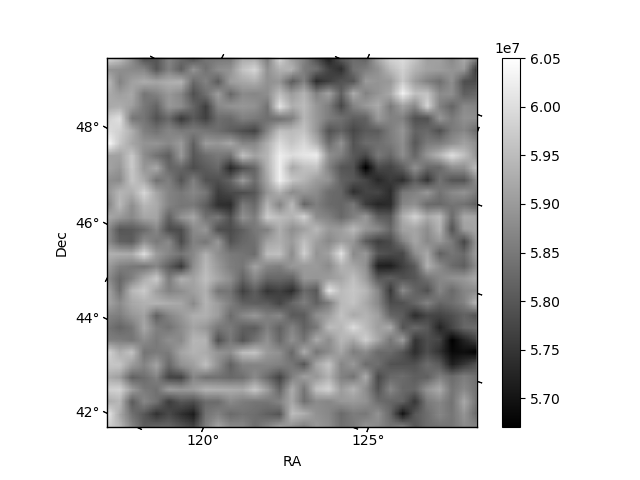
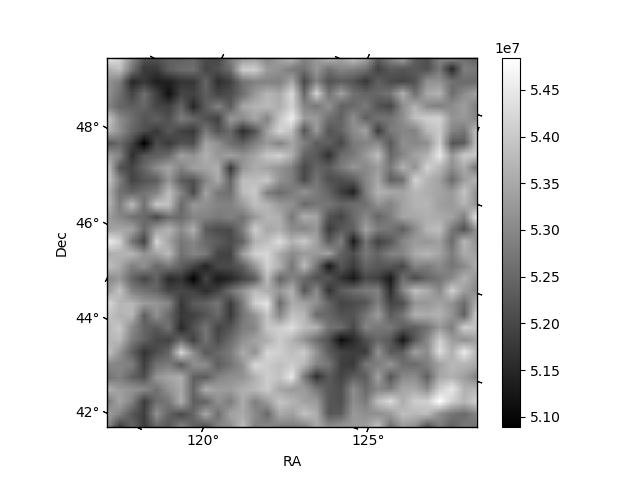
Histogram calculated using DETX and DETY for each event in the final _common_clean file
| Quadrant A | 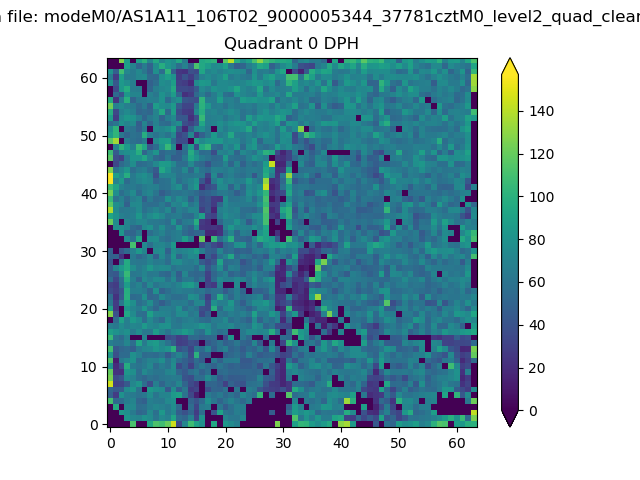 |
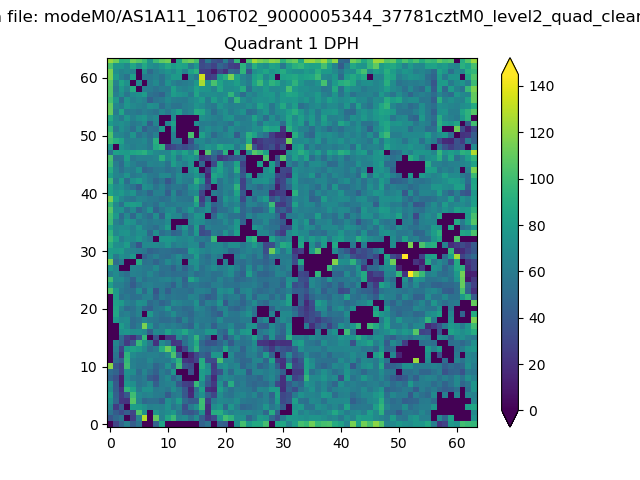 |
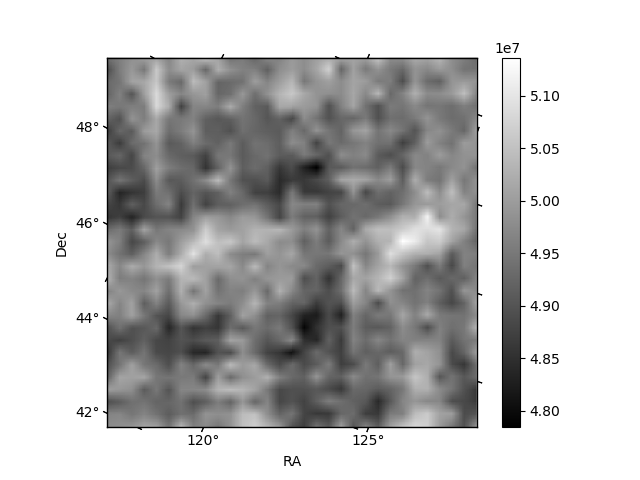
Quadrant B |
|---|---|---|---|
| Quadrant D | 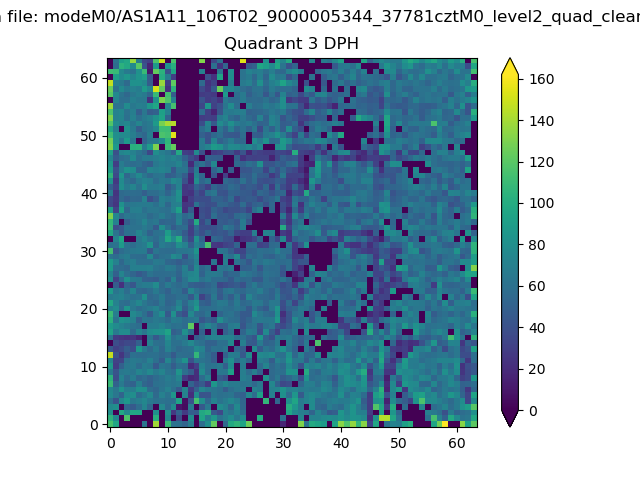 |
 |
Quadrant C |
| Plot type | Count rate plots | Images |
|---|---|---|
| Comparison with Poisson distribution Blue bars denote a histogram of data divided into 1 sec bins. Red curve is a Poisson curve with rate = median count rate of data. |
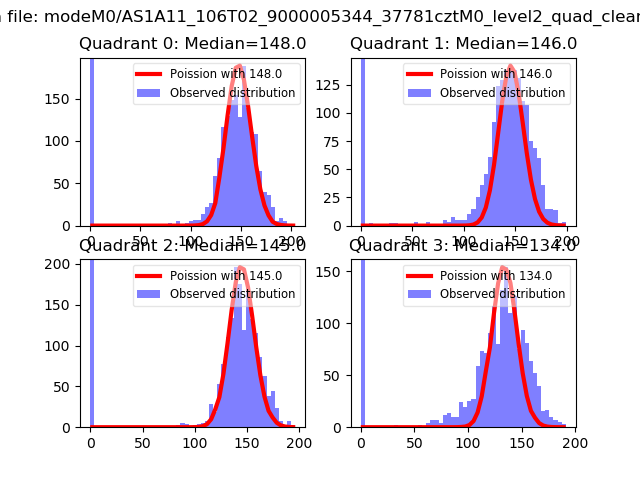 |
 |
| Quadrant-wise count rates Data is divided into 100 sec bins |
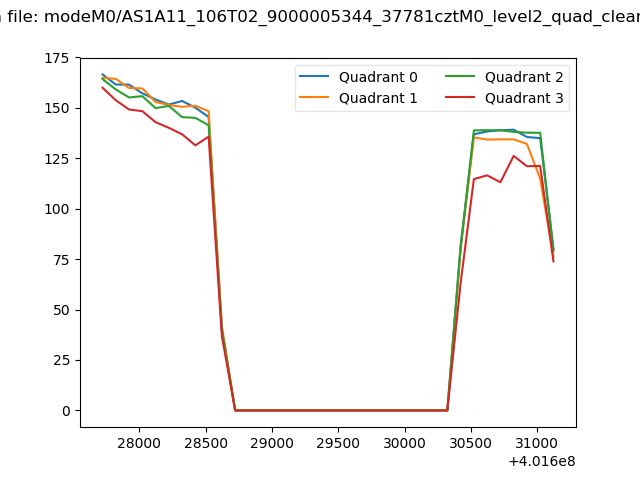 |
|
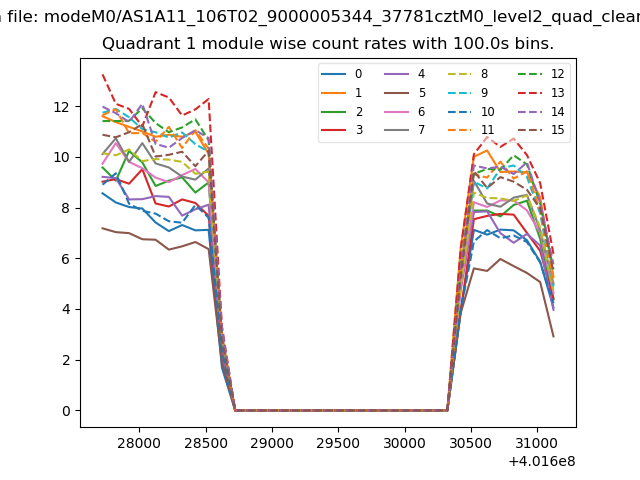
| Module-wise count rates for Quadrant A Data is divided into 100 sec bins |
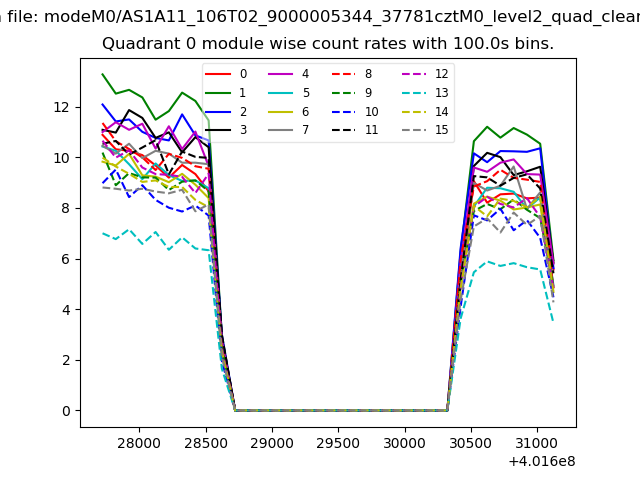 |
 |
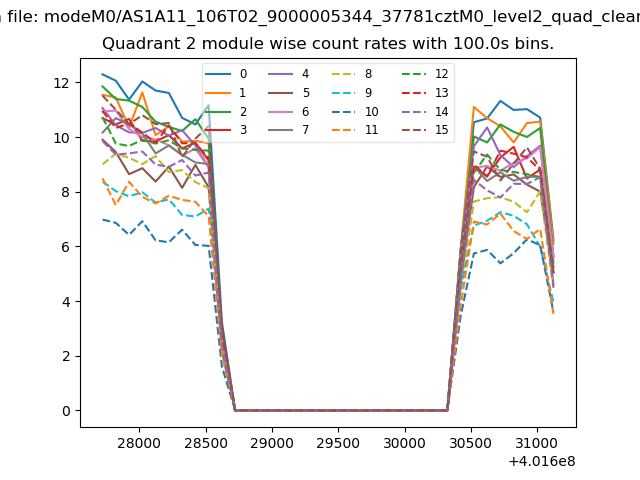
| Module-wise count rates for Quadrant B Data is divided into 100 sec bins |
 |
 |
| Module-wise count rates for Quadrant C Data is divided into 100 sec bins |
 |
 |
| Module-wise count rates for Quadrant D Data is divided into 100 sec bins |
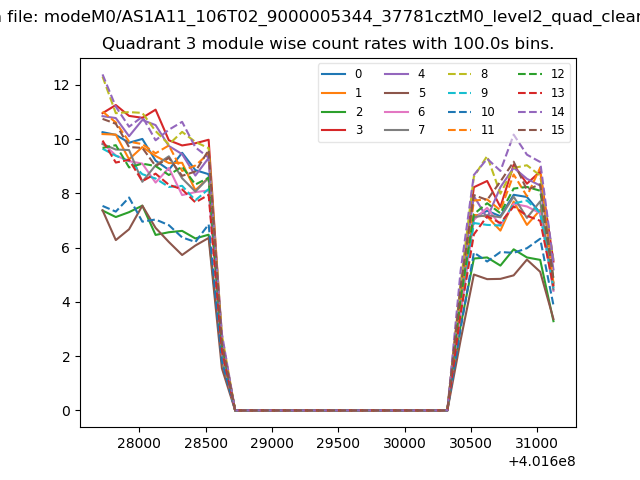 |
 |
| Parameter | Plot |
|---|---|
| CZT HV Monitor | 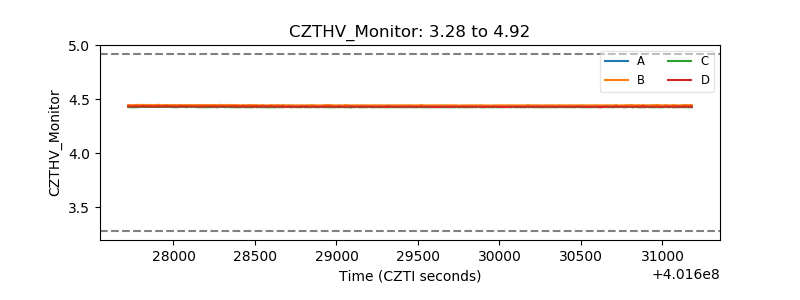 |
| D_VDD | 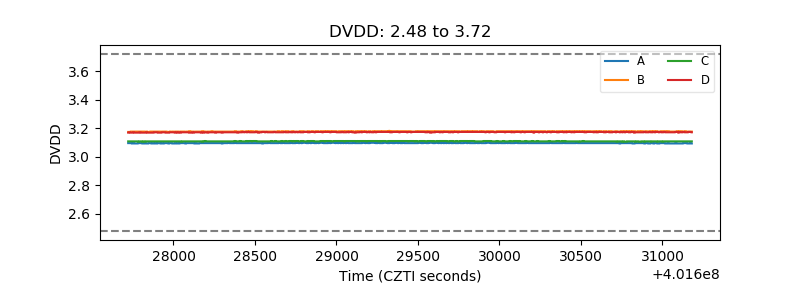 |
| Temperature 1 | 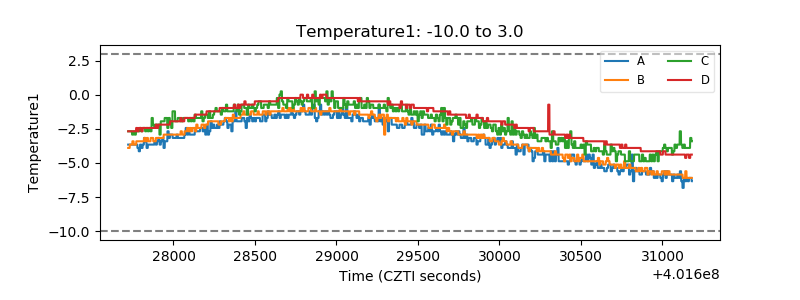 |
| Veto HV Monitor | 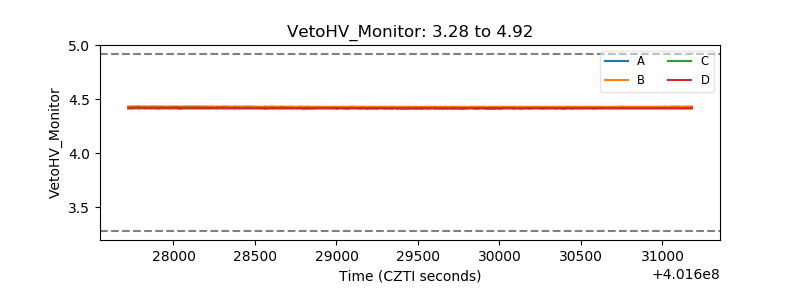 |
| Veto LLD | 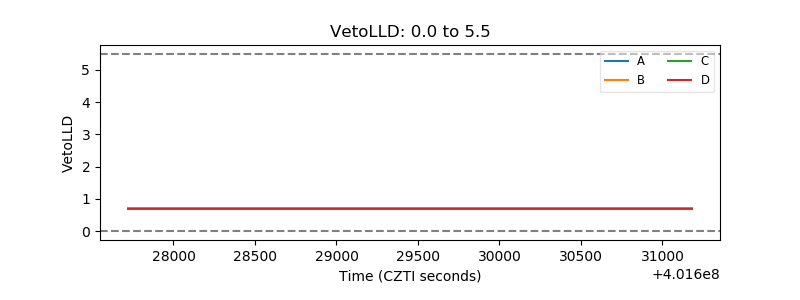 |
| Alpha Counter | 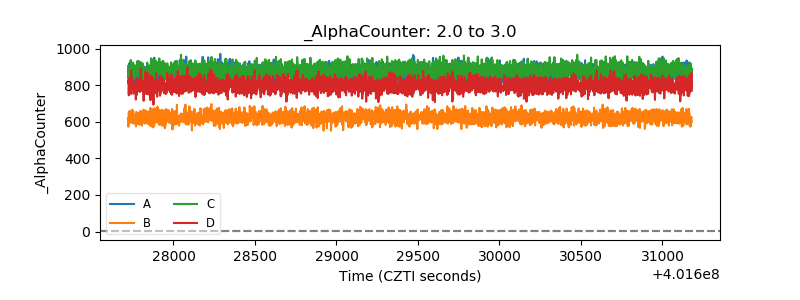 |
| _CPM_Rate | 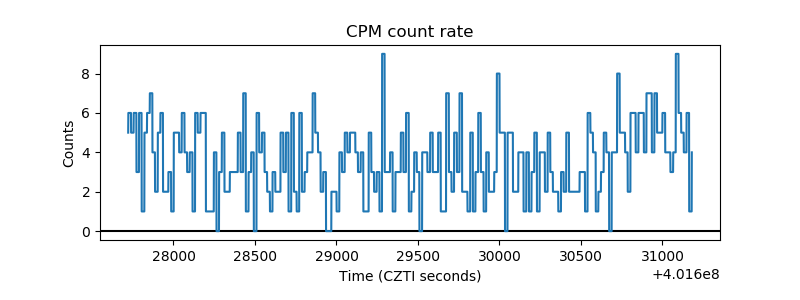 |
| CZT Counter | 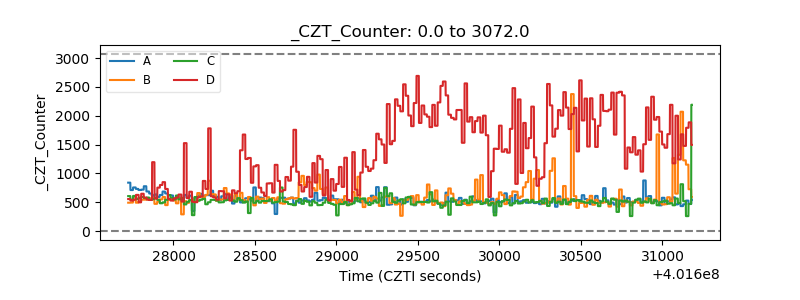 |
| +2.5 Volts monitor |  |
| +5 Volts monitor | 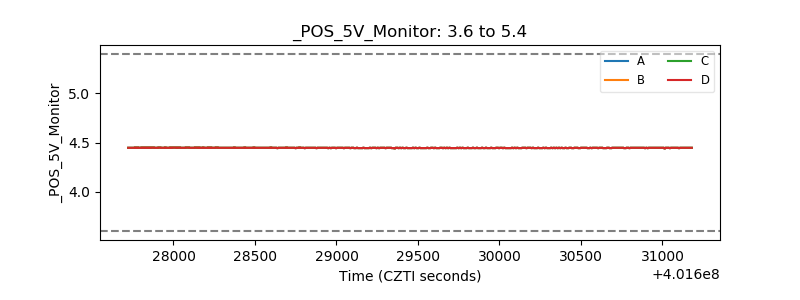 |
| _ROLL_ROT | 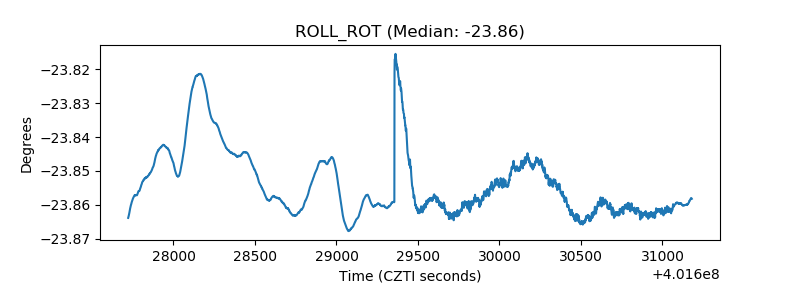 |
| _Roll_DEC | 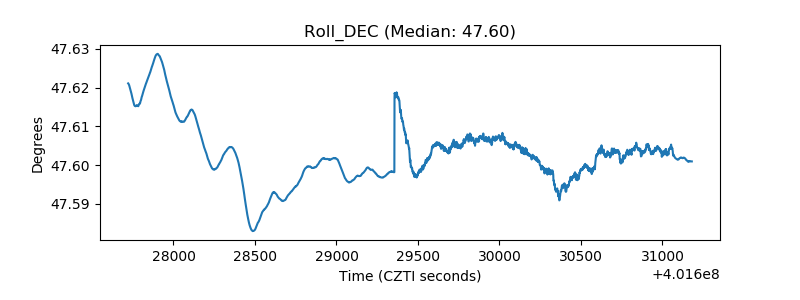 |
| _Roll_RA | 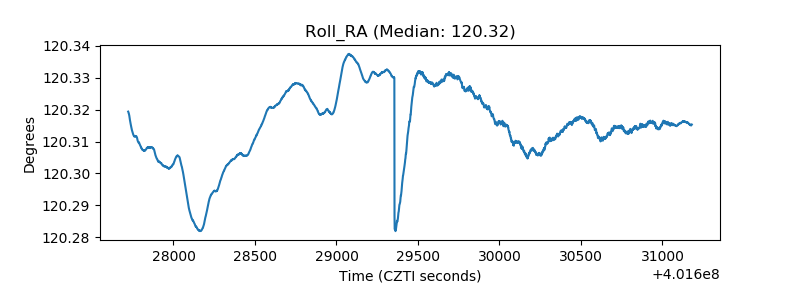 |
| Veto Counter | 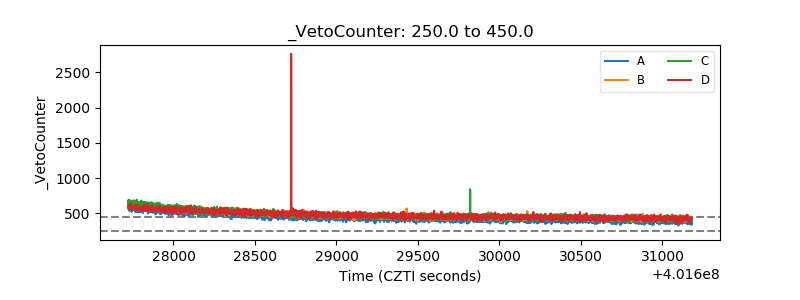 |