| Param | Original file | Final file |
|---|---|---|
| Filename | modeM0/AS1T05_057T01_9000005346cztM0_level2.fits | modeM0/AS1T05_057T01_9000005346cztM0_level2_quad_clean.evt |
| Size (bytes) | 598,435,200 | 582,174,720 |
| Size | 570.7 MB | 555.2 MB |
| Events in quadrant A | 3,635,230 | 3,530,413 |
| Events in quadrant B | 3,487,420 | 3,450,701 |
| Events in quadrant C | 3,582,272 | 3,389,303 |
| Events in quadrant D | 3,067,362 | 2,910,622 |
| Mode M0 | |||
|---|---|---|---|
| Quadrant | BADHDUFLAG | Total packets | Discarded packets |
| A | 0 | 154895 | 0 |
| B | 0 | 145292 | 0 |
| C | 0 | 136784 | 0 |
| D | 0 | 174062 | 0 |
| Mode SS | |||
|---|---|---|---|
| Quadrant | BADHDUFLAG | Total packets | Discarded packets |
| A | 0 | 1298 | 0 |
| B | 0 | 1298 | 0 |
| C | 0 | 1298 | 0 |
| D | 0 | 1298 | 0 |
| Mode M9 | |||
|---|---|---|---|
| Quadrant | BADHDUFLAG | Total packets | Discarded packets |
| A | 0 | 257 | 0 |
| B | 0 | 257 | 0 |
| C | 0 | 257 | 0 |
| D | 0 | 257 | 0 |
| Quadrant | Total seconds | Saturated seconds | Saturation percentage |
|---|---|---|---|
| A | 63418 | 2221 | 3.502160% |
| B | 63418 | 931 | 1.468037% |
| C | 63418 | 425 | 0.670157% |
| D | 63418 | 2765 | 4.359961% |
Noise dominated data is calculated using 1-second bins in cleaned event files. If a bin has >2000 counts, and if more than 50% of those come from <1% of pixels, then it is considered to be noise-dominated and hence unusable.
| Quadrant | # 1 sec bins | Bins with >0 counts | Bins with >2000 counts | High rate bins dominated by noise | Noise dominated (total time) | Noise dominated (detector-on time) | Marked lightcurve |
|---|---|---|---|---|---|---|---|
| A | 87768 | 63407 | 0 | 0 | 0.00% | 0.00% |  |
| B | 87768 | 63391 | 0 | 0 | 0.00% | 0.00% |  |
| C | 87767 | 63402 | 0 | 0 | 0.00% | 0.00% |  |
| D | 87768 | 63395 | 0 | 0 | 0.00% | 0.00% | 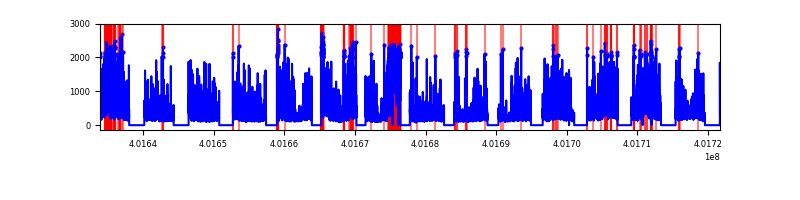 |
Top three noisy pixels from each quadrant. If the there are fewer than three noisy pixels in the level2.evt file, extra rows are filled as -1
| Pixel properties | Quadrant properties | ||||||
|---|---|---|---|---|---|---|---|
| Quadrant | DetID | PixID | Counts | Sigma | Mean | Median | Sigma |
| A | 0 | 29 | 2972 | 8.84 | 950 | 894 | 235.0 |
| A | 9 | 19 | 2954 | 8.77 | 950 | 894 | 235.0 |
| A | 7 | 110 | 2899 | 8.53 | 950 | 894 | 235.0 |
| B | 2 | 9 | 2926 | 11.12 | 926 | 885 | 183.5 |
| B | 3 | 80 | 2716 | 9.98 | 926 | 885 | 183.5 |
| B | 5 | 128 | 2443 | 8.49 | 926 | 885 | 183.5 |
| C | 1 | 81 | 3170 | 9.39 | 948 | 894 | 242.3 |
| C | 1 | 80 | 3007 | 8.72 | 948 | 894 | 242.3 |
| C | 3 | 202 | 2700 | 7.45 | 948 | 894 | 242.3 |
| D | 7 | 3 | 2344 | 6.57 | 881 | 804 | 234.3 |
| D | 10 | 189 | 2281 | 6.3 | 881 | 804 | 234.3 |
| D | 6 | 62 | 2244 | 6.15 | 881 | 804 | 234.3 |
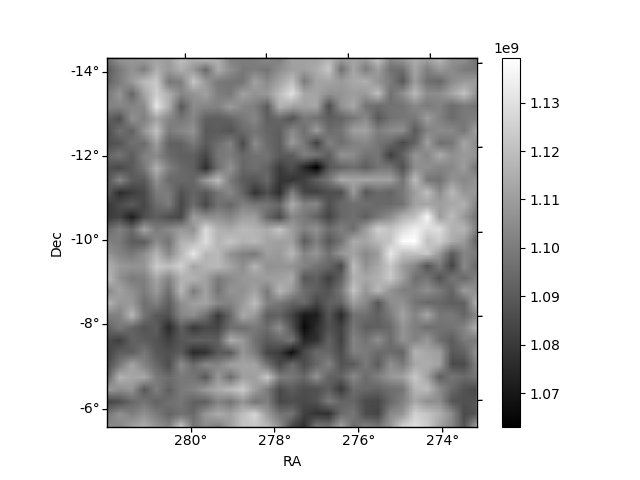
Histogram calculated using DETX and DETY for each event in the final _common_clean file
| Quadrant A |  |
 |
Quadrant B |
|---|---|---|---|
| Quadrant D | 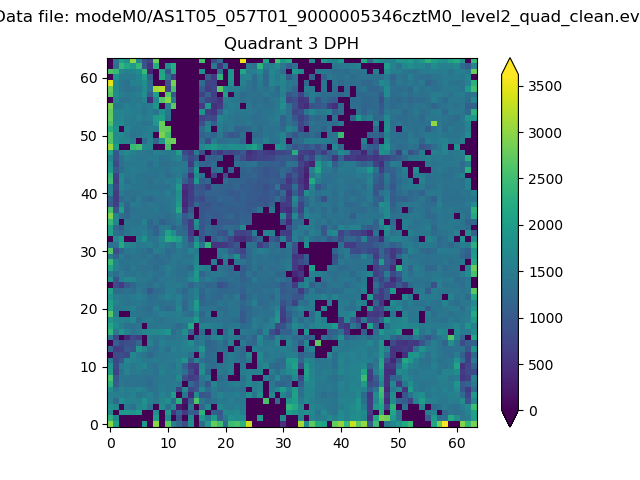 |
 |
Quadrant C |
| Plot type | Count rate plots | Images |
|---|---|---|
| Comparison with Poisson distribution Blue bars denote a histogram of data divided into 1 sec bins. Red curve is a Poisson curve with rate = median count rate of data. |
 |
 |
| Quadrant-wise count rates Data is divided into 100 sec bins |
 |
|
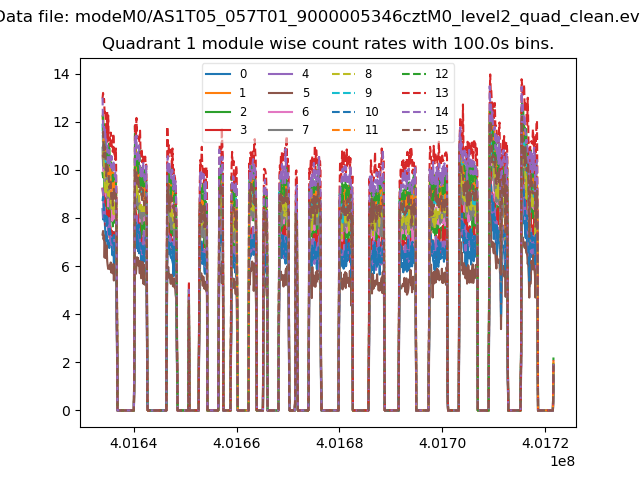
| Module-wise count rates for Quadrant A Data is divided into 100 sec bins |
 |
 |
| Module-wise count rates for Quadrant B Data is divided into 100 sec bins |
 |
 |
| Module-wise count rates for Quadrant C Data is divided into 100 sec bins |
 |
 |
| Module-wise count rates for Quadrant D Data is divided into 100 sec bins |
 |
 |
| Parameter | Plot |
|---|---|
| CZT HV Monitor |  |
| D_VDD | 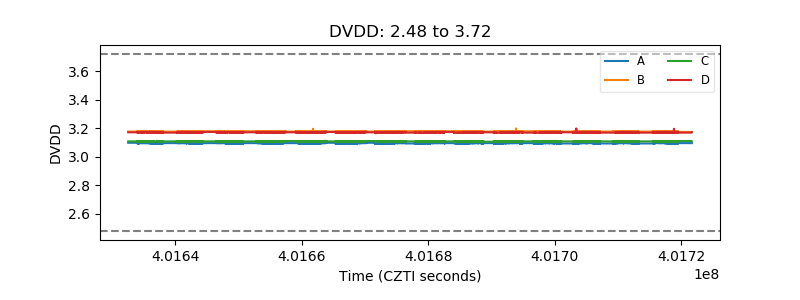 |
| Temperature 1 |  |
| Veto HV Monitor |  |
| Veto LLD |  |
| Alpha Counter | 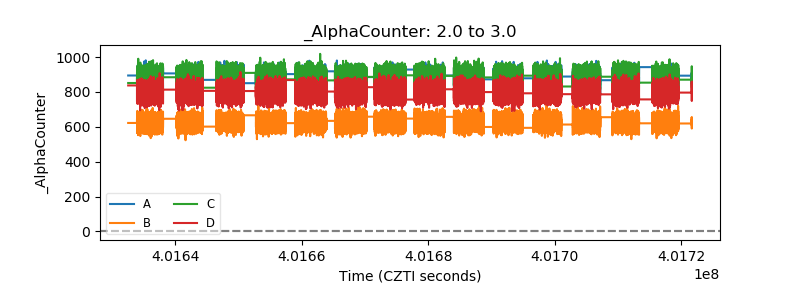 |
| _CPM_Rate |  |
| CZT Counter |  |
| +2.5 Volts monitor |  |
| +5 Volts monitor |  |
| _ROLL_ROT |  |
| _Roll_DEC |  |
| _Roll_RA | 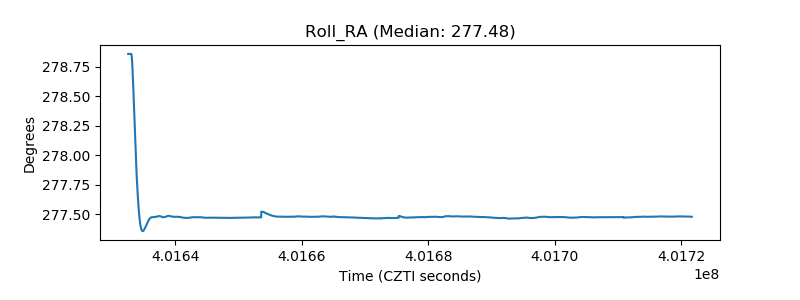 |
| Veto Counter |  |