| Param | Original file | Final file |
|---|---|---|
| Filename | modeM0/AS1T05_057T01_9000005346_37781cztM0_level2.evt | modeM0/AS1T05_057T01_9000005346_37781cztM0_level2_quad_clean.evt |
| Size (bytes) | 163,679,040 | 21,715,200 |
| Size | 156.1 MB | 20.7 MB |
| Events in quadrant A | 2,329,132 | 98,440 |
| Events in quadrant B | 776,030 | 165,631 |
| Events in quadrant C | 757,103 | 159,866 |
| Events in quadrant D | 1,020,768 | 152,256 |
| Mode M0 | |||
|---|---|---|---|
| Quadrant | BADHDUFLAG | Total packets | Discarded packets |
| A | 0 | 7636 | 2 |
| B | 0 | 3071 | 1 |
| C | 0 | 2880 | 1 |
| D | 0 | 3819 | 1 |
| Mode SS | |||
|---|---|---|---|
| Quadrant | BADHDUFLAG | Total packets | Discarded packets |
| A | 0 | 22 | 0 |
| B | 0 | 22 | 0 |
| C | 0 | 22 | 0 |
| D | 0 | 22 | 0 |
| Mode M9 | |||
|---|---|---|---|
| Quadrant | BADHDUFLAG | Total packets | Discarded packets |
| A | 0 | 14 | 0 |
| B | 0 | 14 | 0 |
| C | 0 | 14 | 0 |
| D | 0 | 14 | 0 |
| Quadrant | Total seconds | Saturated seconds | Saturation percentage |
|---|---|---|---|
| A | 1050 | 835 | 79.523810% |
| B | 1050 | 12 | 1.142857% |
| C | 1050 | 36 | 3.428571% |
| D | 1050 | 47 | 4.476190% |
Noise dominated data is calculated using 1-second bins in cleaned event files. If a bin has >2000 counts, and if more than 50% of those come from <1% of pixels, then it is considered to be noise-dominated and hence unusable.
| Quadrant | # 1 sec bins | Bins with >0 counts | Bins with >2000 counts | High rate bins dominated by noise | Noise dominated (total time) | Noise dominated (detector-on time) | Marked lightcurve |
|---|---|---|---|---|---|---|---|
| A | 1049 | 1049 | 806 | 806 | 76.84% | 76.84% | 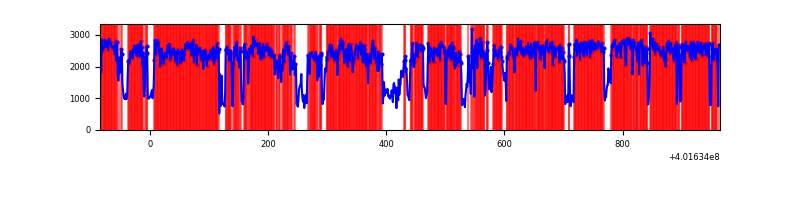 |
| B | 1050 | 1050 | 4 | 4 | 0.38% | 0.38% | 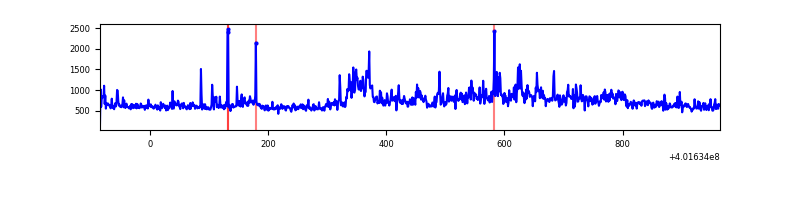 |
| C | 1050 | 1050 | 45 | 45 | 4.29% | 4.29% | 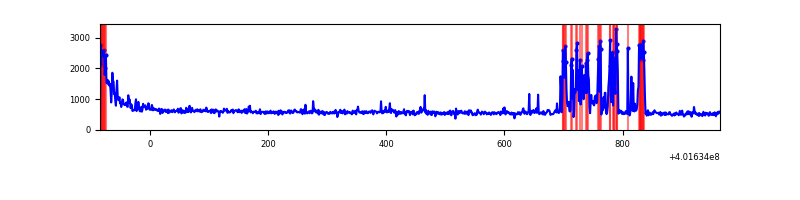 |
| D | 1049 | 1049 | 52 | 52 | 4.96% | 4.96% | 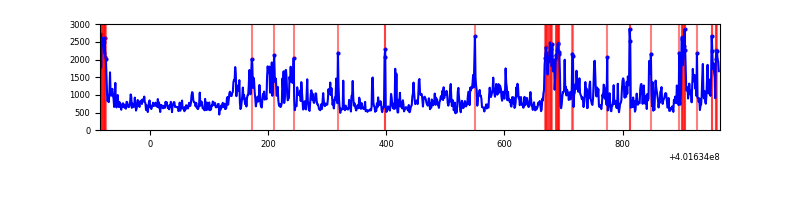 |
Top three noisy pixels from each quadrant. If the there are fewer than three noisy pixels in the level2.evt file, extra rows are filled as -1
| Pixel properties | Quadrant properties | ||||||
|---|---|---|---|---|---|---|---|
| Quadrant | DetID | PixID | Counts | Sigma | Mean | Median | Sigma |
| A | 15 | 222 | 1866468 | 88058.24 | 95 | 94 | 21.2 |
| A | 10 | 83 | 75247 | 3545.83 | 95 | 94 | 21.2 |
| A | 9 | 143 | 9532 | 445.3 | 95 | 94 | 21.2 |
| B | 0 | 189 | 118661 | 4144.77 | 139 | 136 | 28.6 |
| B | 0 | 229 | 51578 | 1798.91 | 139 | 136 | 28.6 |
| B | 0 | 230 | 21067 | 731.95 | 139 | 136 | 28.6 |
| C | 1 | 23 | 127821 | 3905.77 | 133 | 134 | 32.7 |
| C | 15 | 214 | 51702 | 1577.4 | 133 | 134 | 32.7 |
| C | 0 | 10 | 45129 | 1376.34 | 133 | 134 | 32.7 |
| D | 13 | 171 | 201091 | 5698.94 | 138 | 134 | 35.3 |
| D | 12 | 235 | 164874 | 4671.86 | 138 | 134 | 35.3 |
| D | 12 | 233 | 21033 | 592.68 | 138 | 134 | 35.3 |
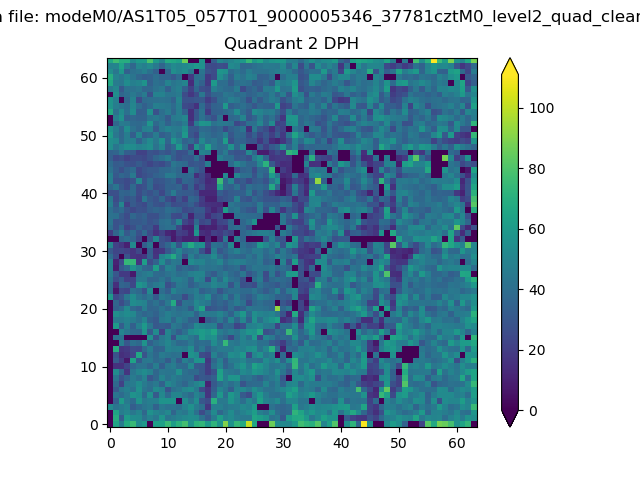
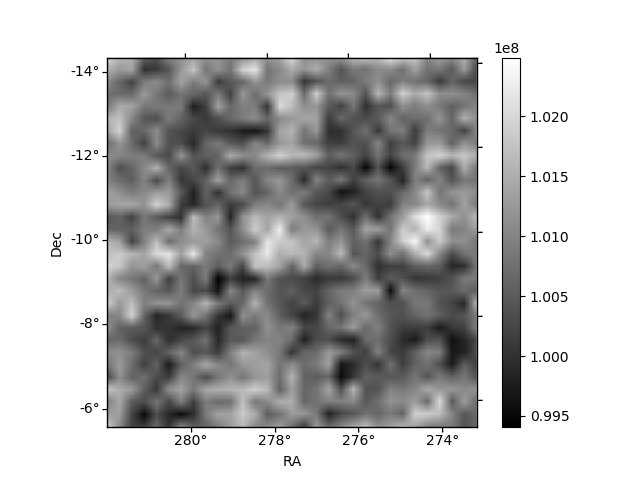
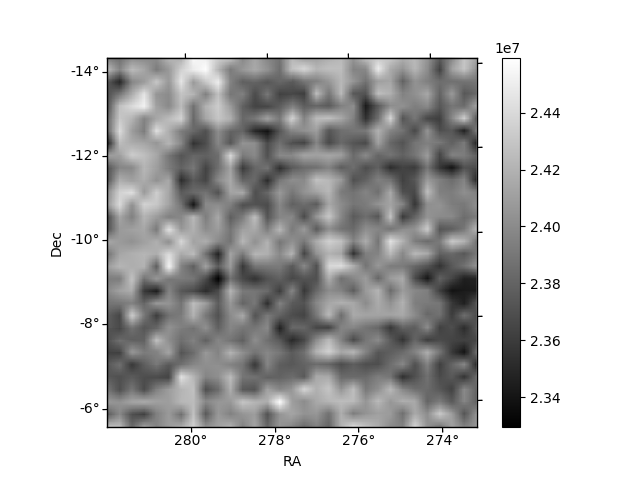
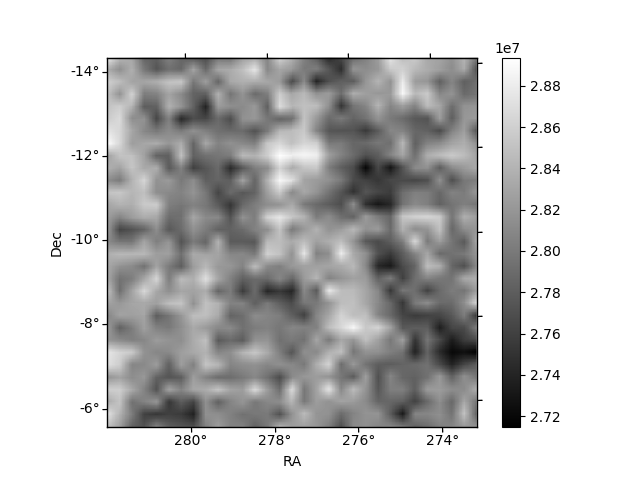
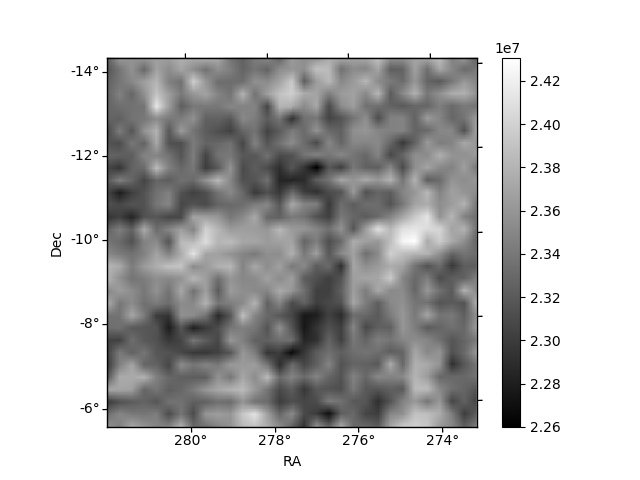
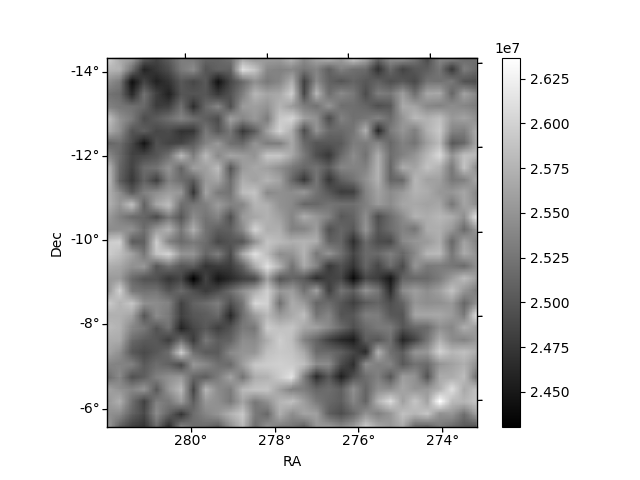
Histogram calculated using DETX and DETY for each event in the final _common_clean file
| Quadrant A | 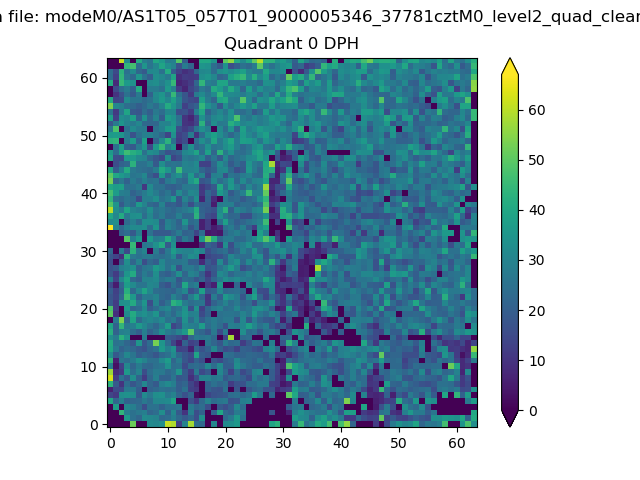 |
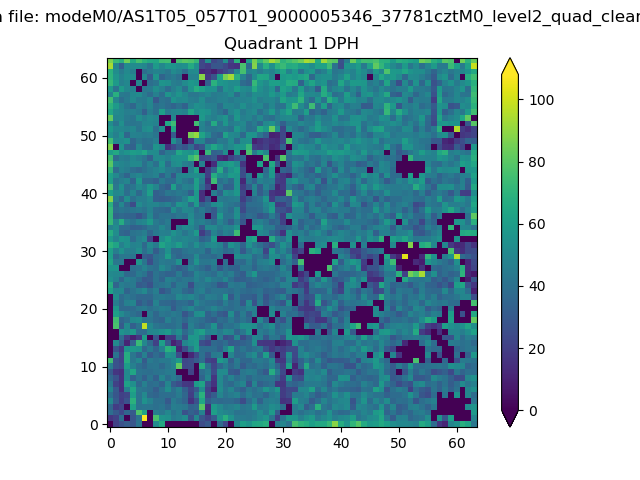 |
Quadrant B |
|---|---|---|---|
| Quadrant D | 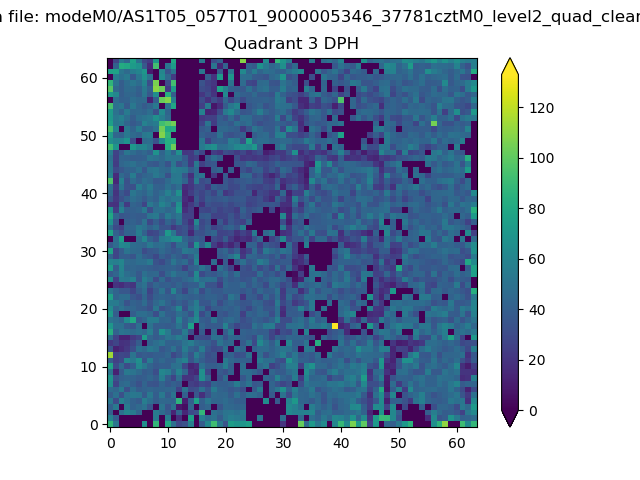 |
 |
Quadrant C |
| Plot type | Count rate plots | Images |
|---|---|---|
| Comparison with Poisson distribution Blue bars denote a histogram of data divided into 1 sec bins. Red curve is a Poisson curve with rate = median count rate of data. |
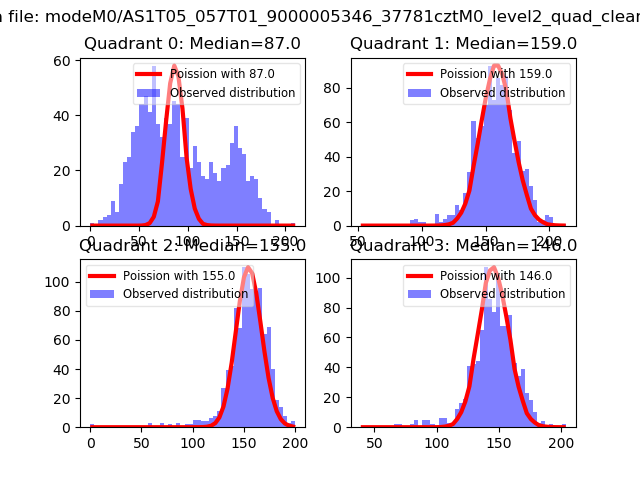 |
 |
| Quadrant-wise count rates Data is divided into 100 sec bins |
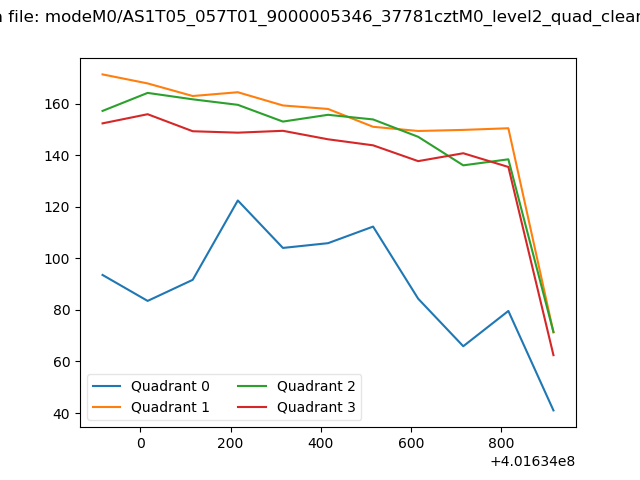 |
|
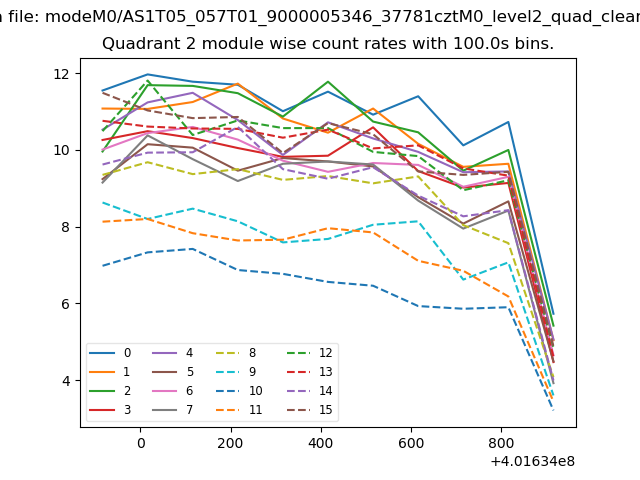
| Module-wise count rates for Quadrant A Data is divided into 100 sec bins |
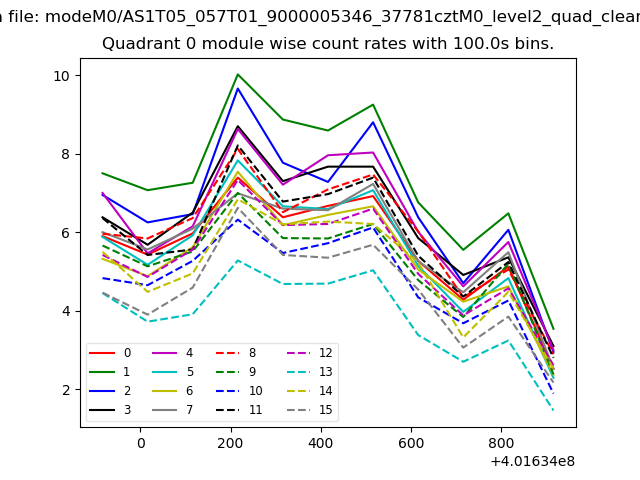 |
 |
| Module-wise count rates for Quadrant B Data is divided into 100 sec bins |
 |
 |
| Module-wise count rates for Quadrant C Data is divided into 100 sec bins |
 |
 |
| Module-wise count rates for Quadrant D Data is divided into 100 sec bins |
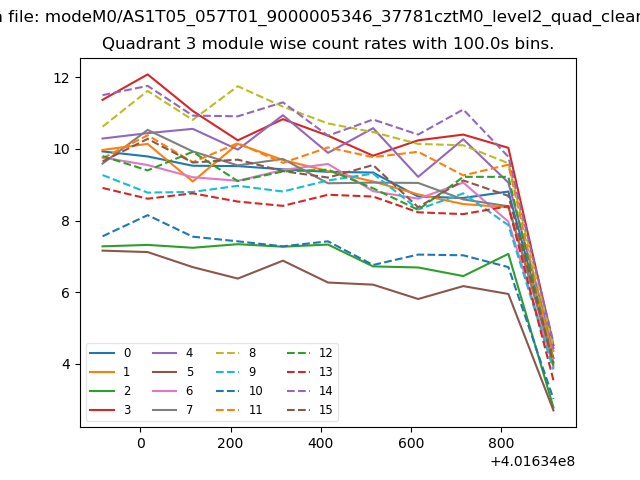 |
 |
| Parameter | Plot |
|---|---|
| CZT HV Monitor | 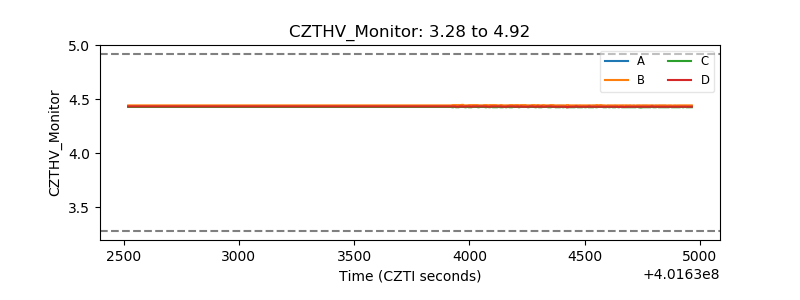 |
| D_VDD | 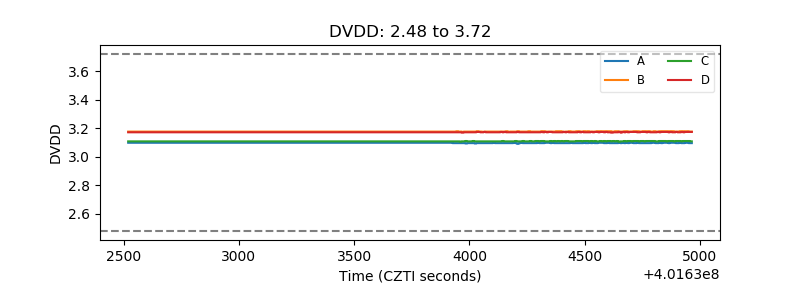 |
| Temperature 1 | 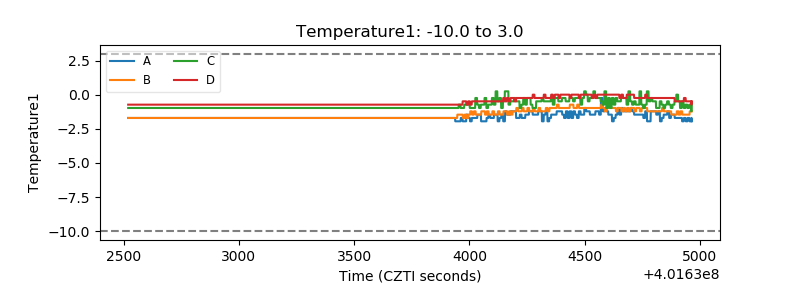 |
| Veto HV Monitor | 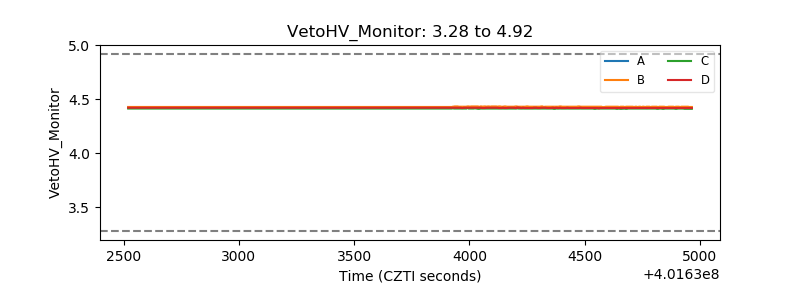 |
| Veto LLD | 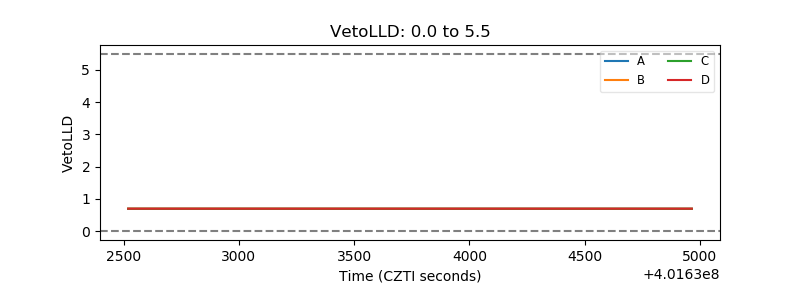 |
| Alpha Counter | 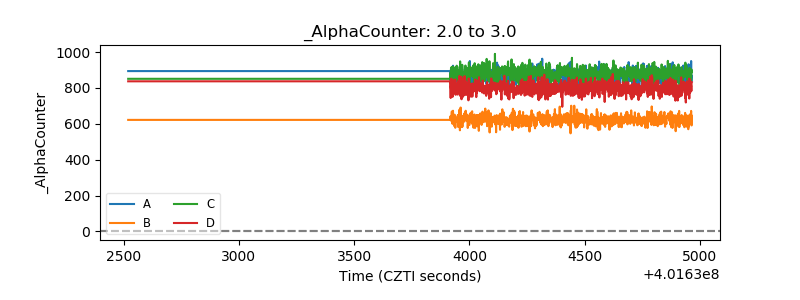 |
| _CPM_Rate | 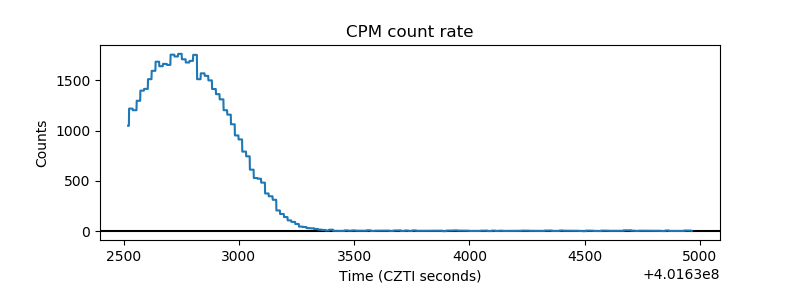 |
| CZT Counter | 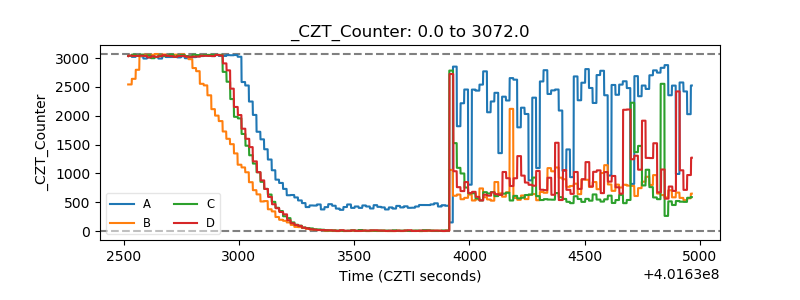 |
| +2.5 Volts monitor | 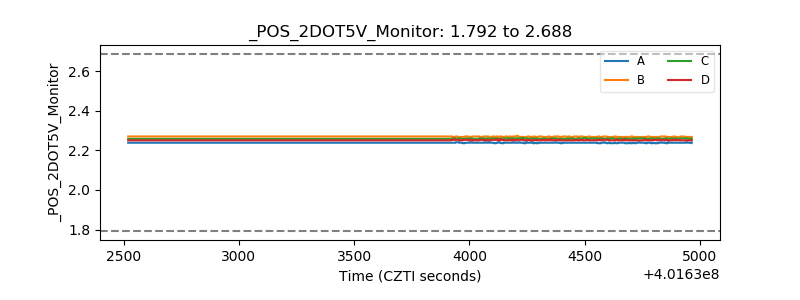 |
| +5 Volts monitor | 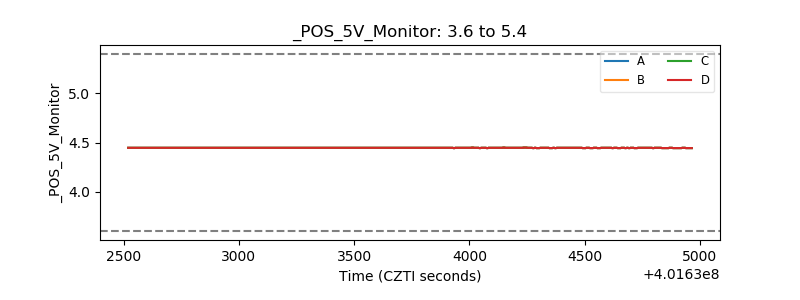 |
| _ROLL_ROT | 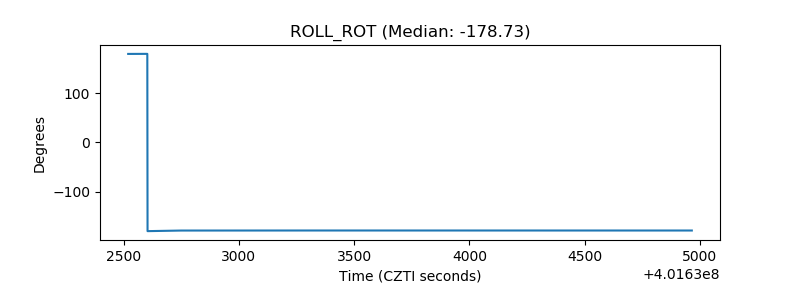 |
| _Roll_DEC | 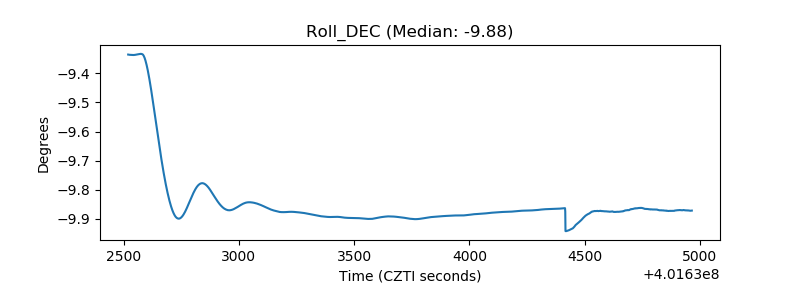 |
| _Roll_RA | 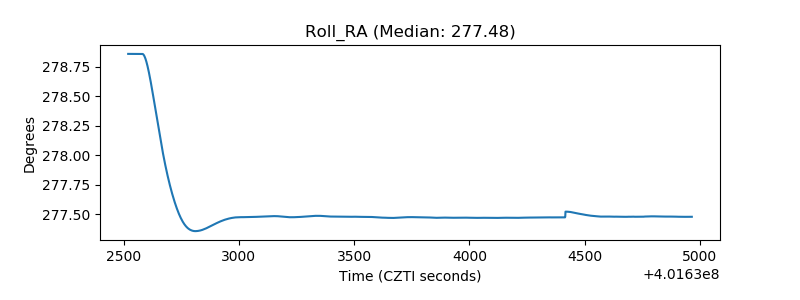 |
| Veto Counter | 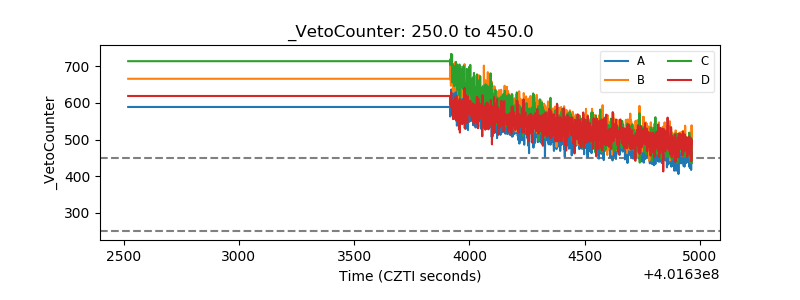 |