| Param | Original file | Final file |
|---|---|---|
| Filename | modeM0/AS1T05_057T01_9000005346_37782cztM0_level2.evt | modeM0/AS1T05_057T01_9000005346_37782cztM0_level2_quad_clean.evt |
| Size (bytes) | 609,399,360 | 78,408,000 |
| Size | 581.2 MB | 74.8 MB |
| Events in quadrant A | 7,746,706 | 413,633 |
| Events in quadrant B | 3,167,172 | 548,314 |
| Events in quadrant C | 2,867,100 | 545,361 |
| Events in quadrant D | 4,332,431 | 511,248 |
| Mode M0 | |||
|---|---|---|---|
| Quadrant | BADHDUFLAG | Total packets | Discarded packets |
| A | 0 | 26502 | 3 |
| B | 0 | 12649 | 2 |
| C | 0 | 11412 | 2 |
| D | 0 | 16352 | 2 |
| Mode SS | |||
|---|---|---|---|
| Quadrant | BADHDUFLAG | Total packets | Discarded packets |
| A | 0 | 106 | 0 |
| B | 0 | 106 | 0 |
| C | 0 | 106 | 0 |
| D | 0 | 106 | 0 |
| Mode M9 | |||
|---|---|---|---|
| Quadrant | BADHDUFLAG | Total packets | Discarded packets |
| A | 0 | 23 | 0 |
| B | 0 | 23 | 0 |
| C | 0 | 23 | 0 |
| D | 0 | 24 | 0 |
| Quadrant | Total seconds | Saturated seconds | Saturation percentage |
|---|---|---|---|
| A | 5056 | 1942 | 38.409810% |
| B | 5056 | 90 | 1.780063% |
| C | 5056 | 64 | 1.265823% |
| D | 5056 | 153 | 3.026108% |
Noise dominated data is calculated using 1-second bins in cleaned event files. If a bin has >2000 counts, and if more than 50% of those come from <1% of pixels, then it is considered to be noise-dominated and hence unusable.
| Quadrant | # 1 sec bins | Bins with >0 counts | Bins with >2000 counts | High rate bins dominated by noise | Noise dominated (total time) | Noise dominated (detector-on time) | Marked lightcurve |
|---|---|---|---|---|---|---|---|
| A | 7209 | 5057 | 1980 | 1980 | 27.47% | 39.15% | 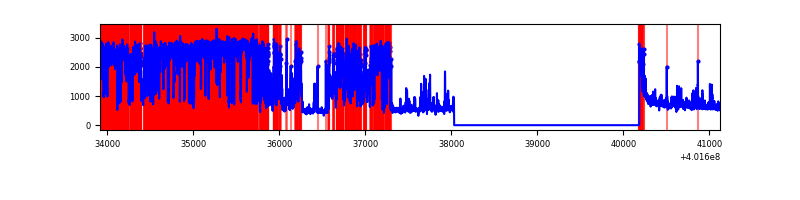 |
| B | 7209 | 5057 | 75 | 75 | 1.04% | 1.48% | 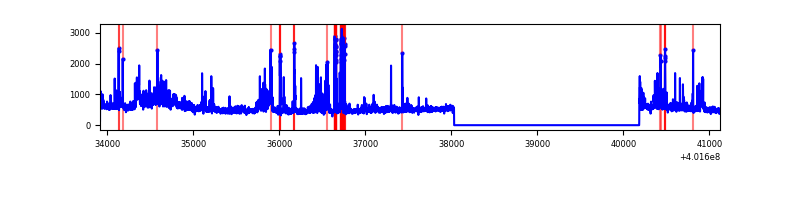 |
| C | 7209 | 5057 | 73 | 73 | 1.01% | 1.44% | 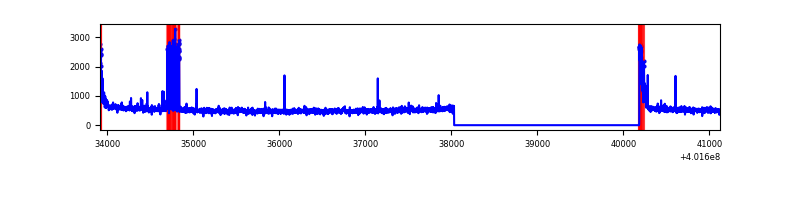 |
| D | 7209 | 5057 | 201 | 201 | 2.79% | 3.97% | 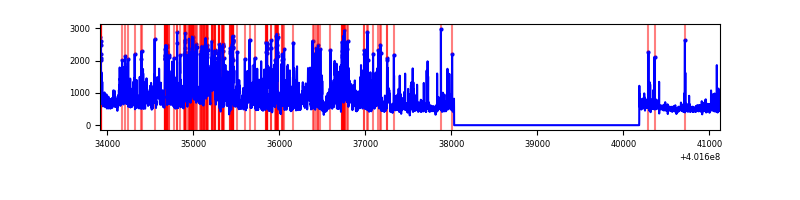 |
Top three noisy pixels from each quadrant. If the there are fewer than three noisy pixels in the level2.evt file, extra rows are filled as -1
| Pixel properties | Quadrant properties | ||||||
|---|---|---|---|---|---|---|---|
| Quadrant | DetID | PixID | Counts | Sigma | Mean | Median | Sigma |
| A | 15 | 222 | 5416733 | 51628.89 | 516 | 509 | 104.9 |
| A | 10 | 83 | 286294 | 2724.18 | 516 | 509 | 104.9 |
| A | 9 | 143 | 19207 | 178.23 | 516 | 509 | 104.9 |
| B | 4 | 81 | 219606 | 1919.39 | 610 | 596 | 114.1 |
| B | 0 | 189 | 175369 | 1531.7 | 610 | 596 | 114.1 |
| B | 0 | 229 | 153907 | 1343.61 | 610 | 596 | 114.1 |
| C | 15 | 214 | 233835 | 1702.5 | 593 | 598 | 137.0 |
| C | 0 | 10 | 149346 | 1085.78 | 593 | 598 | 137.0 |
| C | 1 | 23 | 138535 | 1006.86 | 593 | 598 | 137.0 |
| D | 12 | 235 | 935437 | 6430.22 | 597 | 583 | 145.4 |
| D | 13 | 171 | 513410 | 3527.39 | 597 | 583 | 145.4 |
| D | 13 | 249 | 138013 | 945.29 | 597 | 583 | 145.4 |
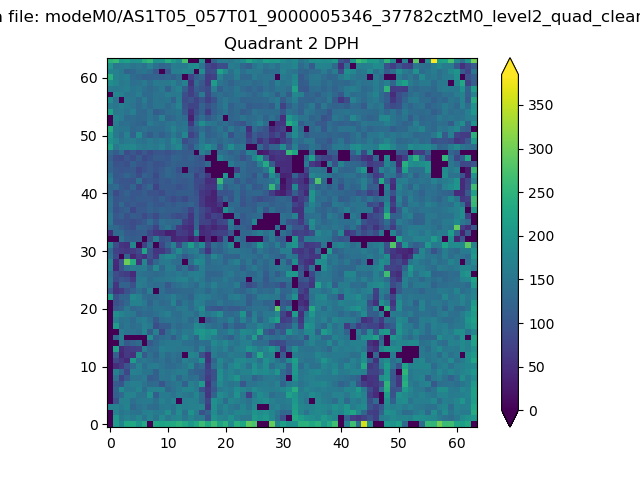
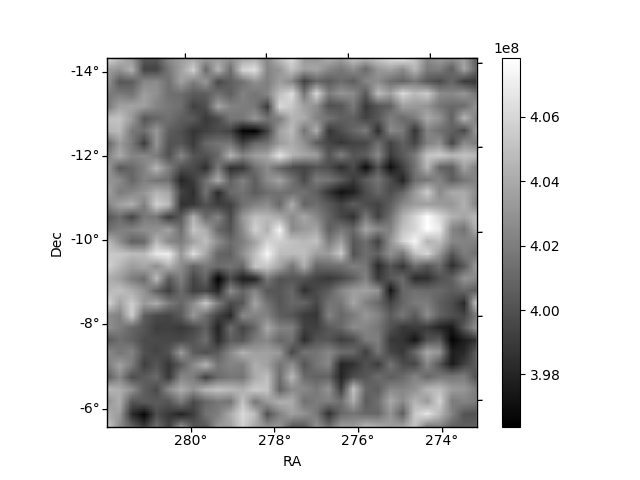
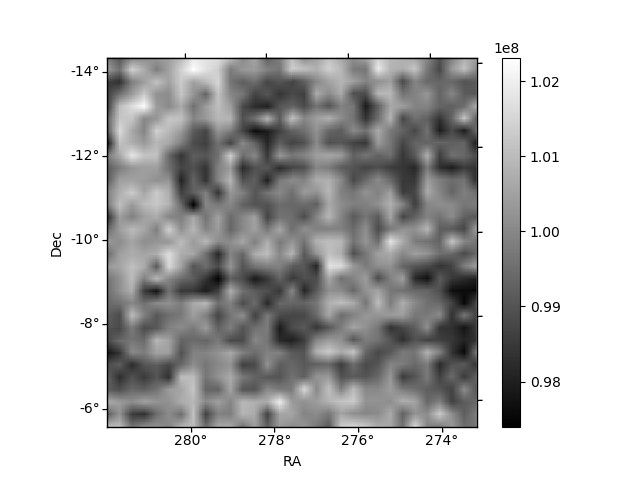
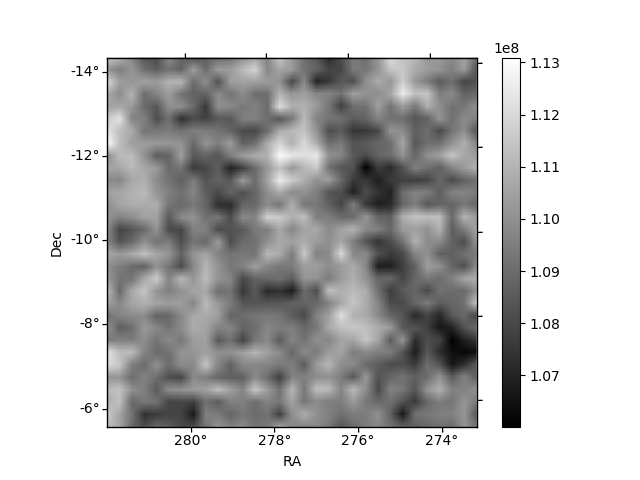
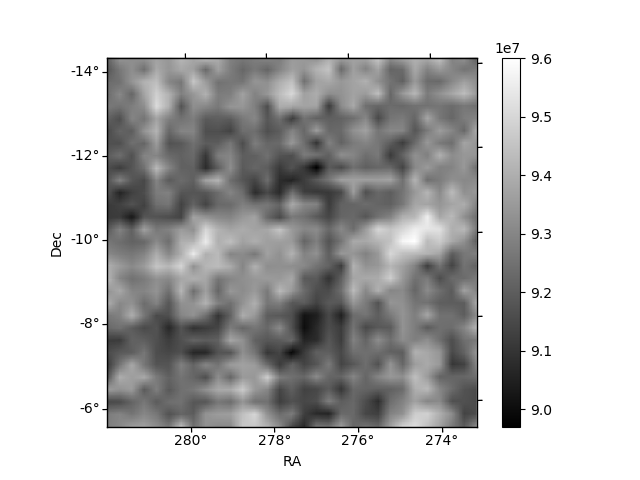
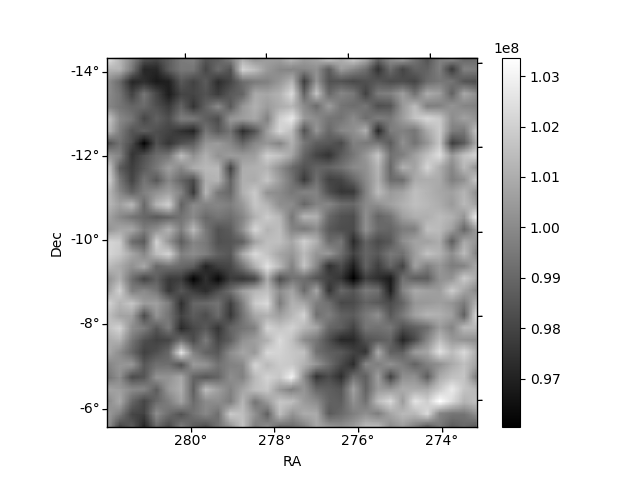
Histogram calculated using DETX and DETY for each event in the final _common_clean file
| Quadrant A | 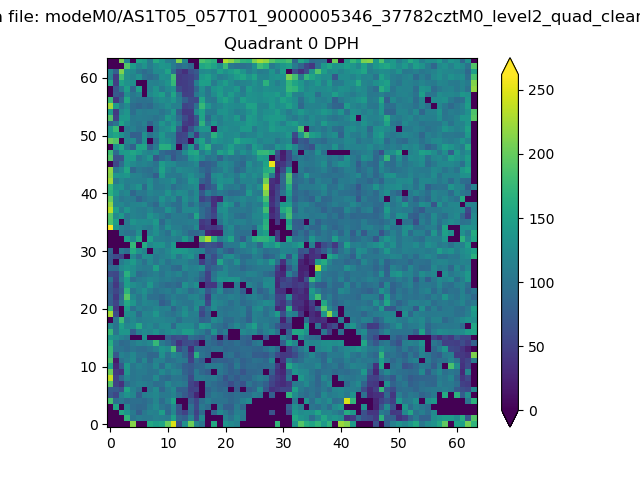 |
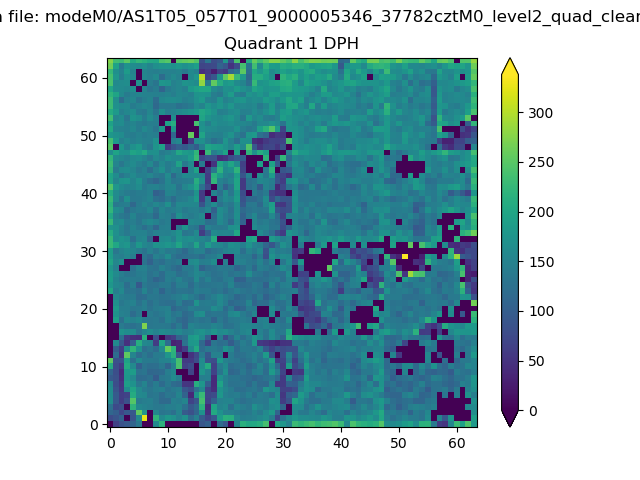 |
Quadrant B |
|---|---|---|---|
| Quadrant D | 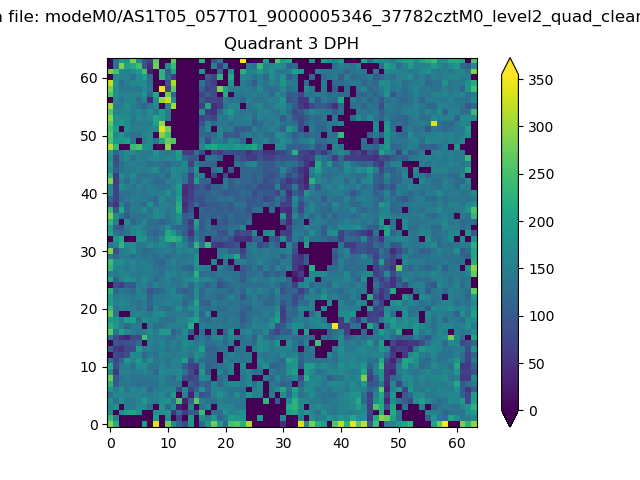 |
 |
Quadrant C |
| Plot type | Count rate plots | Images |
|---|---|---|
| Comparison with Poisson distribution Blue bars denote a histogram of data divided into 1 sec bins. Red curve is a Poisson curve with rate = median count rate of data. |
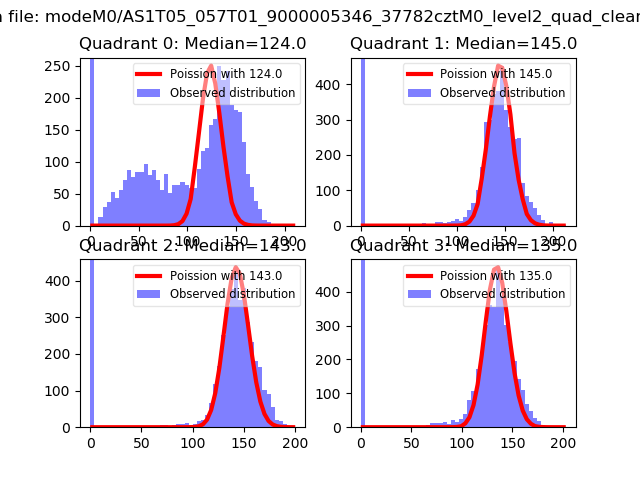 |
 |
| Quadrant-wise count rates Data is divided into 100 sec bins |
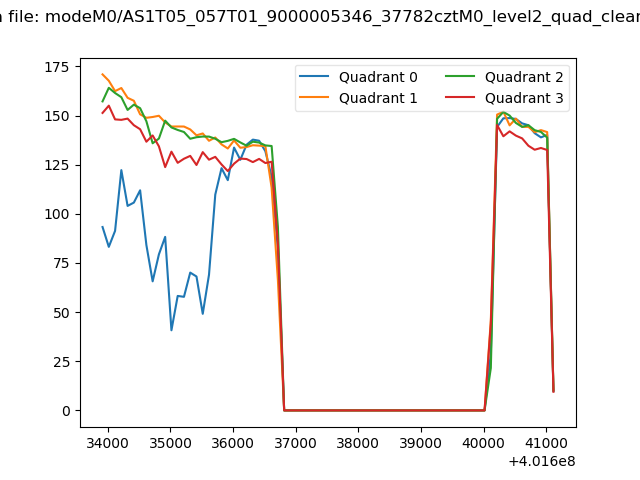 |
|
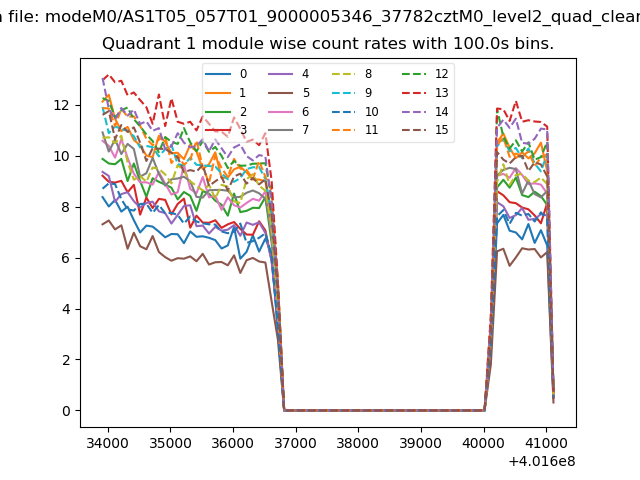
| Module-wise count rates for Quadrant A Data is divided into 100 sec bins |
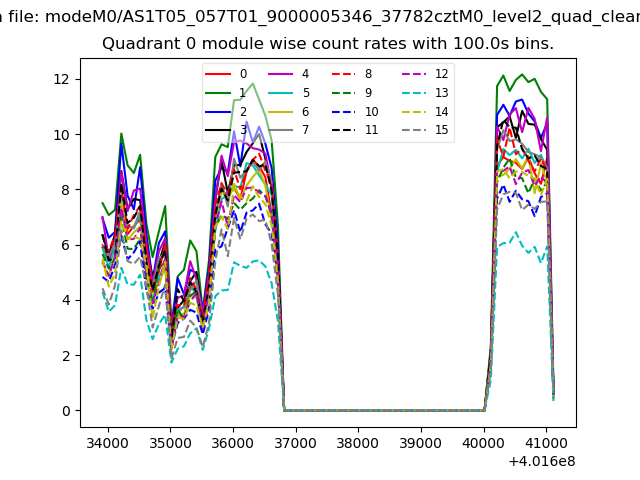 |
 |
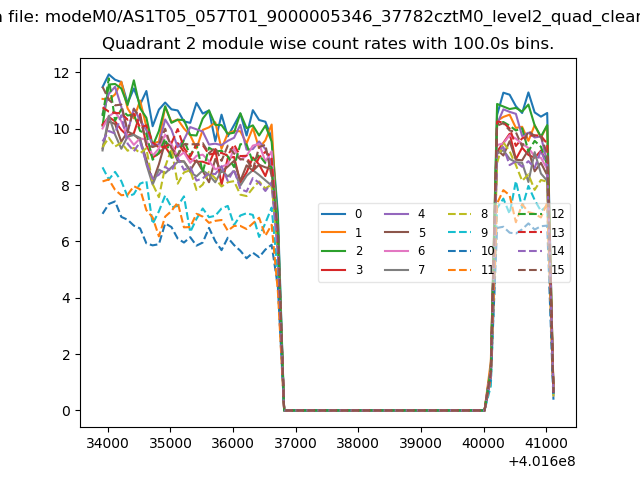
| Module-wise count rates for Quadrant B Data is divided into 100 sec bins |
 |
 |
| Module-wise count rates for Quadrant C Data is divided into 100 sec bins |
 |
 |
| Module-wise count rates for Quadrant D Data is divided into 100 sec bins |
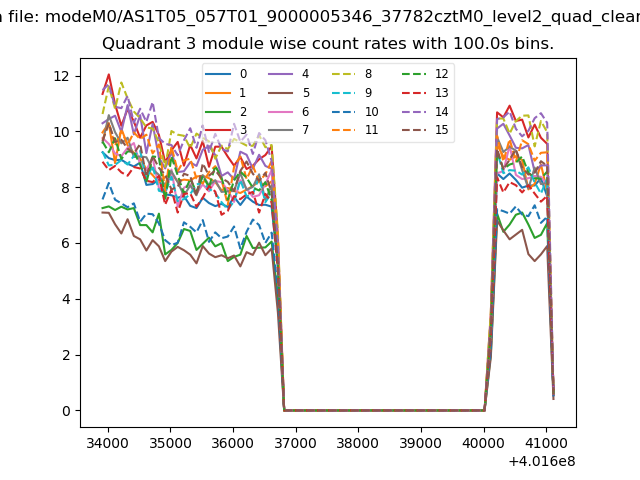 |
 |
| Parameter | Plot |
|---|---|
| CZT HV Monitor | 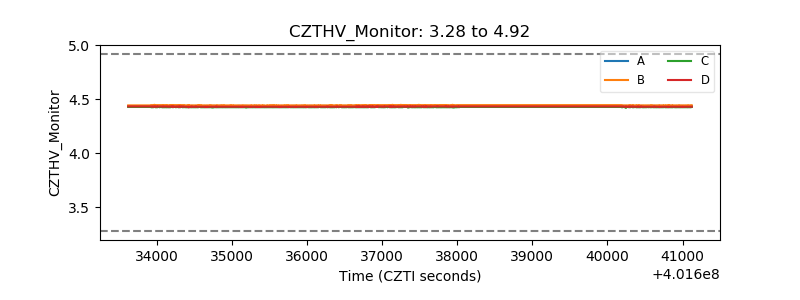 |
| D_VDD | 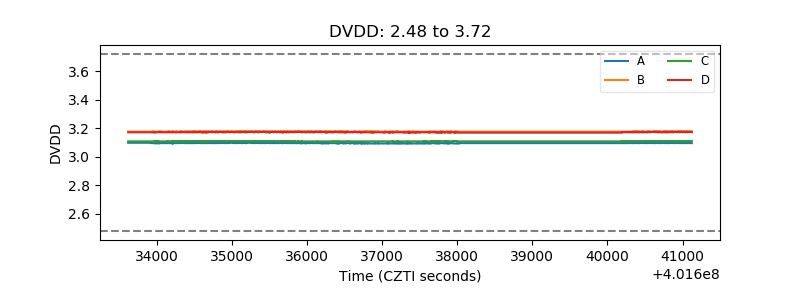 |
| Temperature 1 | 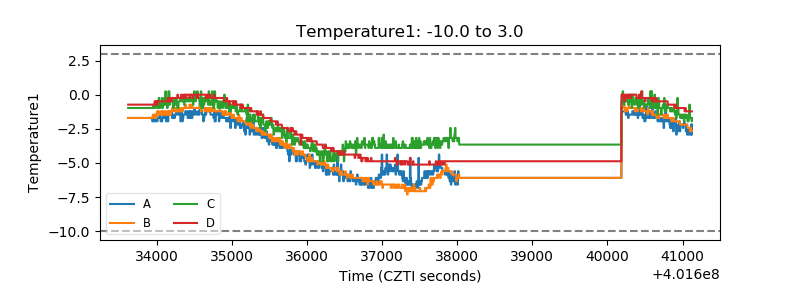 |
| Veto HV Monitor | 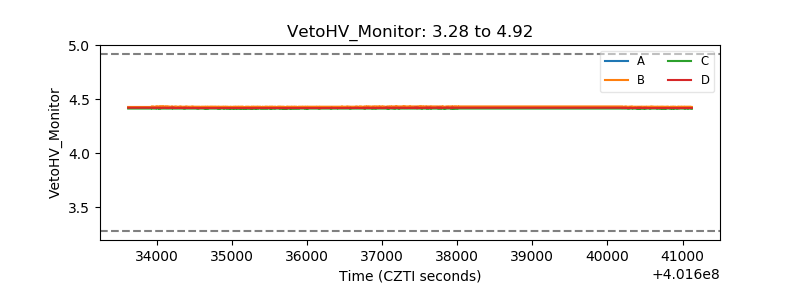 |
| Veto LLD | 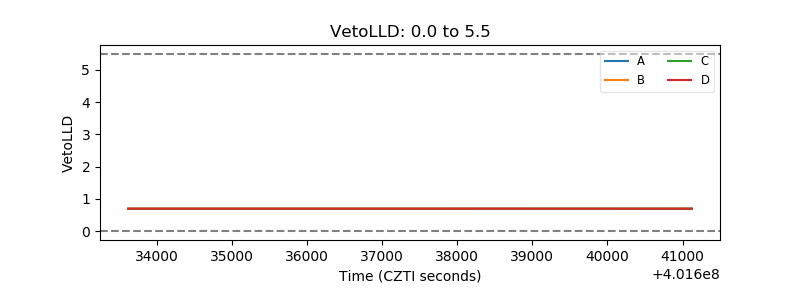 |
| Alpha Counter | 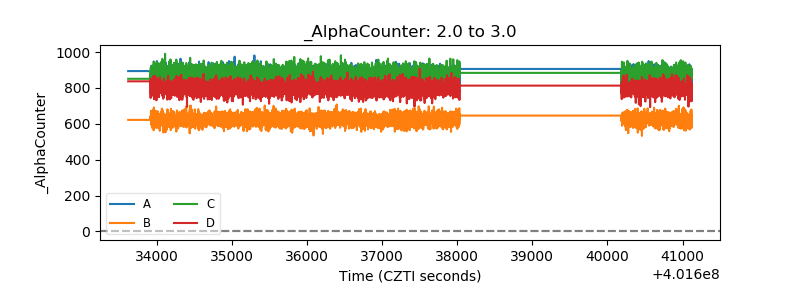 |
| _CPM_Rate | 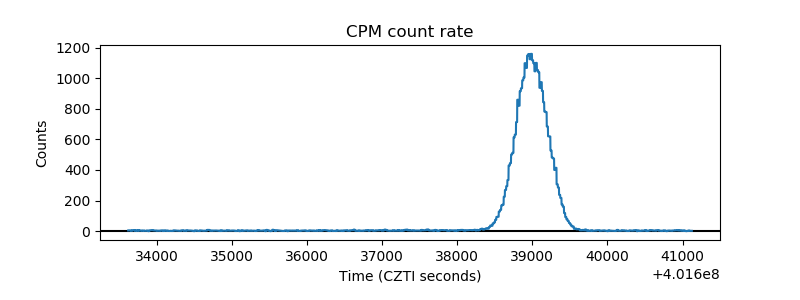 |
| CZT Counter | 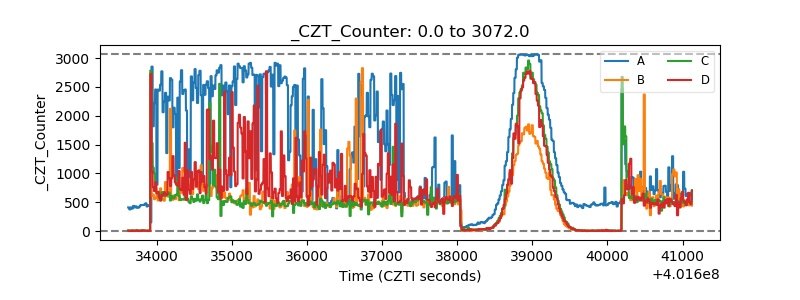 |
| +2.5 Volts monitor | 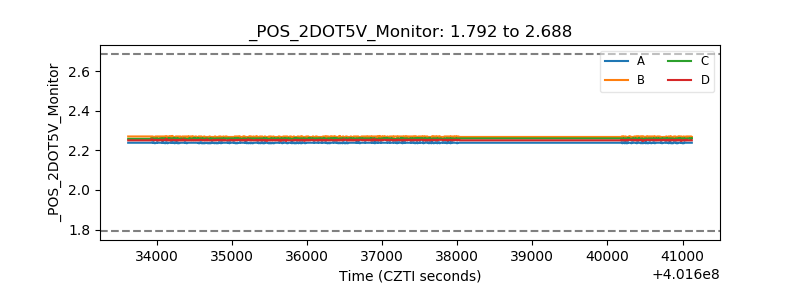 |
| +5 Volts monitor | 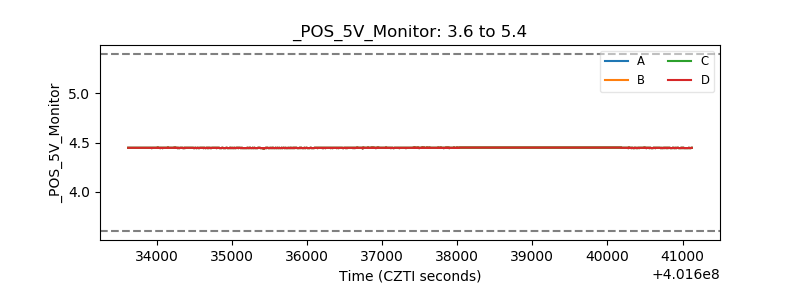 |
| _ROLL_ROT | 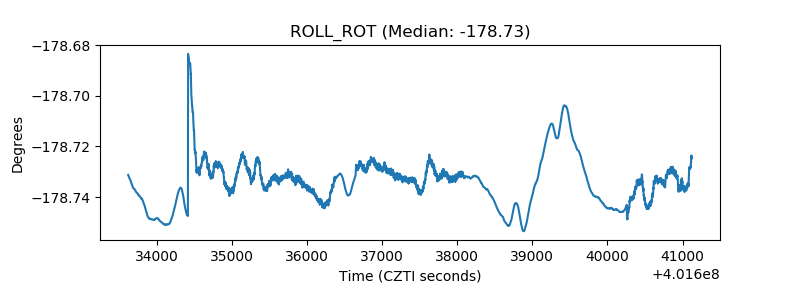 |
| _Roll_DEC | 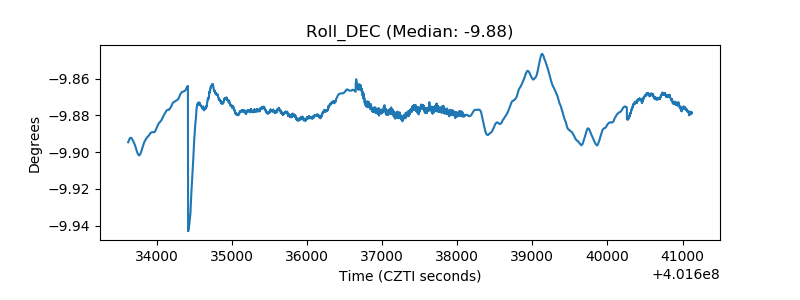 |
| _Roll_RA | 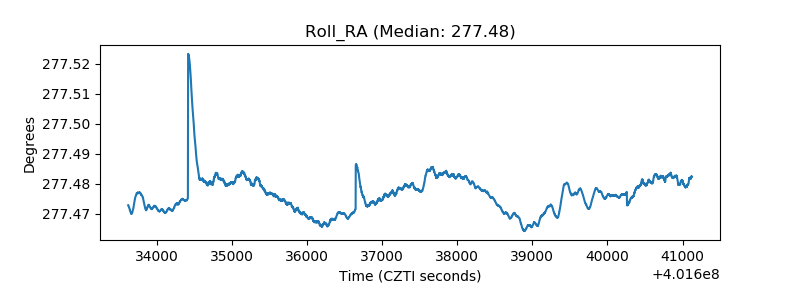 |
| Veto Counter | 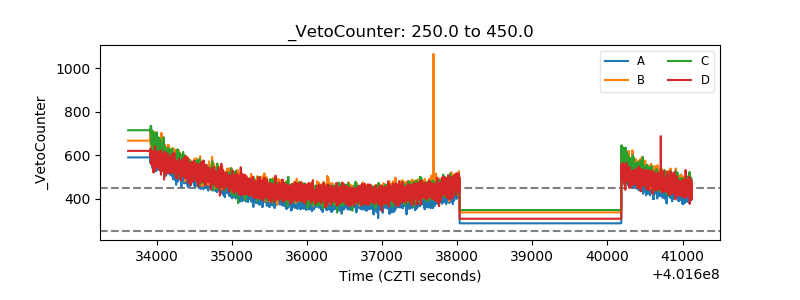 |