| Param | Original file | Final file |
|---|---|---|
| Filename | modeM0/AS1T05_057T01_9000005346_37783cztM0_level2.evt | modeM0/AS1T05_057T01_9000005346_37783cztM0_level2_quad_clean.evt |
| Size (bytes) | 405,095,040 | 72,460,800 |
| Size | 386.3 MB | 69.1 MB |
| Events in quadrant A | 3,453,338 | 464,194 |
| Events in quadrant B | 2,927,836 | 464,785 |
| Events in quadrant C | 2,720,691 | 462,367 |
| Events in quadrant D | 2,818,113 | 443,568 |
| Mode M0 | |||
|---|---|---|---|
| Quadrant | BADHDUFLAG | Total packets | Discarded packets |
| A | 0 | 13677 | 3 |
| B | 0 | 11897 | 2 |
| C | 0 | 11130 | 2 |
| D | 0 | 11694 | 2 |
| Mode SS | |||
|---|---|---|---|
| Quadrant | BADHDUFLAG | Total packets | Discarded packets |
| A | 0 | 106 | 0 |
| B | 0 | 106 | 0 |
| C | 0 | 106 | 0 |
| D | 0 | 106 | 0 |
| Mode M9 | |||
|---|---|---|---|
| Quadrant | BADHDUFLAG | Total packets | Discarded packets |
| A | 0 | 29 | 0 |
| B | 0 | 29 | 0 |
| C | 0 | 29 | 0 |
| D | 0 | 30 | 0 |
| Quadrant | Total seconds | Saturated seconds | Saturation percentage |
|---|---|---|---|
| A | 5123 | 93 | 1.815343% |
| B | 5123 | 104 | 2.030061% |
| C | 5123 | 64 | 1.249268% |
| D | 5123 | 19 | 0.370876% |
Noise dominated data is calculated using 1-second bins in cleaned event files. If a bin has >2000 counts, and if more than 50% of those come from <1% of pixels, then it is considered to be noise-dominated and hence unusable.
| Quadrant | # 1 sec bins | Bins with >0 counts | Bins with >2000 counts | High rate bins dominated by noise | Noise dominated (total time) | Noise dominated (detector-on time) | Marked lightcurve |
|---|---|---|---|---|---|---|---|
| A | 7246 | 5124 | 79 | 79 | 1.09% | 1.54% |  |
| B | 7246 | 5124 | 90 | 90 | 1.24% | 1.76% | 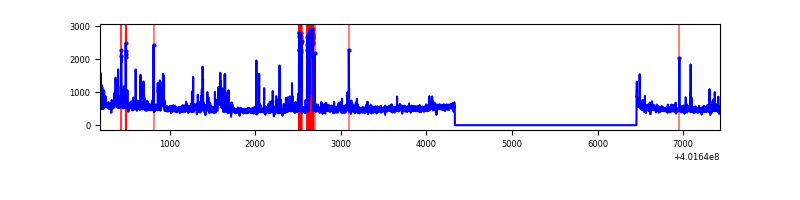 |
| C | 7246 | 5124 | 64 | 64 | 0.88% | 1.25% | 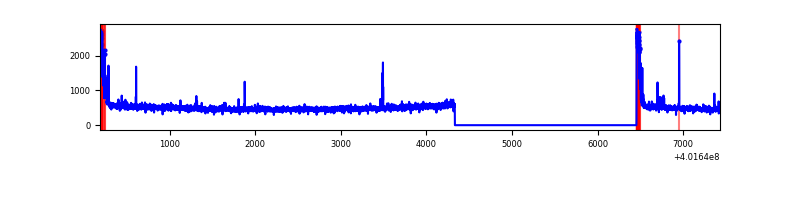 |
| D | 7246 | 5124 | 23 | 23 | 0.32% | 0.45% | 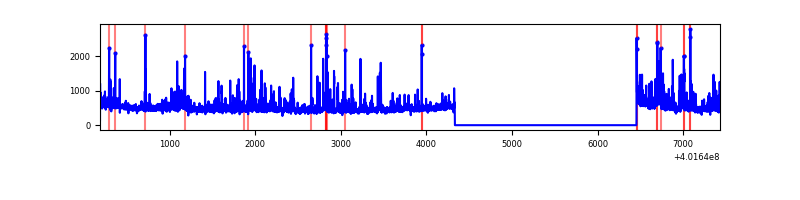 |
Top three noisy pixels from each quadrant. If the there are fewer than three noisy pixels in the level2.evt file, extra rows are filled as -1
| Pixel properties | Quadrant properties | ||||||
|---|---|---|---|---|---|---|---|
| Quadrant | DetID | PixID | Counts | Sigma | Mean | Median | Sigma |
| A | 15 | 222 | 739880 | 6073.51 | 598 | 589 | 121.7 |
| A | 10 | 83 | 351490 | 2882.76 | 598 | 589 | 121.7 |
| A | 9 | 143 | 15579 | 123.15 | 598 | 589 | 121.7 |
| B | 4 | 81 | 305625 | 2715.11 | 591 | 576 | 112.4 |
| B | 0 | 229 | 63353 | 558.75 | 591 | 576 | 112.4 |
| B | 5 | 172 | 60050 | 529.35 | 591 | 576 | 112.4 |
| C | 15 | 214 | 234014 | 1740.15 | 576 | 583 | 134.1 |
| C | 0 | 10 | 200974 | 1493.84 | 576 | 583 | 134.1 |
| C | 1 | 23 | 13308 | 94.86 | 576 | 583 | 134.1 |
| D | 2 | 250 | 80216 | 556.9 | 582 | 567 | 143.0 |
| D | 13 | 249 | 75574 | 524.44 | 582 | 567 | 143.0 |
| D | 2 | 153 | 72358 | 501.96 | 582 | 567 | 143.0 |
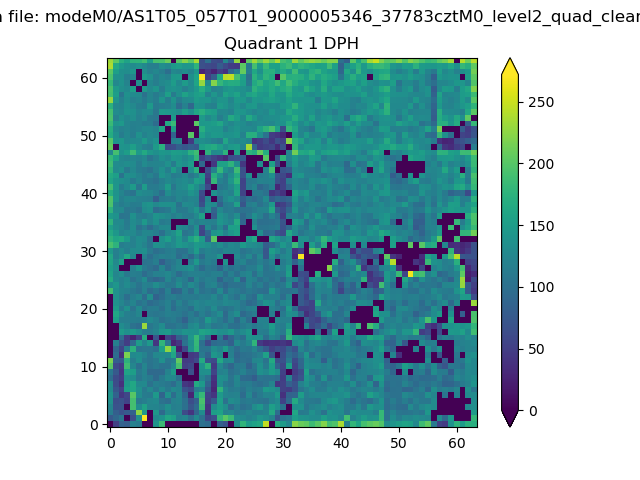
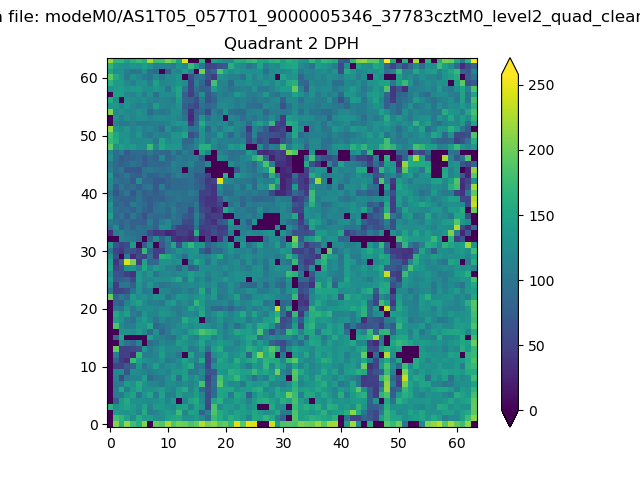
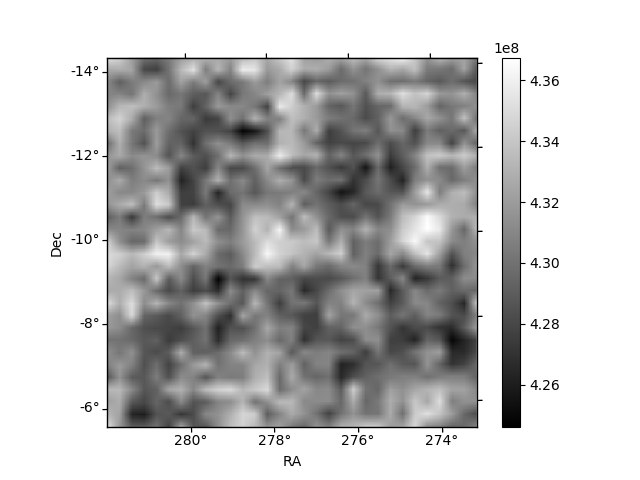
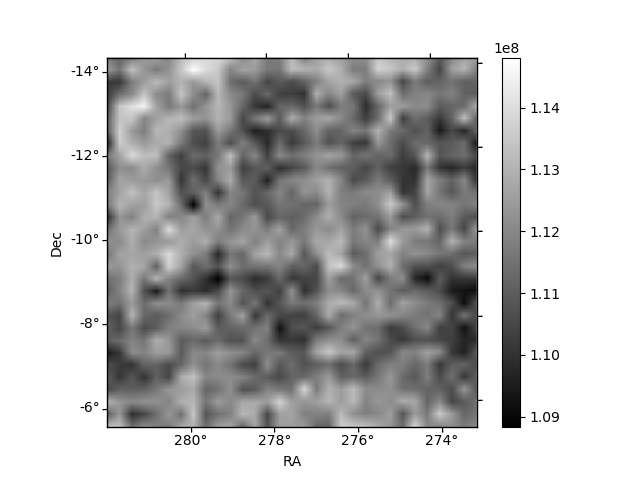
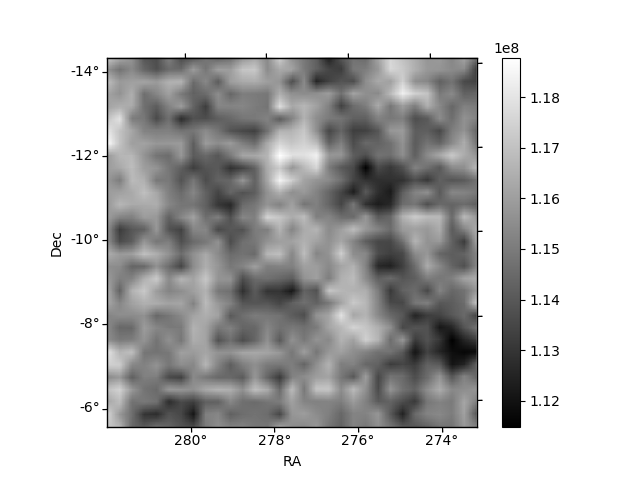
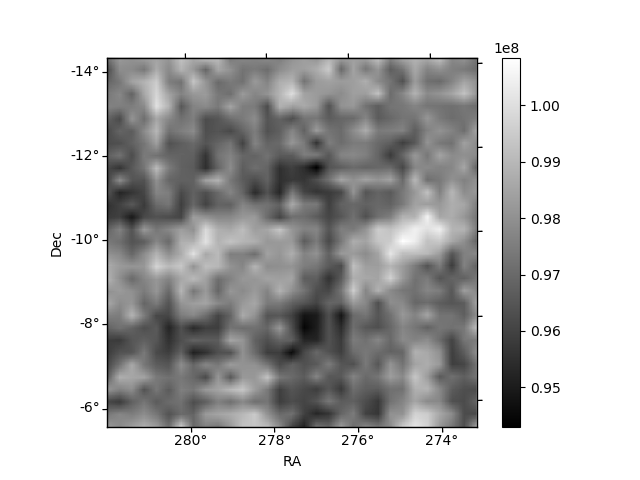
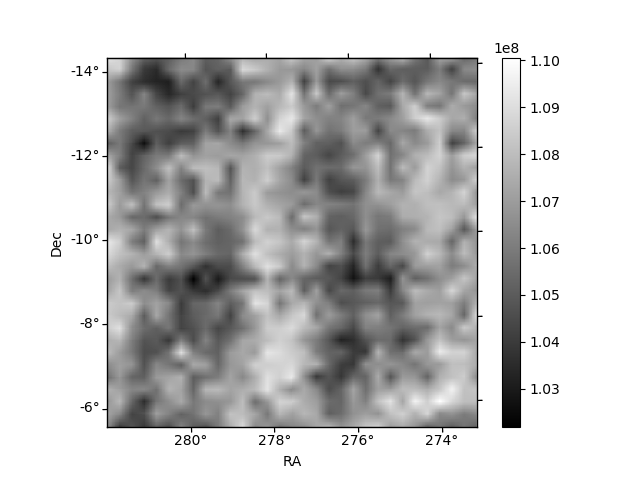
Histogram calculated using DETX and DETY for each event in the final _common_clean file
| Quadrant A | 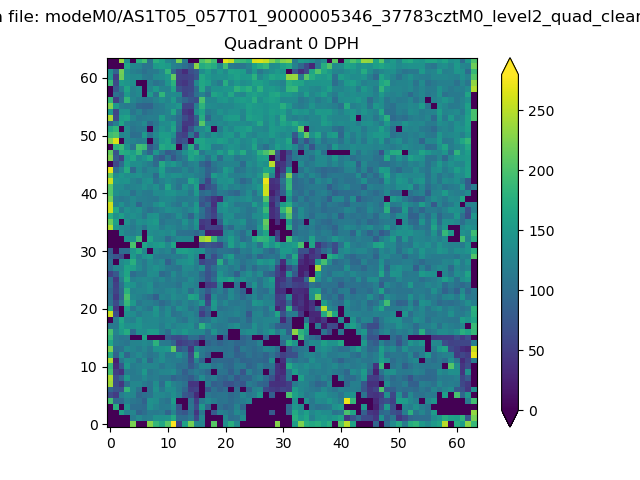 |
 |
Quadrant B |
|---|---|---|---|
| Quadrant D | 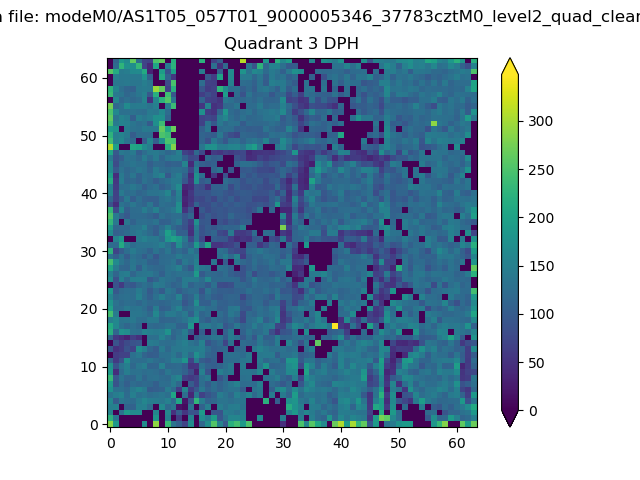 |
 |
Quadrant C |
| Plot type | Count rate plots | Images |
|---|---|---|
| Comparison with Poisson distribution Blue bars denote a histogram of data divided into 1 sec bins. Red curve is a Poisson curve with rate = median count rate of data. |
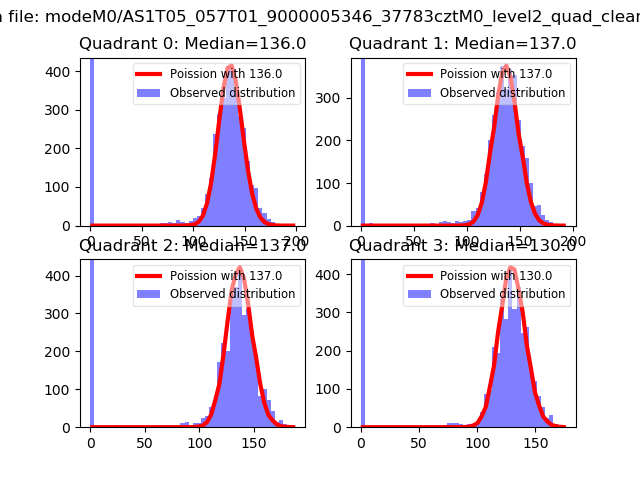 |
 |
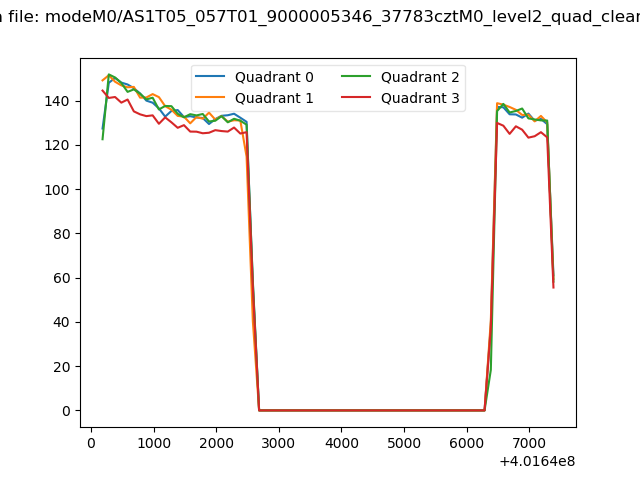
| Quadrant-wise count rates Data is divided into 100 sec bins |
 |
|
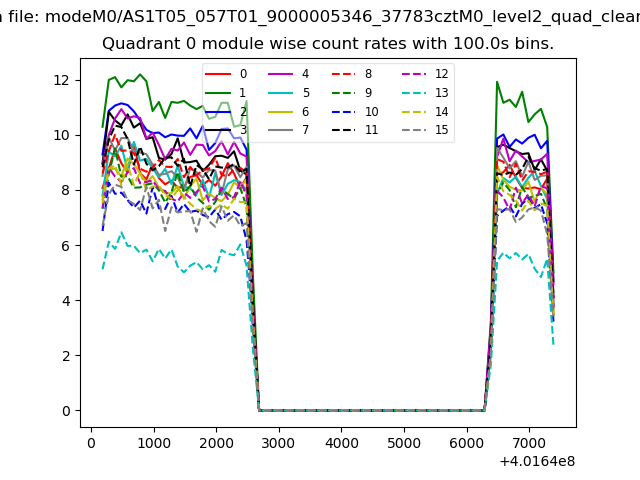
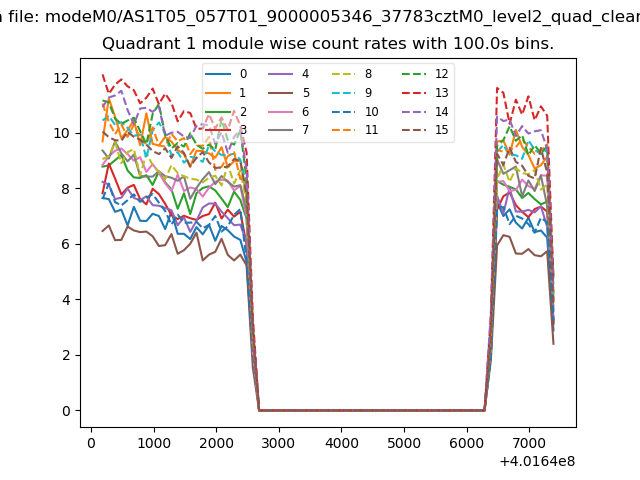
| Module-wise count rates for Quadrant A Data is divided into 100 sec bins |
 |
 |
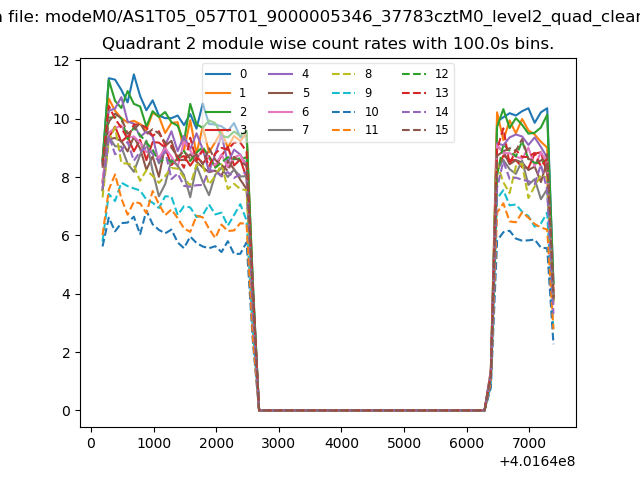
| Module-wise count rates for Quadrant B Data is divided into 100 sec bins |
 |
 |
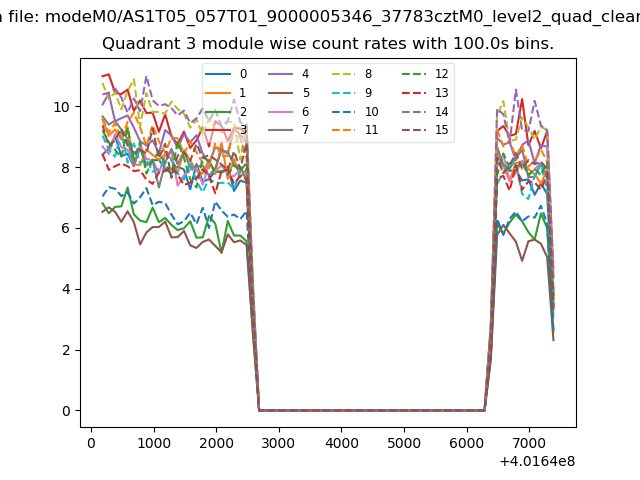
| Module-wise count rates for Quadrant C Data is divided into 100 sec bins |
 |
 |
| Module-wise count rates for Quadrant D Data is divided into 100 sec bins |
 |
 |
| Parameter | Plot |
|---|---|
| CZT HV Monitor | 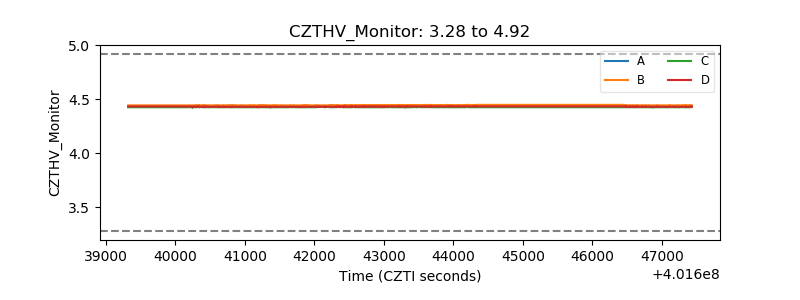 |
| D_VDD | 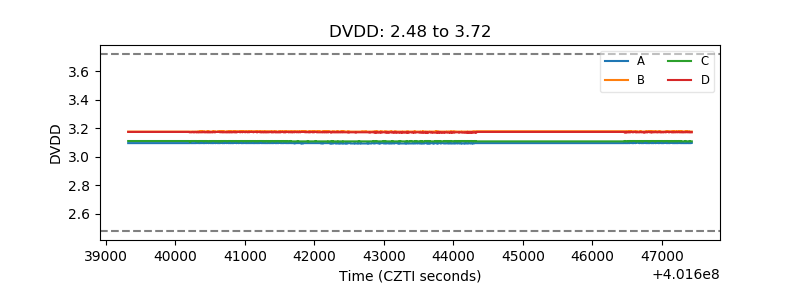 |
| Temperature 1 | 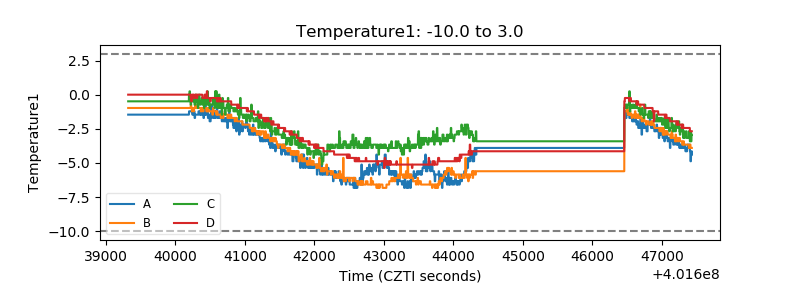 |
| Veto HV Monitor | 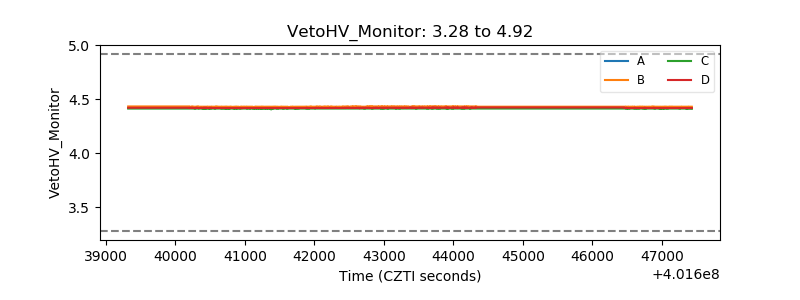 |
| Veto LLD | 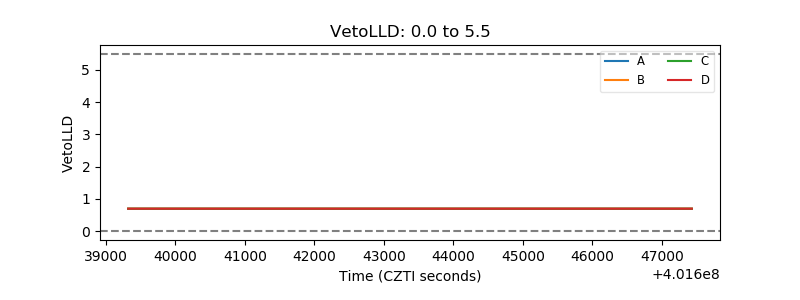 |
| Alpha Counter | 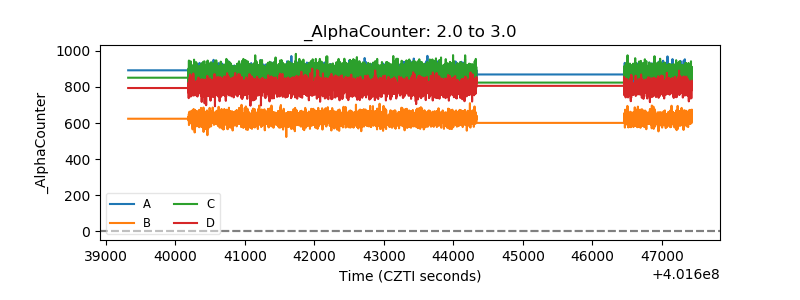 |
| _CPM_Rate | 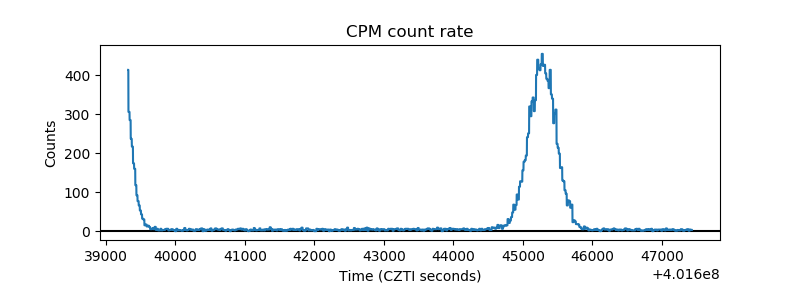 |
| CZT Counter | 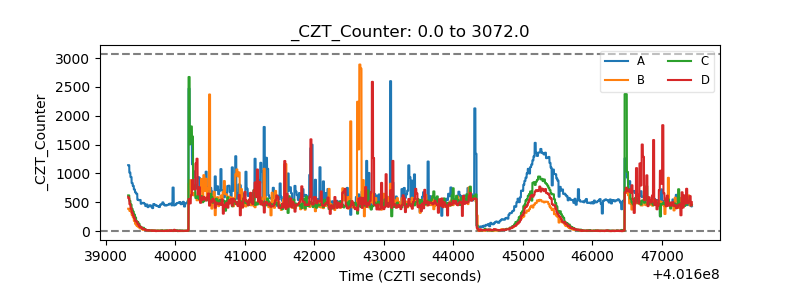 |
| +2.5 Volts monitor | 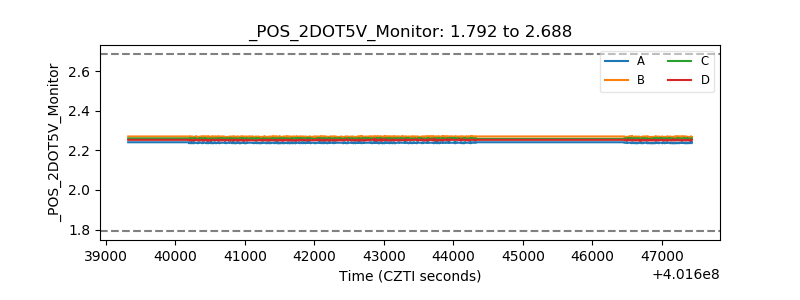 |
| +5 Volts monitor | 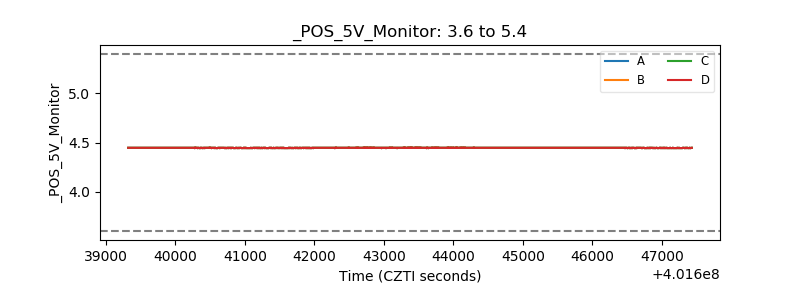 |
| _ROLL_ROT | 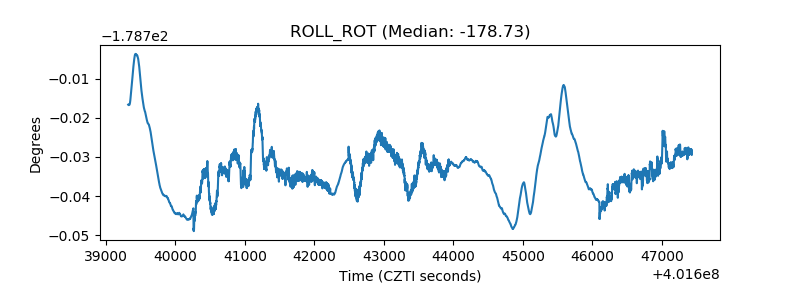 |
| _Roll_DEC | 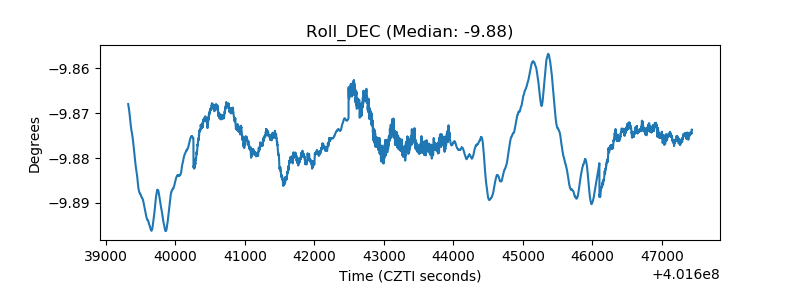 |
| _Roll_RA | 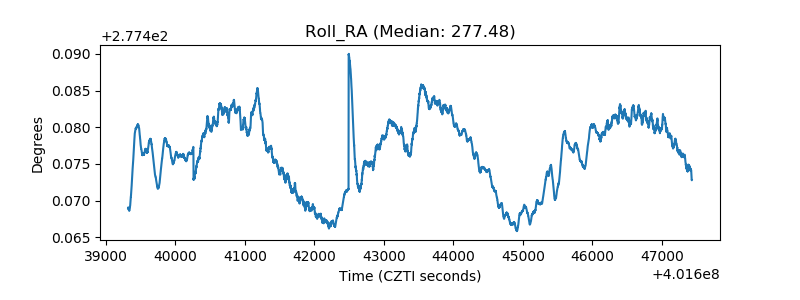 |
| Veto Counter | 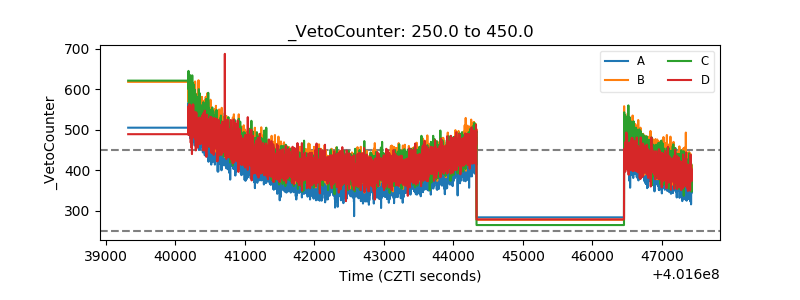 |