| Param | Original file | Final file |
|---|---|---|
| Filename | modeM0/AS1T05_057T01_9000005346_37785cztM0_level2.evt | modeM0/AS1T05_057T01_9000005346_37785cztM0_level2_quad_clean.evt |
| Size (bytes) | 406,149,120 | 66,271,680 |
| Size | 387.3 MB | 63.2 MB |
| Events in quadrant A | 2,820,078 | 412,913 |
| Events in quadrant B | 2,958,092 | 407,001 |
| Events in quadrant C | 3,014,905 | 411,139 |
| Events in quadrant D | 3,133,694 | 391,049 |
| Mode M0 | |||
|---|---|---|---|
| Quadrant | BADHDUFLAG | Total packets | Discarded packets |
| A | 0 | 11813 | 3 |
| B | 0 | 12271 | 2 |
| C | 0 | 12345 | 2 |
| D | 0 | 13055 | 2 |
| Mode SS | |||
|---|---|---|---|
| Quadrant | BADHDUFLAG | Total packets | Discarded packets |
| A | 0 | 110 | 0 |
| B | 0 | 110 | 0 |
| C | 0 | 110 | 0 |
| D | 0 | 110 | 0 |
| Mode M9 | |||
|---|---|---|---|
| Quadrant | BADHDUFLAG | Total packets | Discarded packets |
| A | 0 | 25 | 0 |
| B | 0 | 25 | 0 |
| C | 0 | 25 | 0 |
| D | 0 | 26 | 0 |
| Quadrant | Total seconds | Saturated seconds | Saturation percentage |
|---|---|---|---|
| A | 5501 | 12 | 0.218142% |
| B | 5501 | 90 | 1.636066% |
| C | 5501 | 49 | 0.890747% |
| D | 5501 | 59 | 1.072532% |
Noise dominated data is calculated using 1-second bins in cleaned event files. If a bin has >2000 counts, and if more than 50% of those come from <1% of pixels, then it is considered to be noise-dominated and hence unusable.
| Quadrant | # 1 sec bins | Bins with >0 counts | Bins with >2000 counts | High rate bins dominated by noise | Noise dominated (total time) | Noise dominated (detector-on time) | Marked lightcurve |
|---|---|---|---|---|---|---|---|
| A | 7054 | 5502 | 8 | 8 | 0.11% | 0.15% | 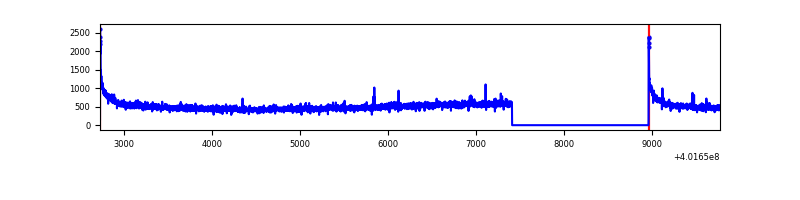 |
| B | 7054 | 5502 | 74 | 74 | 1.05% | 1.34% | 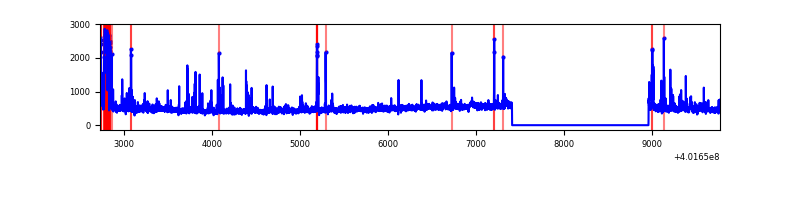 |
| C | 7054 | 5502 | 58 | 58 | 0.82% | 1.05% | 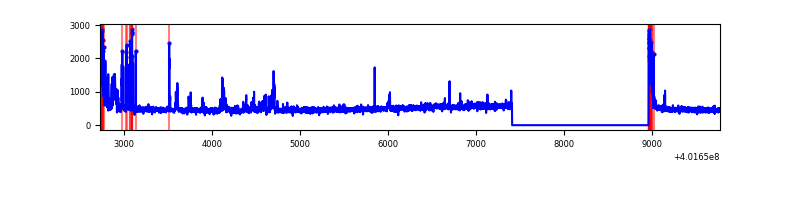 |
| D | 7054 | 5502 | 64 | 64 | 0.91% | 1.16% | 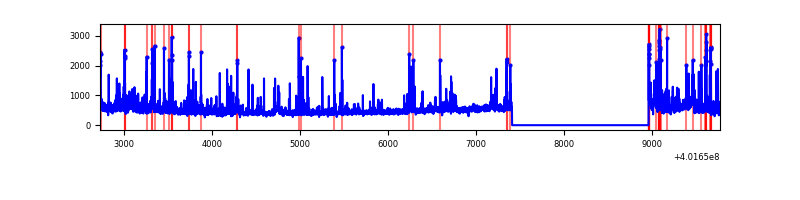 |
Top three noisy pixels from each quadrant. If the there are fewer than three noisy pixels in the level2.evt file, extra rows are filled as -1
| Pixel properties | Quadrant properties | ||||||
|---|---|---|---|---|---|---|---|
| Quadrant | DetID | PixID | Counts | Sigma | Mean | Median | Sigma |
| A | 10 | 83 | 354375 | 2768.45 | 624 | 612 | 127.8 |
| A | 12 | 189 | 20401 | 154.86 | 624 | 612 | 127.8 |
| A | 13 | 254 | 9047 | 66.01 | 624 | 612 | 127.8 |
| B | 5 | 172 | 223088 | 1848.01 | 617 | 601 | 120.4 |
| B | 0 | 229 | 64050 | 527.02 | 617 | 601 | 120.4 |
| B | 0 | 230 | 61721 | 507.67 | 617 | 601 | 120.4 |
| C | 15 | 214 | 252722 | 1774.08 | 607 | 611 | 142.1 |
| C | 0 | 10 | 162642 | 1140.2 | 607 | 611 | 142.1 |
| C | 0 | 207 | 141695 | 992.8 | 607 | 611 | 142.1 |
| D | 13 | 249 | 159210 | 1063.34 | 605 | 589 | 149.2 |
| D | 2 | 153 | 127813 | 852.87 | 605 | 589 | 149.2 |
| D | 2 | 250 | 85155 | 566.9 | 605 | 589 | 149.2 |
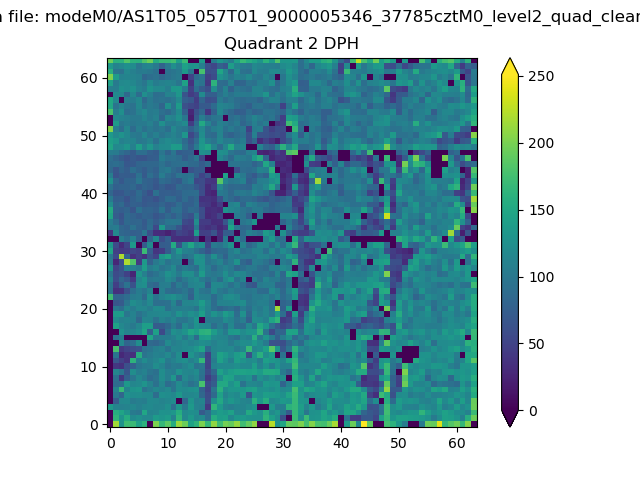
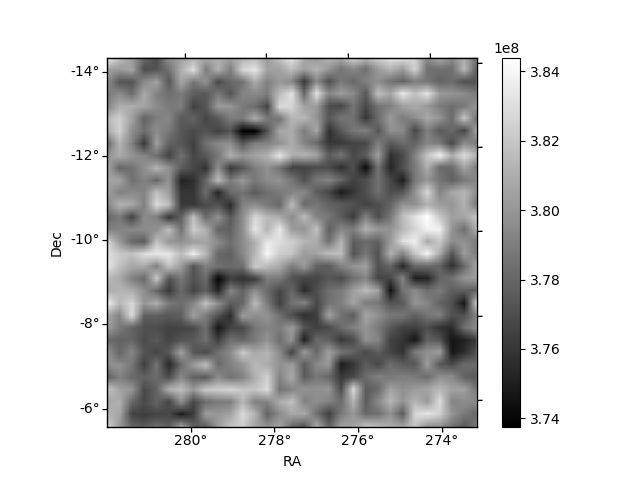
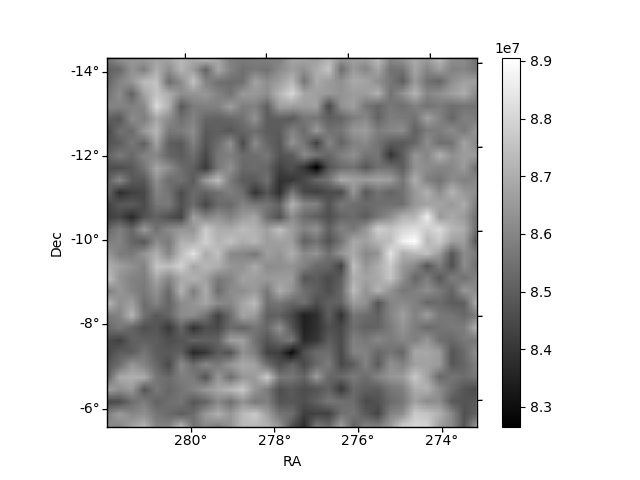
Histogram calculated using DETX and DETY for each event in the final _common_clean file
| Quadrant A | 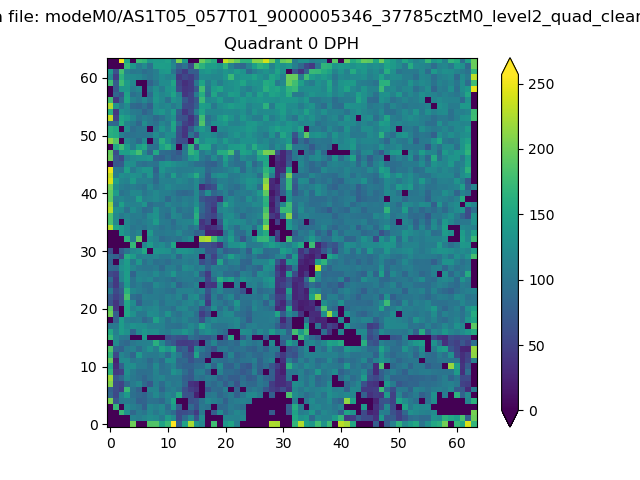 |
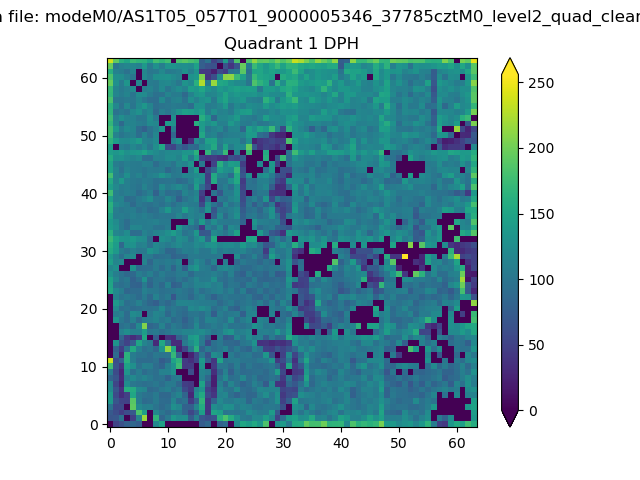 |
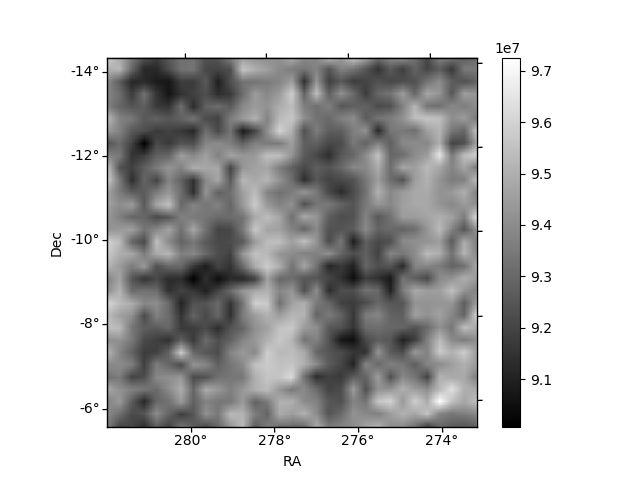
Quadrant B |
|---|---|---|---|
| Quadrant D | 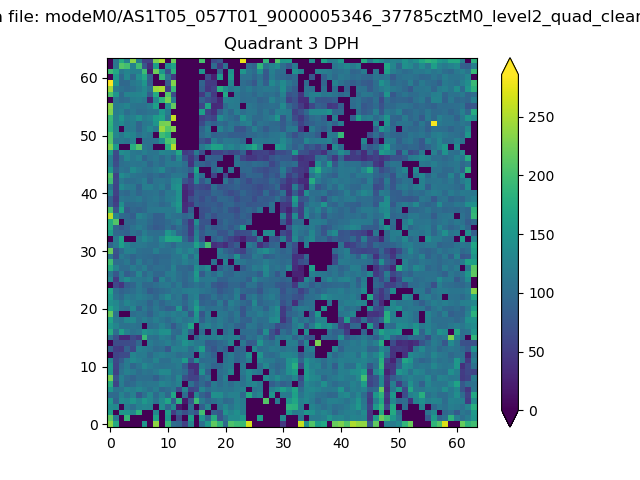 |
 |
Quadrant C |
| Plot type | Count rate plots | Images |
|---|---|---|
| Comparison with Poisson distribution Blue bars denote a histogram of data divided into 1 sec bins. Red curve is a Poisson curve with rate = median count rate of data. |
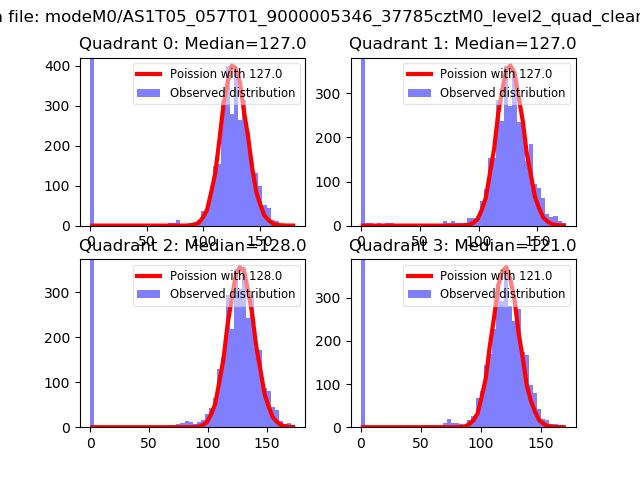 |
 |
| Quadrant-wise count rates Data is divided into 100 sec bins |
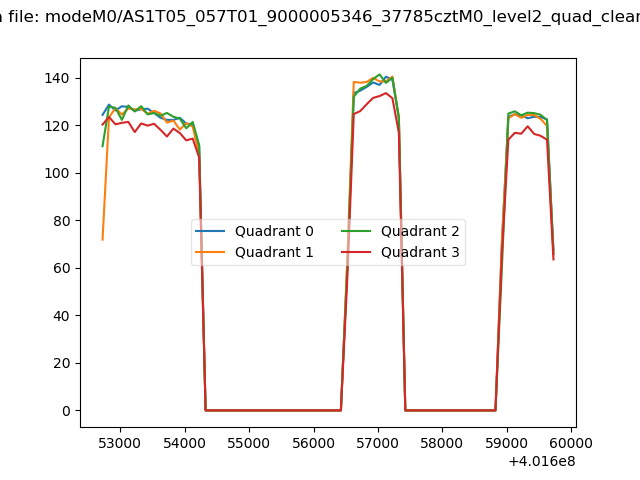 |
|
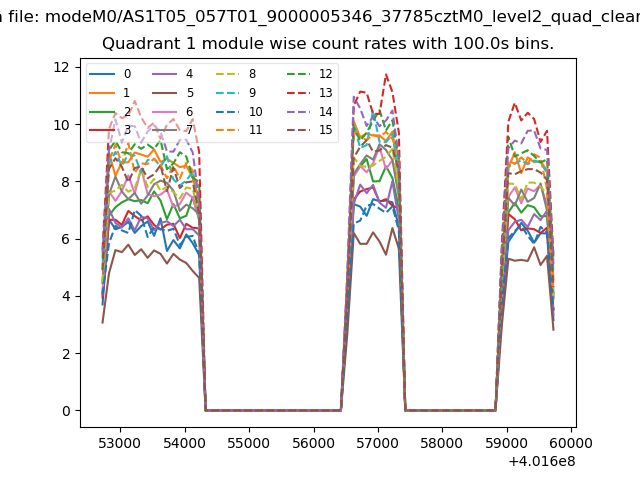
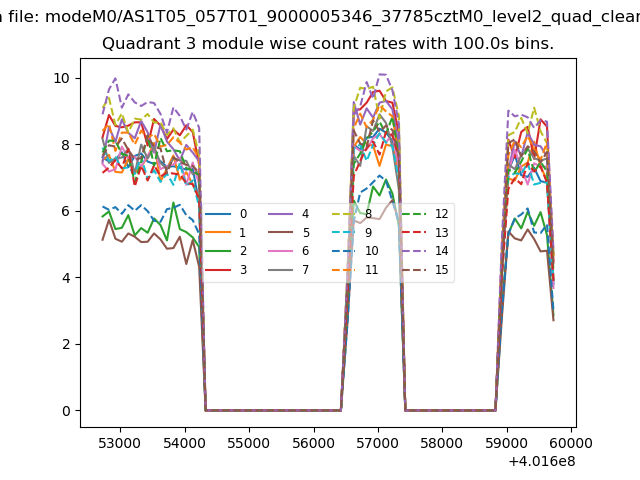
| Module-wise count rates for Quadrant A Data is divided into 100 sec bins |
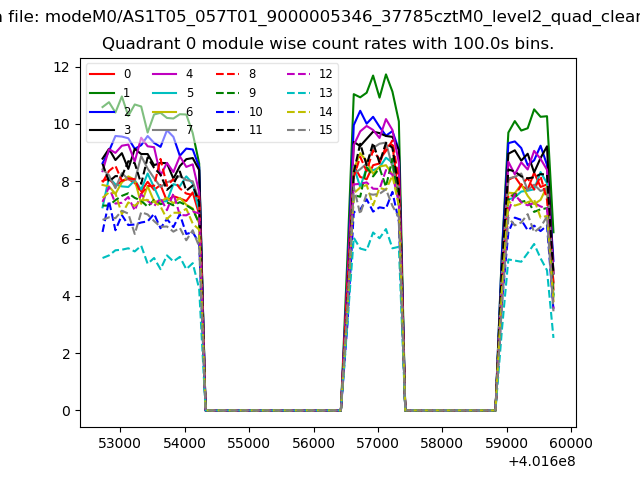 |
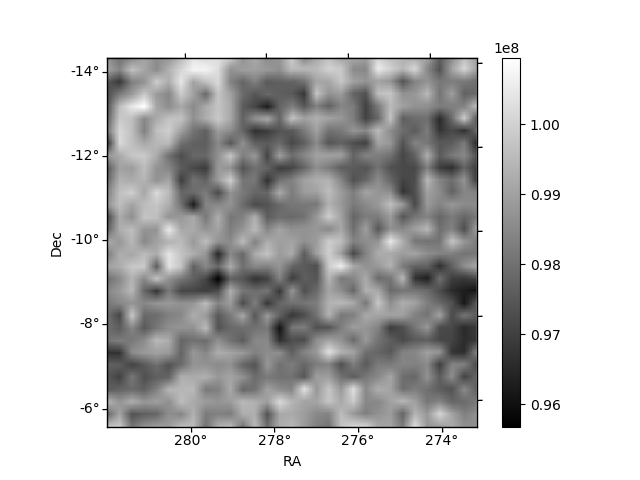 |
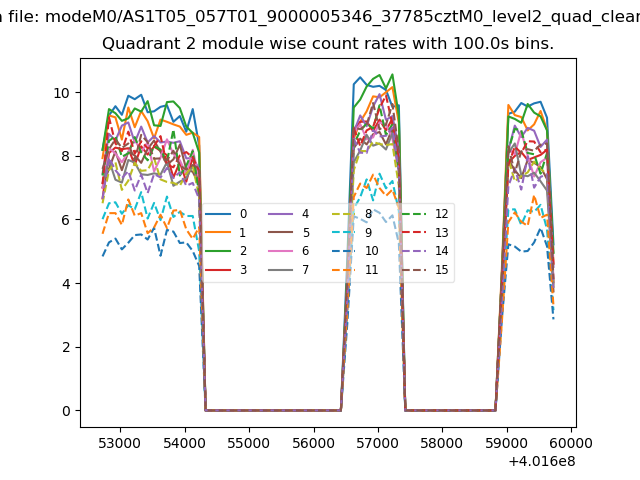
| Module-wise count rates for Quadrant B Data is divided into 100 sec bins |
 |
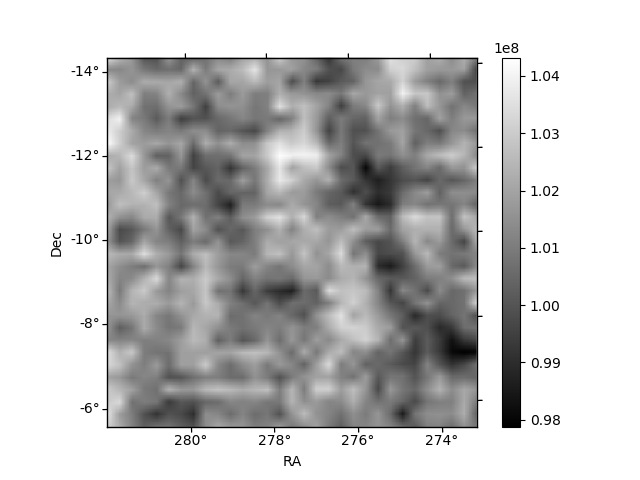 |
| Module-wise count rates for Quadrant C Data is divided into 100 sec bins |
 |
 |
| Module-wise count rates for Quadrant D Data is divided into 100 sec bins |
 |
 |
| Parameter | Plot |
|---|---|
| CZT HV Monitor | 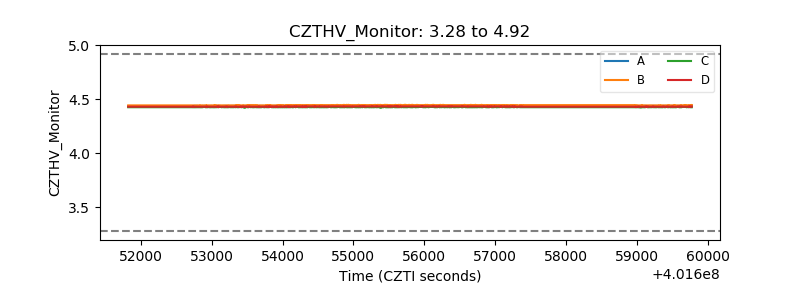 |
| D_VDD | 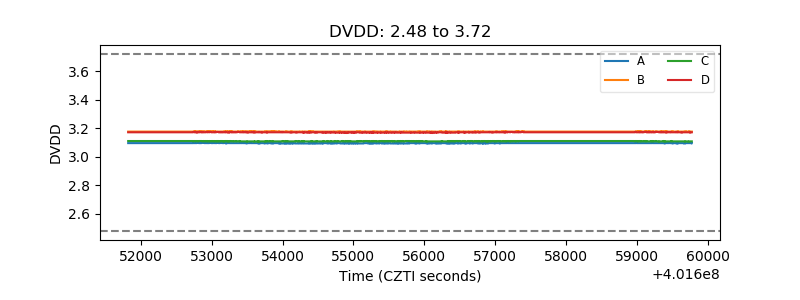 |
| Temperature 1 |  |
| Veto HV Monitor | 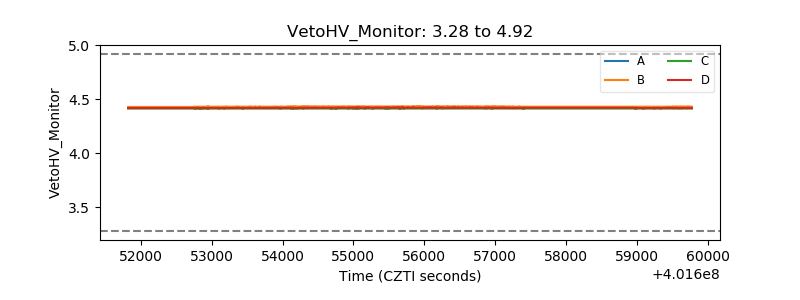 |
| Veto LLD | 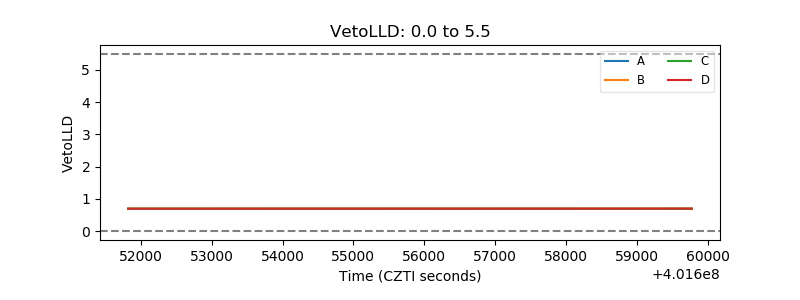 |
| Alpha Counter | 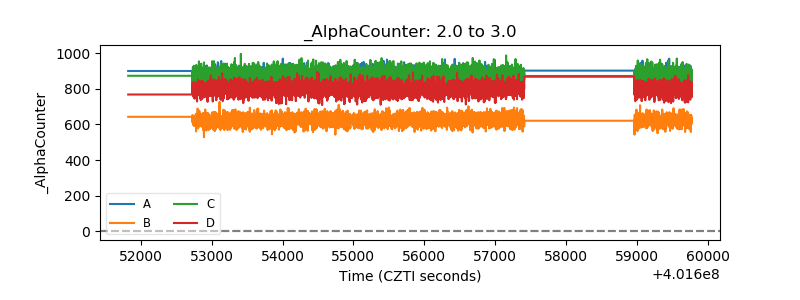 |
| _CPM_Rate | 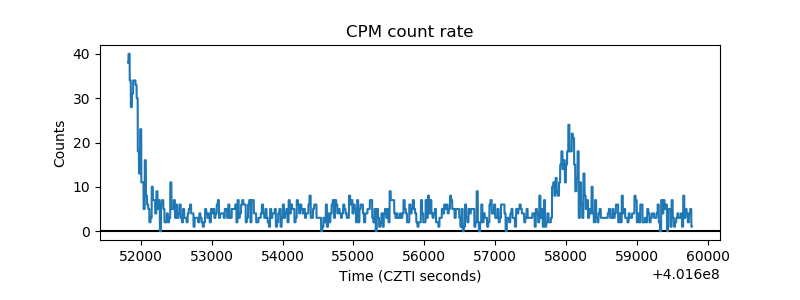 |
| CZT Counter | 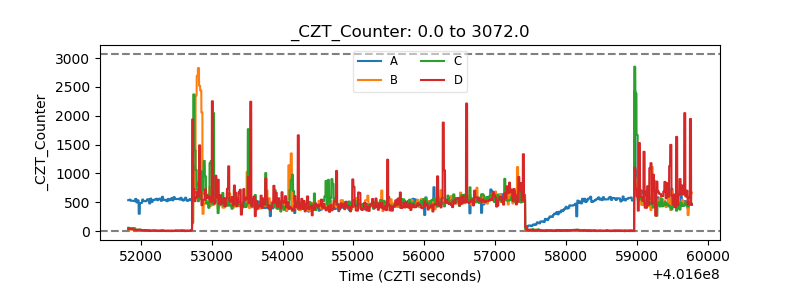 |
| +2.5 Volts monitor | 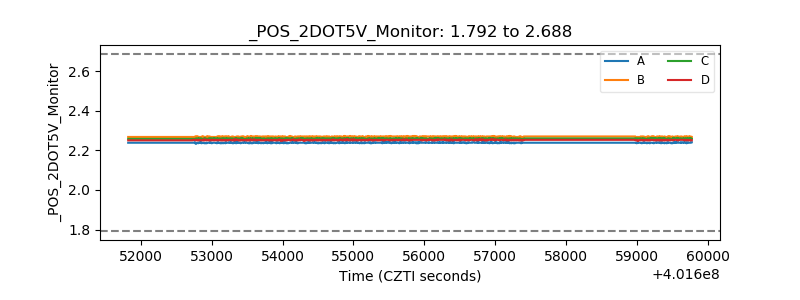 |
| +5 Volts monitor | 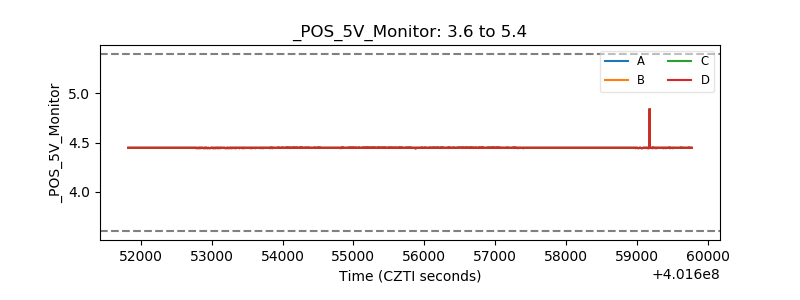 |
| _ROLL_ROT | 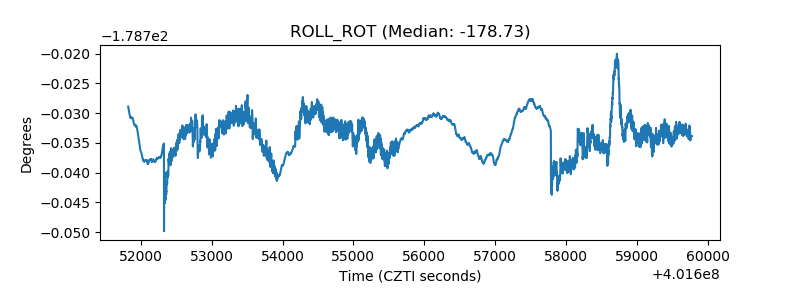 |
| _Roll_DEC | 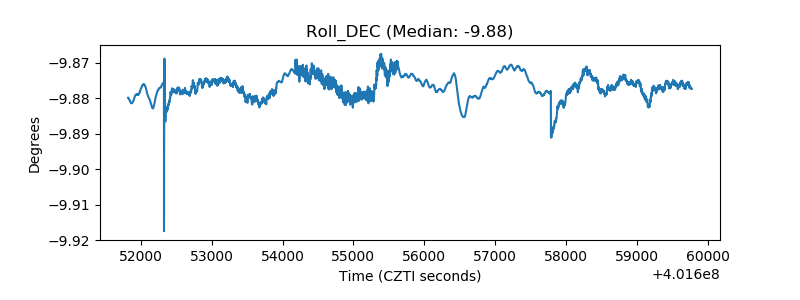 |
| _Roll_RA | 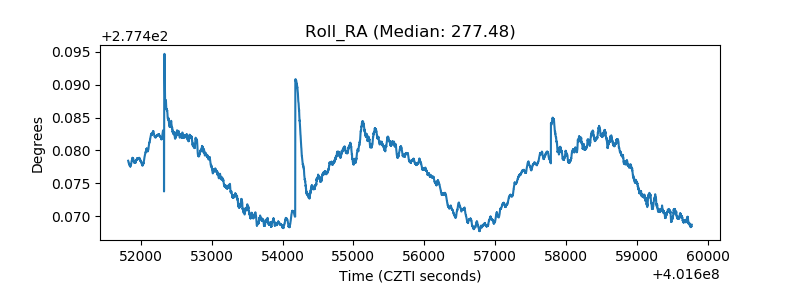 |
| Veto Counter | 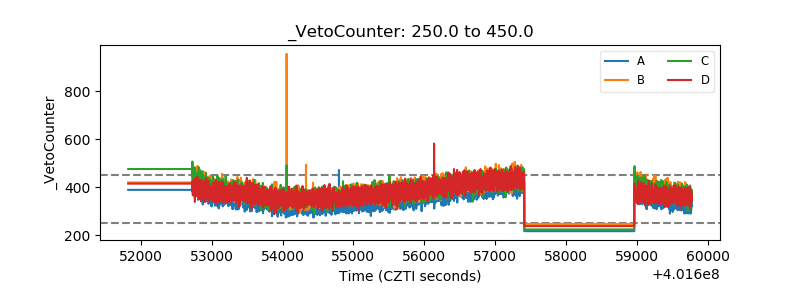 |