| Param | Original file | Final file |
|---|---|---|
| Filename | modeM0/AS1T05_057T01_9000005346_37786cztM0_level2.evt | modeM0/AS1T05_057T01_9000005346_37786cztM0_level2_quad_clean.evt |
| Size (bytes) | 472,654,080 | 76,584,960 |
| Size | 450.8 MB | 73.0 MB |
| Events in quadrant A | 3,164,520 | 479,964 |
| Events in quadrant B | 3,234,352 | 481,659 |
| Events in quadrant C | 3,116,381 | 481,801 |
| Events in quadrant D | 4,385,232 | 449,680 |
| Mode M0 | |||
|---|---|---|---|
| Quadrant | BADHDUFLAG | Total packets | Discarded packets |
| A | 0 | 13189 | 3 |
| B | 0 | 13549 | 2 |
| C | 0 | 12943 | 2 |
| D | 0 | 17227 | 2 |
| Mode SS | |||
|---|---|---|---|
| Quadrant | BADHDUFLAG | Total packets | Discarded packets |
| A | 0 | 124 | 0 |
| B | 0 | 124 | 0 |
| C | 0 | 124 | 0 |
| D | 0 | 124 | 0 |
| Mode M9 | |||
|---|---|---|---|
| Quadrant | BADHDUFLAG | Total packets | Discarded packets |
| A | 0 | 30 | 0 |
| B | 0 | 30 | 0 |
| C | 0 | 30 | 0 |
| D | 0 | 30 | 0 |
| Quadrant | Total seconds | Saturated seconds | Saturation percentage |
|---|---|---|---|
| A | 6105 | 17 | 0.278460% |
| B | 6105 | 50 | 0.819001% |
| C | 6105 | 36 | 0.589681% |
| D | 6105 | 183 | 2.997543% |
Noise dominated data is calculated using 1-second bins in cleaned event files. If a bin has >2000 counts, and if more than 50% of those come from <1% of pixels, then it is considered to be noise-dominated and hence unusable.
| Quadrant | # 1 sec bins | Bins with >0 counts | Bins with >2000 counts | High rate bins dominated by noise | Noise dominated (total time) | Noise dominated (detector-on time) | Marked lightcurve |
|---|---|---|---|---|---|---|---|
| A | 9002 | 6107 | 13 | 13 | 0.14% | 0.21% | 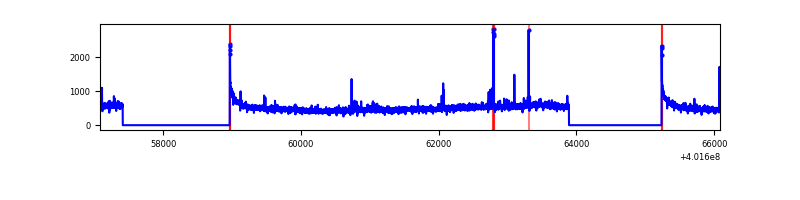 |
| B | 9002 | 6107 | 25 | 25 | 0.28% | 0.41% | 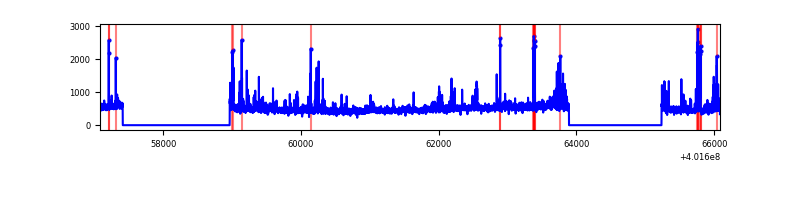 |
| C | 9002 | 6107 | 33 | 33 | 0.37% | 0.54% | 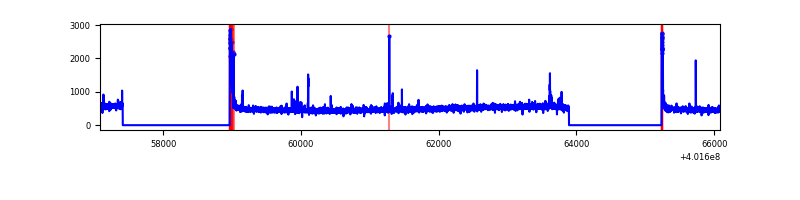 |
| D | 9002 | 6107 | 208 | 208 | 2.31% | 3.41% | 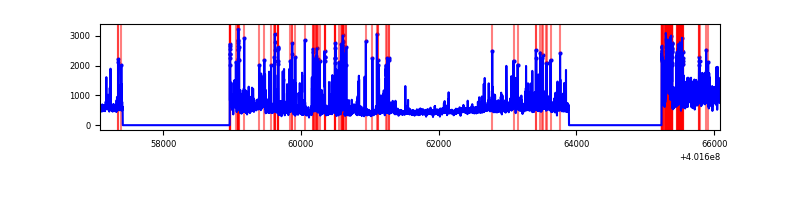 |
Top three noisy pixels from each quadrant. If the there are fewer than three noisy pixels in the level2.evt file, extra rows are filled as -1
| Pixel properties | Quadrant properties | ||||||
|---|---|---|---|---|---|---|---|
| Quadrant | DetID | PixID | Counts | Sigma | Mean | Median | Sigma |
| A | 10 | 83 | 364633 | 2554.07 | 701 | 687 | 142.5 |
| A | 12 | 189 | 22639 | 154.05 | 701 | 687 | 142.5 |
| A | 7 | 16 | 21155 | 143.64 | 701 | 687 | 142.5 |
| B | 0 | 229 | 118135 | 867.17 | 696 | 678 | 135.4 |
| B | 4 | 81 | 93396 | 684.53 | 696 | 678 | 135.4 |
| B | 0 | 230 | 65116 | 475.74 | 696 | 678 | 135.4 |
| C | 15 | 214 | 278683 | 1717.76 | 683 | 688 | 161.8 |
| C | 0 | 10 | 116071 | 712.96 | 683 | 688 | 161.8 |
| C | 15 | 159 | 20029 | 119.51 | 683 | 688 | 161.8 |
| D | 1 | 239 | 373894 | 2250.15 | 676 | 657 | 165.9 |
| D | 7 | 223 | 312109 | 1877.66 | 676 | 657 | 165.9 |
| D | 1 | 47 | 295523 | 1777.67 | 676 | 657 | 165.9 |
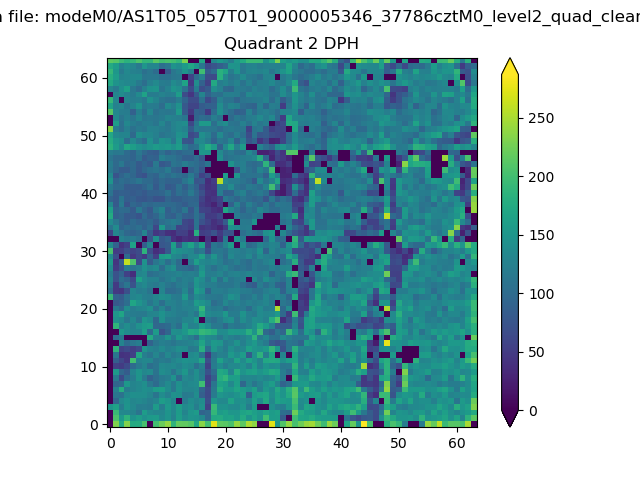
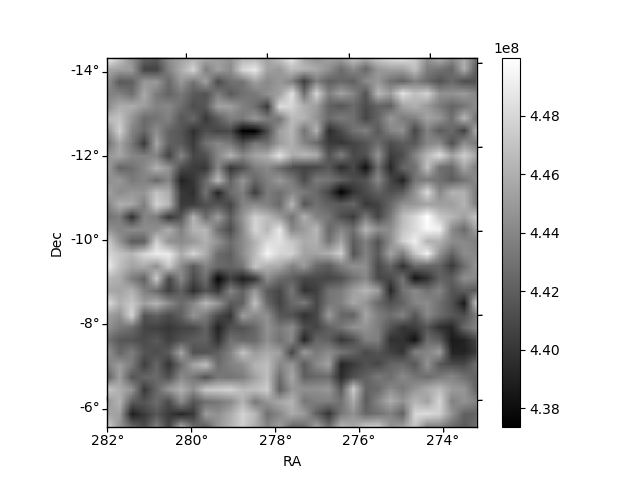
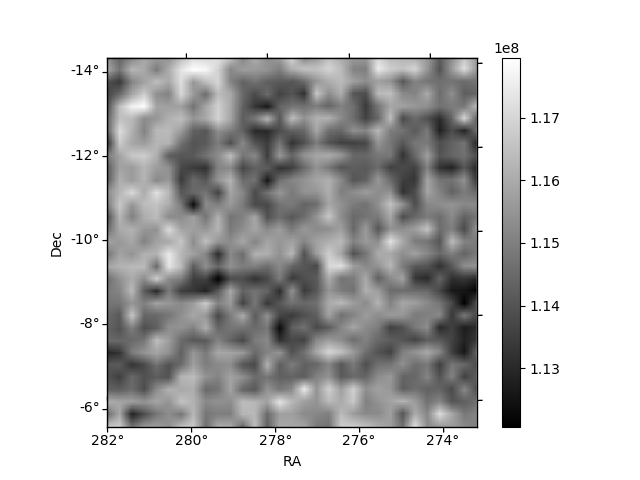
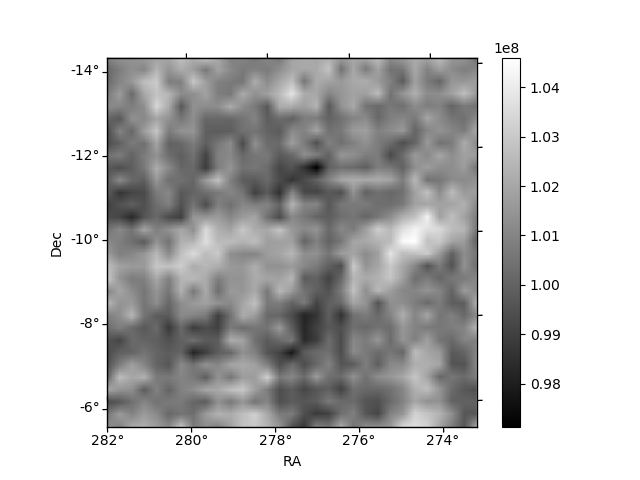
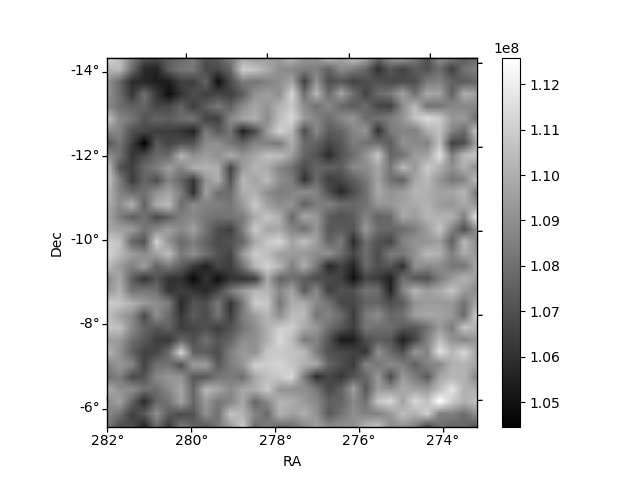
Histogram calculated using DETX and DETY for each event in the final _common_clean file
| Quadrant A | 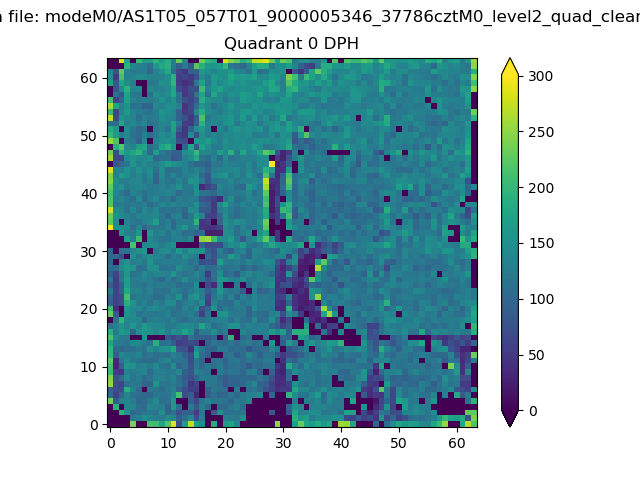 |
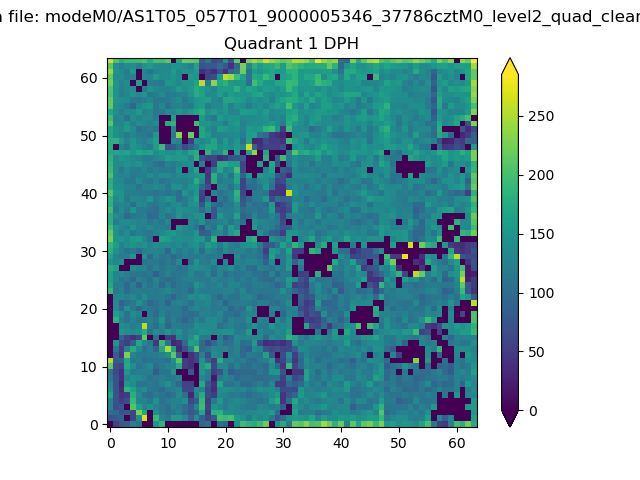 |
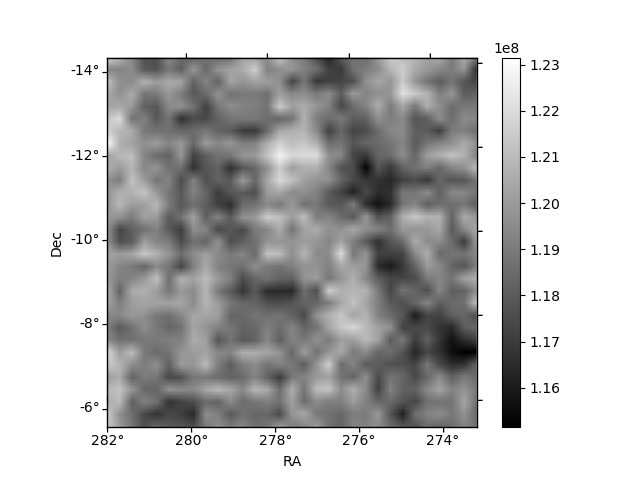
Quadrant B |
|---|---|---|---|
| Quadrant D | 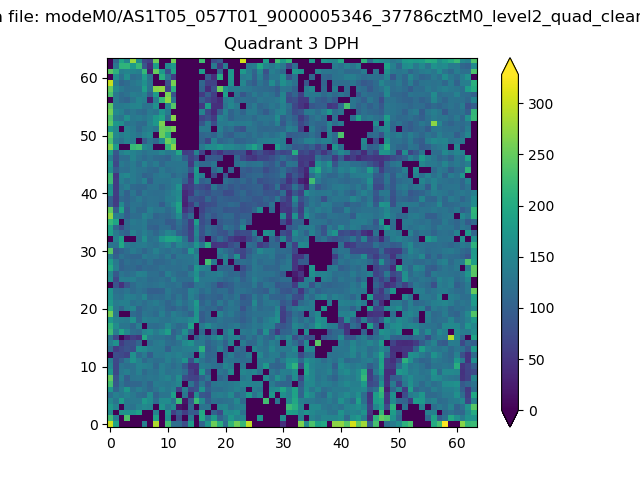 |
 |
Quadrant C |
| Plot type | Count rate plots | Images |
|---|---|---|
| Comparison with Poisson distribution Blue bars denote a histogram of data divided into 1 sec bins. Red curve is a Poisson curve with rate = median count rate of data. |
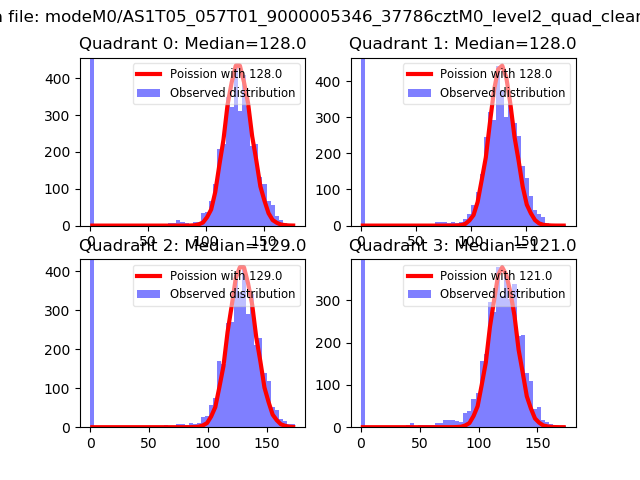 |
 |
| Quadrant-wise count rates Data is divided into 100 sec bins |
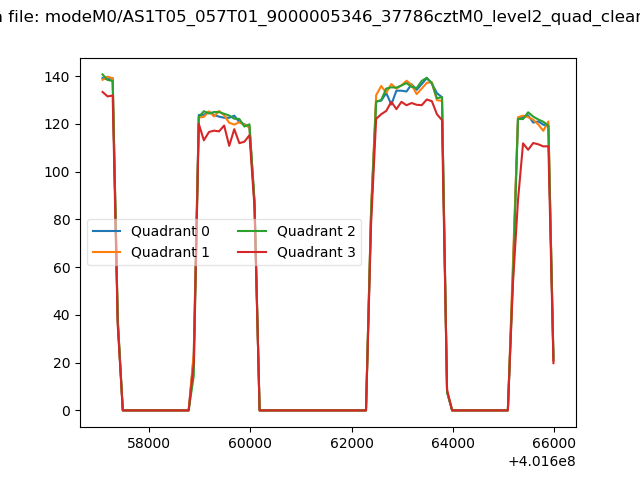 |
|
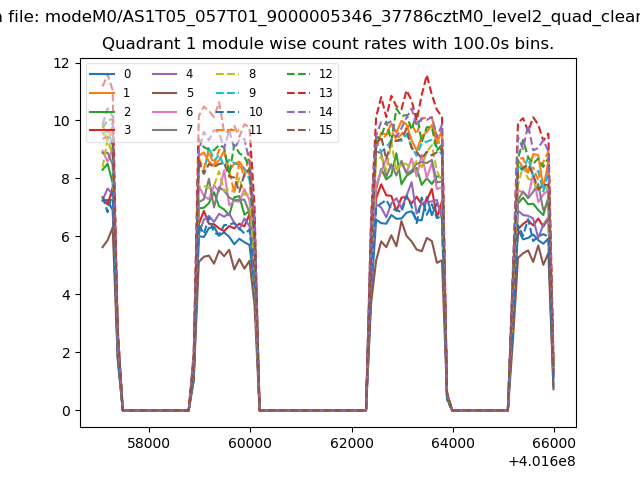
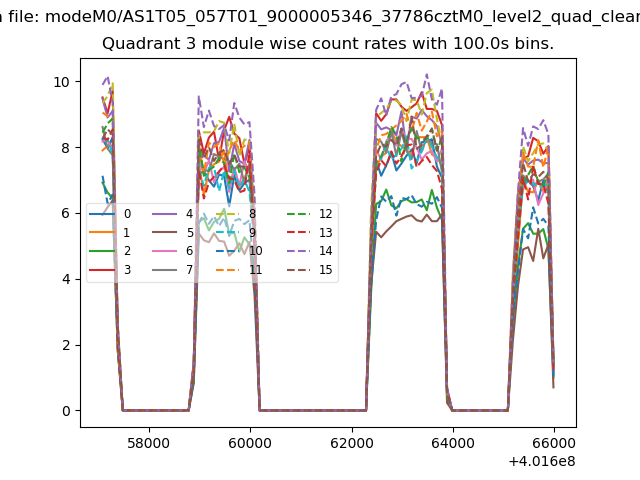
| Module-wise count rates for Quadrant A Data is divided into 100 sec bins |
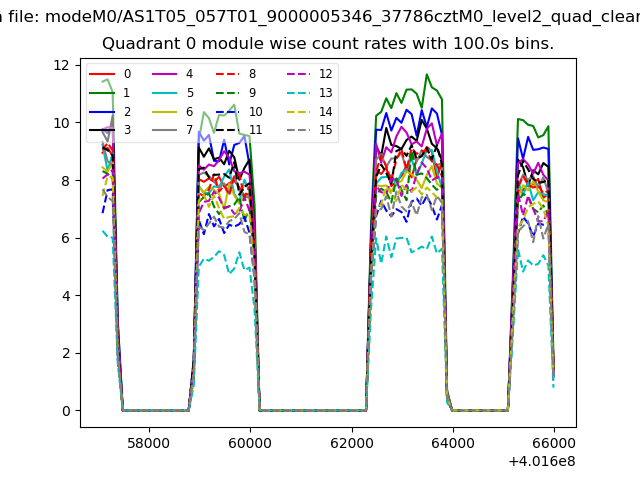 |
 |
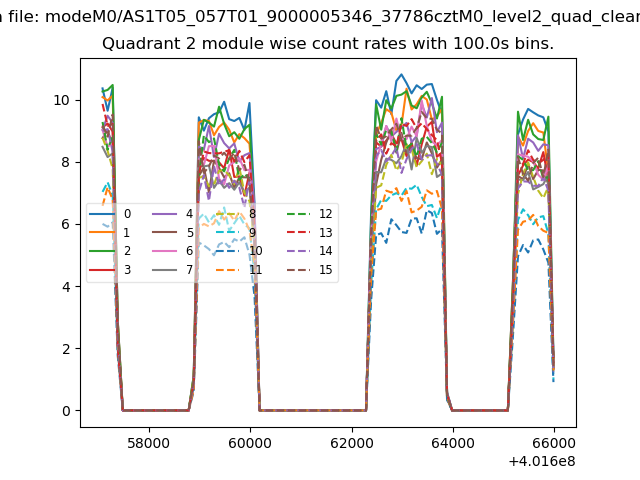
| Module-wise count rates for Quadrant B Data is divided into 100 sec bins |
 |
 |
| Module-wise count rates for Quadrant C Data is divided into 100 sec bins |
 |
 |
| Module-wise count rates for Quadrant D Data is divided into 100 sec bins |
 |
 |
| Parameter | Plot |
|---|---|
| CZT HV Monitor |  |
| D_VDD | 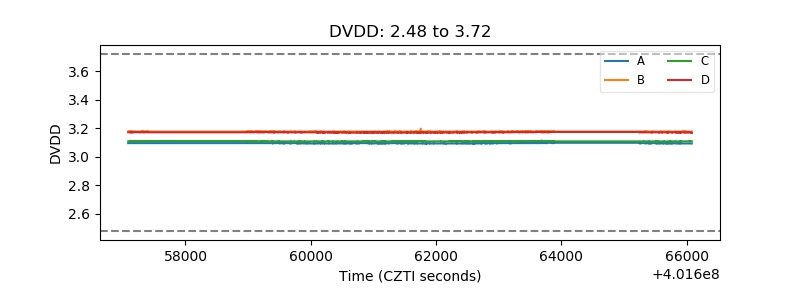 |
| Temperature 1 | 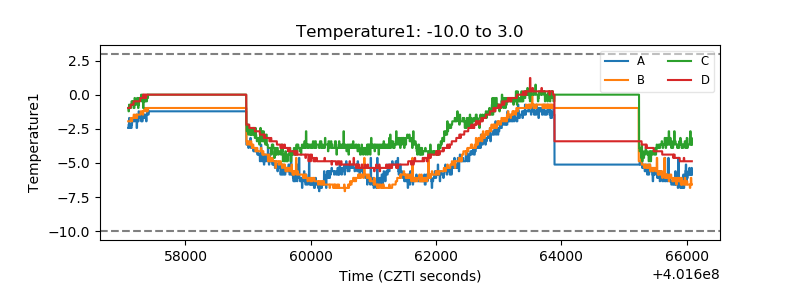 |
| Veto HV Monitor | 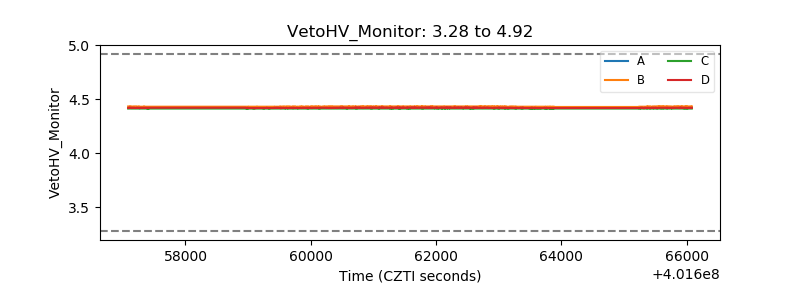 |
| Veto LLD | 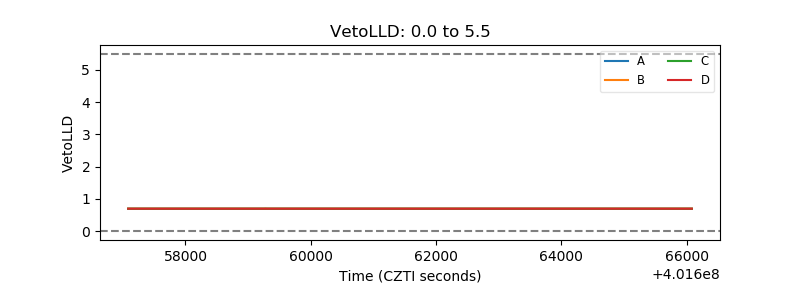 |
| Alpha Counter | 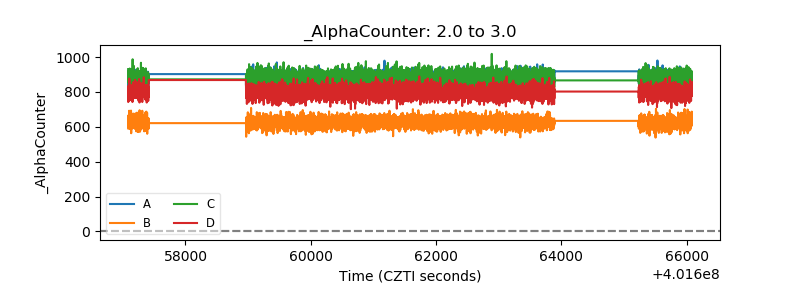 |
| _CPM_Rate | 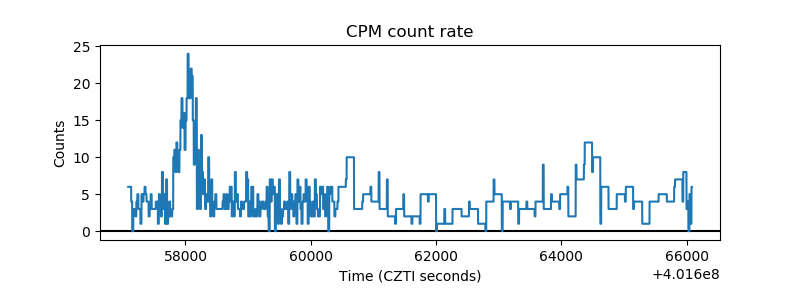 |
| CZT Counter | 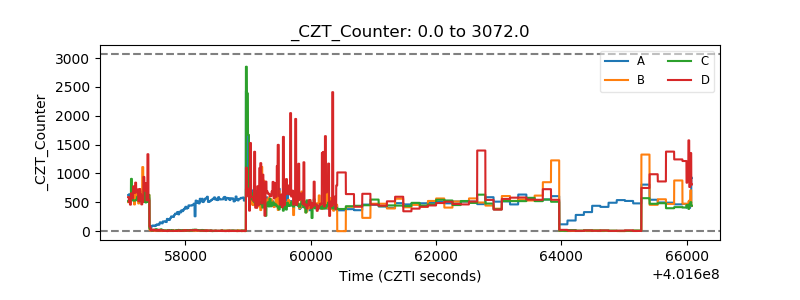 |
| +2.5 Volts monitor | 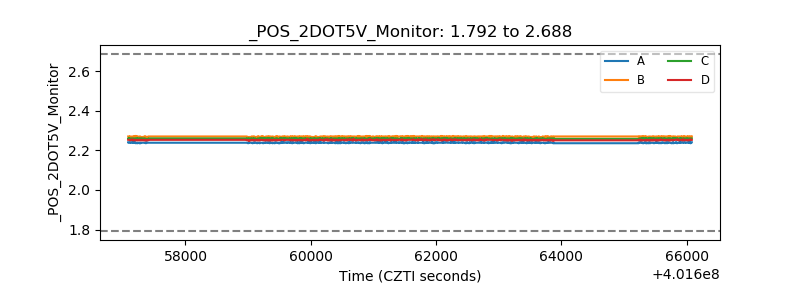 |
| +5 Volts monitor | 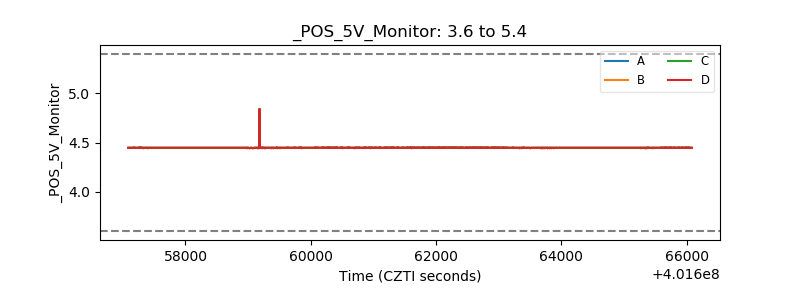 |
| _ROLL_ROT | 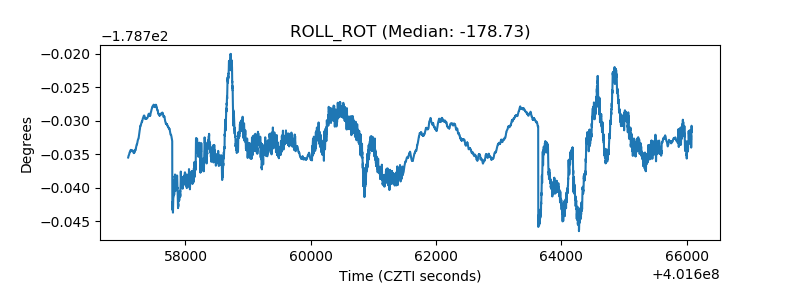 |
| _Roll_DEC | 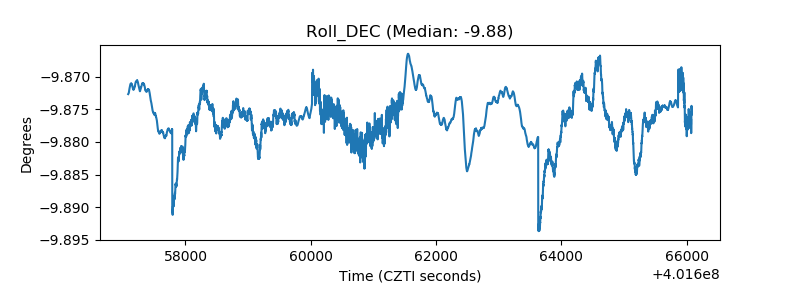 |
| _Roll_RA | 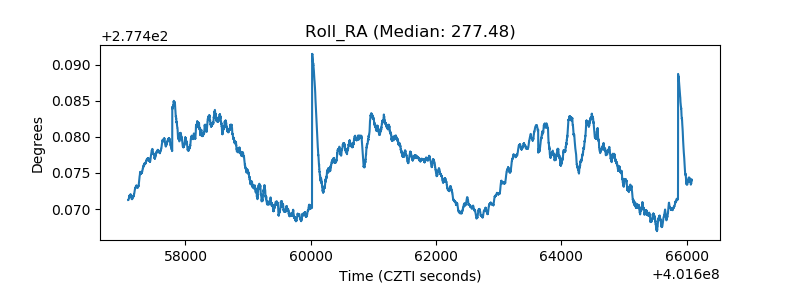 |
| Veto Counter | 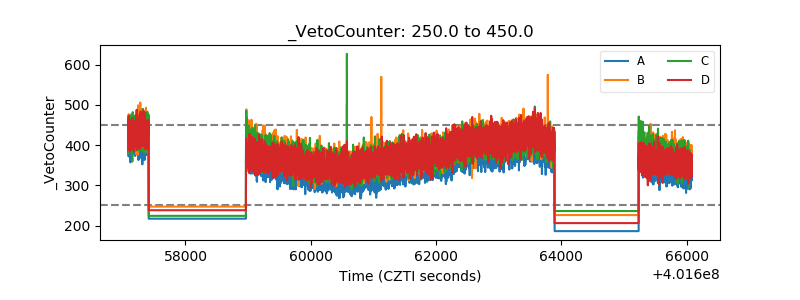 |