| Param | Original file | Final file |
|---|---|---|
| Filename | modeM0/AS1T05_057T01_9000005346_37789cztM0_level2.evt | modeM0/AS1T05_057T01_9000005346_37789cztM0_level2_quad_clean.evt |
| Size (bytes) | 855,976,320 | 110,401,920 |
| Size | 816.3 MB | 105.3 MB |
| Events in quadrant A | 5,549,780 | 677,882 |
| Events in quadrant B | 5,769,353 | 670,600 |
| Events in quadrant C | 5,544,732 | 674,455 |
| Events in quadrant D | 8,338,988 | 582,246 |
| Mode M0 | |||
|---|---|---|---|
| Quadrant | BADHDUFLAG | Total packets | Discarded packets |
| A | 0 | 22769 | 4 |
| B | 0 | 24117 | 3 |
| C | 0 | 22751 | 3 |
| D | 0 | 32066 | 3 |
| Mode SS | |||
|---|---|---|---|
| Quadrant | BADHDUFLAG | Total packets | Discarded packets |
| A | 0 | 218 | 0 |
| B | 0 | 218 | 0 |
| C | 0 | 218 | 0 |
| D | 0 | 218 | 0 |
| Mode M9 | |||
|---|---|---|---|
| Quadrant | BADHDUFLAG | Total packets | Discarded packets |
| A | 0 | 35 | 0 |
| B | 0 | 35 | 0 |
| C | 0 | 35 | 0 |
| D | 0 | 36 | 0 |
| Quadrant | Total seconds | Saturated seconds | Saturation percentage |
|---|---|---|---|
| A | 10646 | 45 | 0.422694% |
| B | 10646 | 109 | 1.023859% |
| C | 10646 | 111 | 1.042645% |
| D | 10646 | 1275 | 11.976329% |
Noise dominated data is calculated using 1-second bins in cleaned event files. If a bin has >2000 counts, and if more than 50% of those come from <1% of pixels, then it is considered to be noise-dominated and hence unusable.
| Quadrant | # 1 sec bins | Bins with >0 counts | Bins with >2000 counts | High rate bins dominated by noise | Noise dominated (total time) | Noise dominated (detector-on time) | Marked lightcurve |
|---|---|---|---|---|---|---|---|
| A | 13421 | 10648 | 26 | 26 | 0.19% | 0.24% | 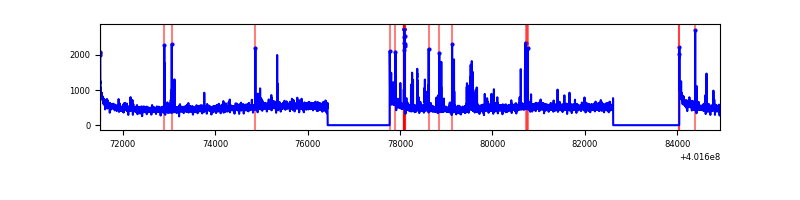 |
| B | 13421 | 10648 | 56 | 56 | 0.42% | 0.53% | 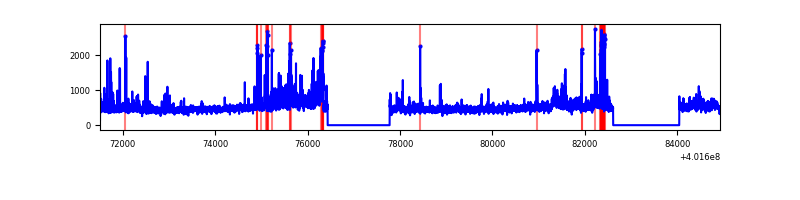 |
| C | 13421 | 10648 | 88 | 88 | 0.66% | 0.83% | 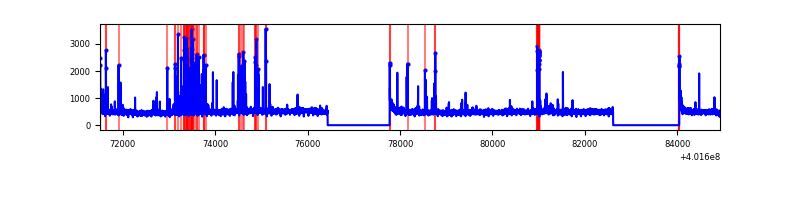 |
| D | 13421 | 10648 | 1303 | 1303 | 9.71% | 12.24% | 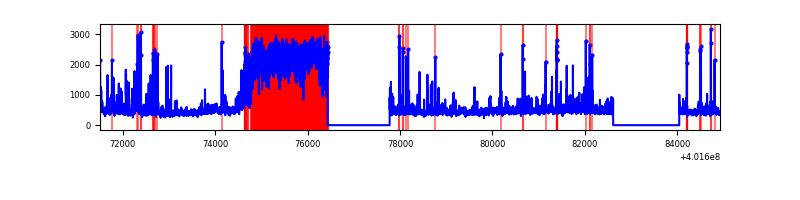 |
Top three noisy pixels from each quadrant. If the there are fewer than three noisy pixels in the level2.evt file, extra rows are filled as -1
| Pixel properties | Quadrant properties | ||||||
|---|---|---|---|---|---|---|---|
| Quadrant | DetID | PixID | Counts | Sigma | Mean | Median | Sigma |
| A | 10 | 83 | 611581 | 2494.8 | 1212 | 1189 | 244.7 |
| A | 9 | 143 | 185525 | 753.42 | 1212 | 1189 | 244.7 |
| A | 13 | 6 | 24807 | 96.53 | 1212 | 1189 | 244.7 |
| B | 0 | 219 | 215697 | 912.84 | 1207 | 1174 | 235.0 |
| B | 4 | 81 | 161720 | 683.15 | 1207 | 1174 | 235.0 |
| B | 4 | 171 | 130930 | 552.14 | 1207 | 1174 | 235.0 |
| C | 15 | 214 | 485886 | 1754.22 | 1176 | 1186 | 276.3 |
| C | 0 | 207 | 231109 | 832.14 | 1176 | 1186 | 276.3 |
| C | 14 | 254 | 87848 | 313.65 | 1176 | 1186 | 276.3 |
| D | 7 | 223 | 3040829 | 10876.73 | 1134 | 1101 | 279.5 |
| D | 1 | 47 | 187910 | 668.44 | 1134 | 1101 | 279.5 |
| D | 13 | 249 | 171533 | 609.84 | 1134 | 1101 | 279.5 |
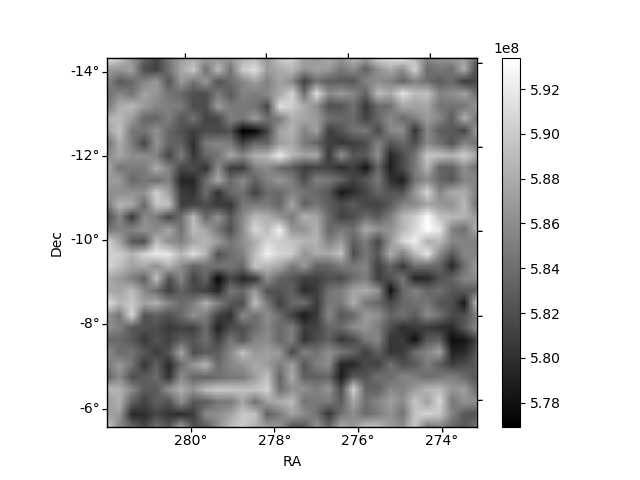
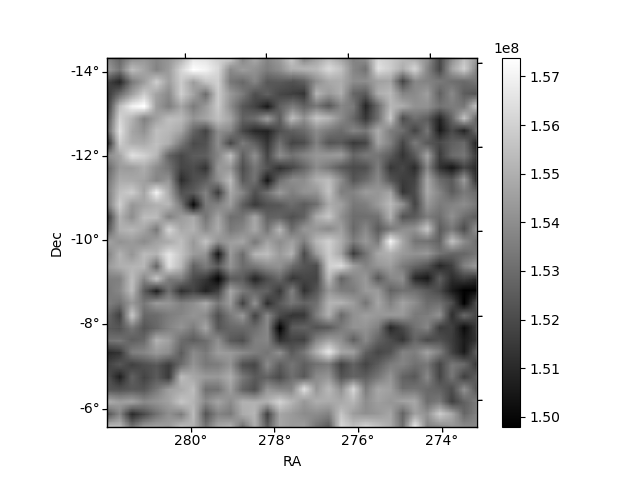
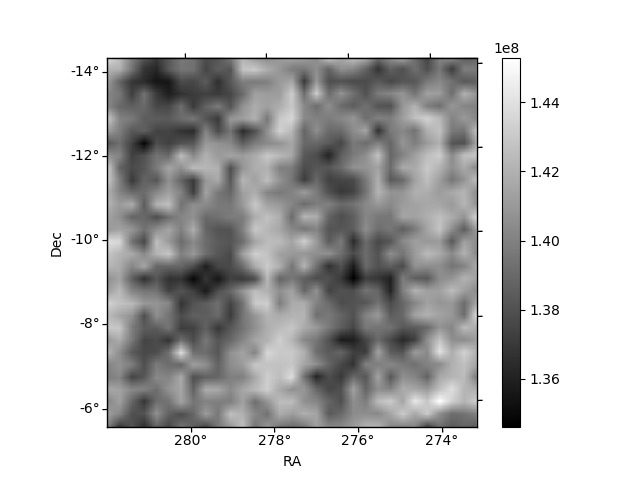
Histogram calculated using DETX and DETY for each event in the final _common_clean file
| Quadrant A | 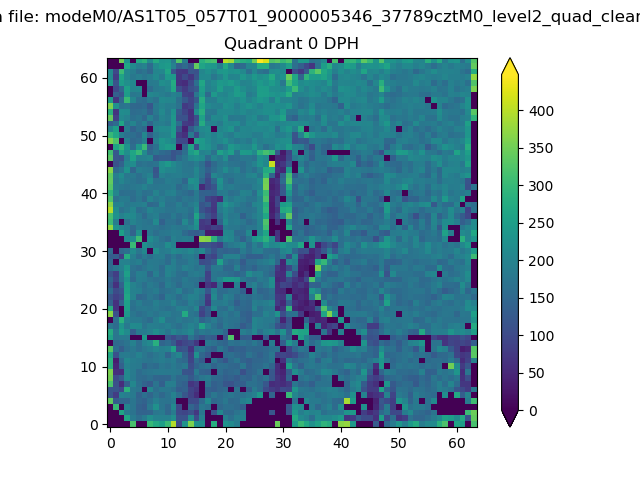 |
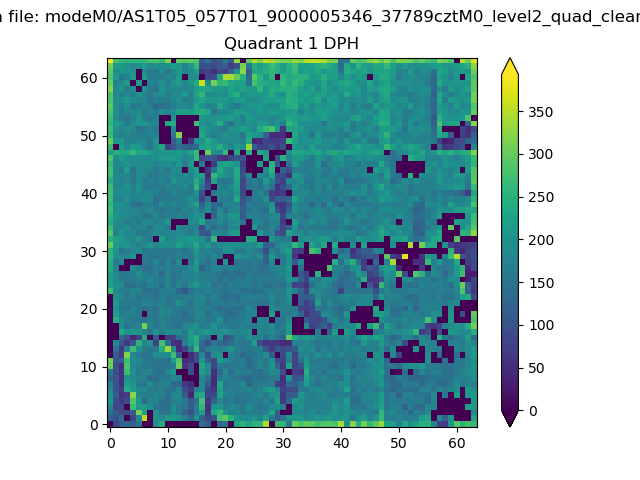 |
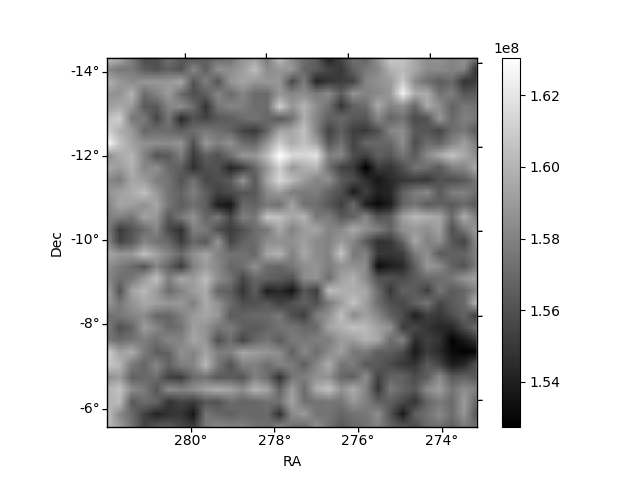
Quadrant B |
|---|---|---|---|
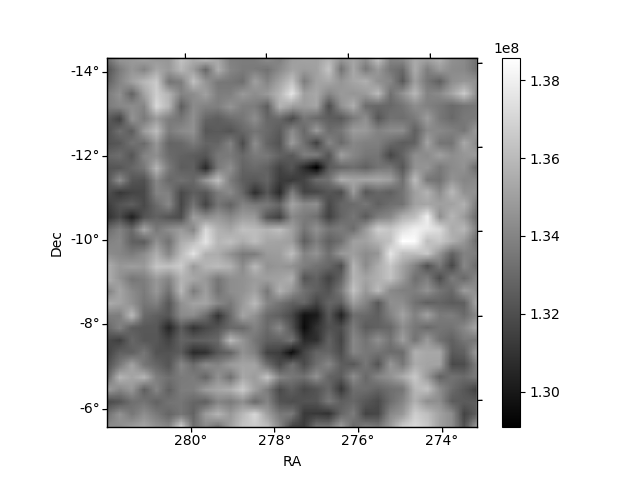
| Quadrant D | 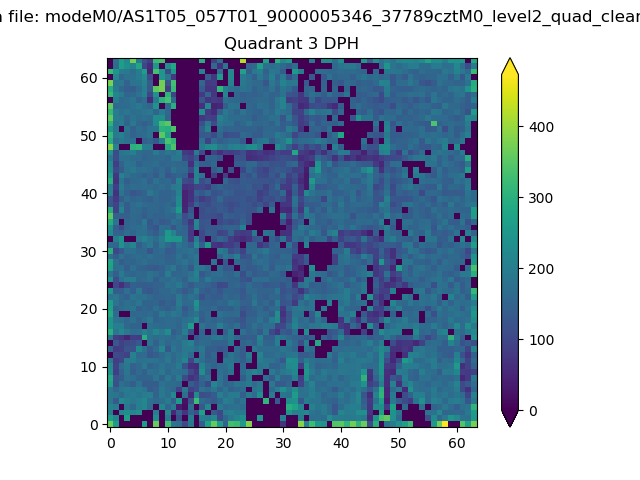 |
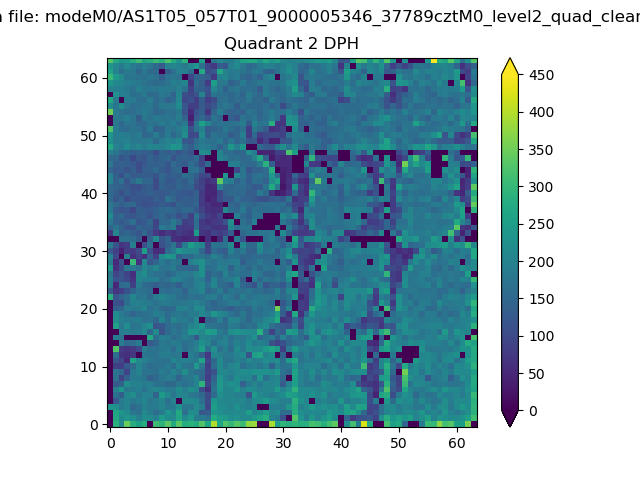 |
Quadrant C |
| Plot type | Count rate plots | Images |
|---|---|---|
| Comparison with Poisson distribution Blue bars denote a histogram of data divided into 1 sec bins. Red curve is a Poisson curve with rate = median count rate of data. |
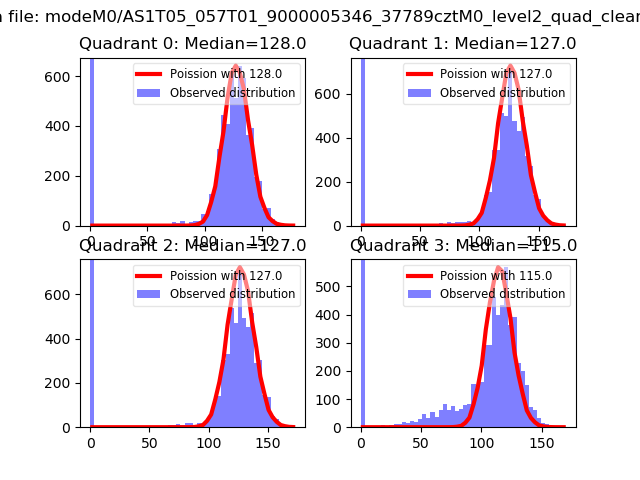 |
 |
| Quadrant-wise count rates Data is divided into 100 sec bins |
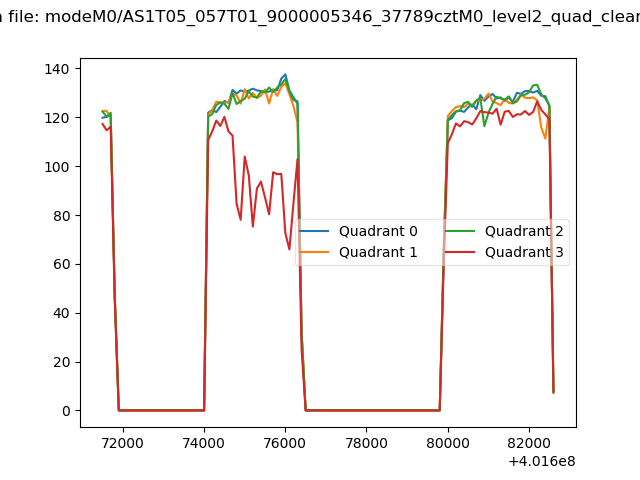 |
|
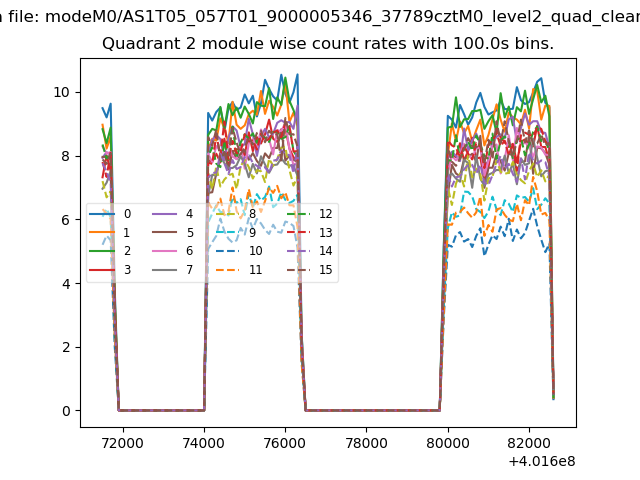
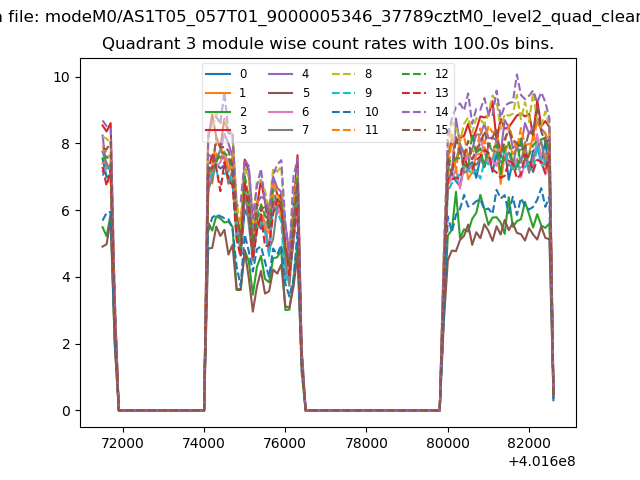
| Module-wise count rates for Quadrant A Data is divided into 100 sec bins |
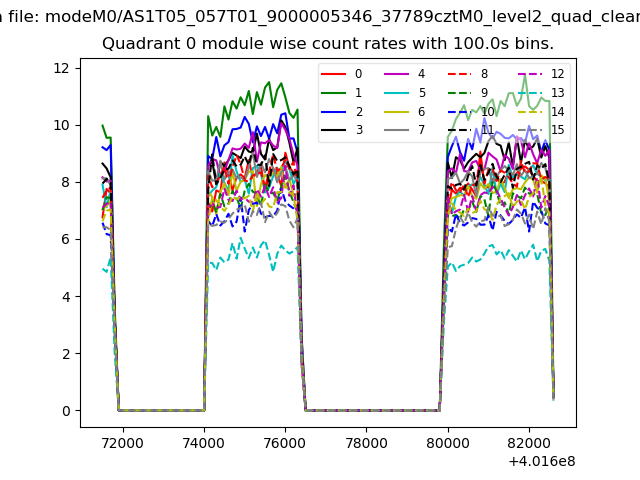 |
 |
| Module-wise count rates for Quadrant B Data is divided into 100 sec bins |
 |
 |
| Module-wise count rates for Quadrant C Data is divided into 100 sec bins |
 |
 |
| Module-wise count rates for Quadrant D Data is divided into 100 sec bins |
 |
 |
| Parameter | Plot |
|---|---|
| CZT HV Monitor | 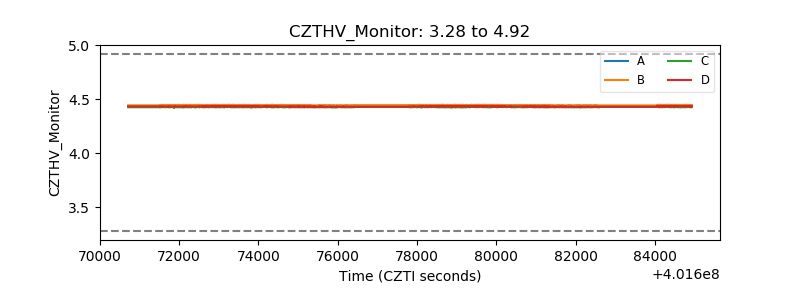 |
| D_VDD | 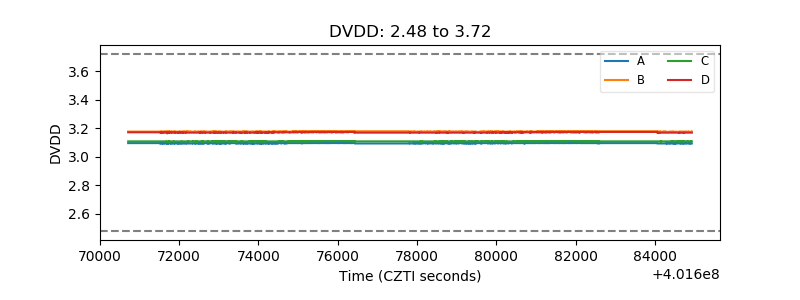 |
| Temperature 1 | 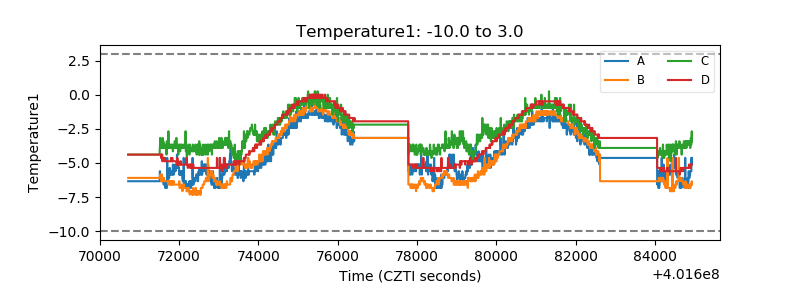 |
| Veto HV Monitor | 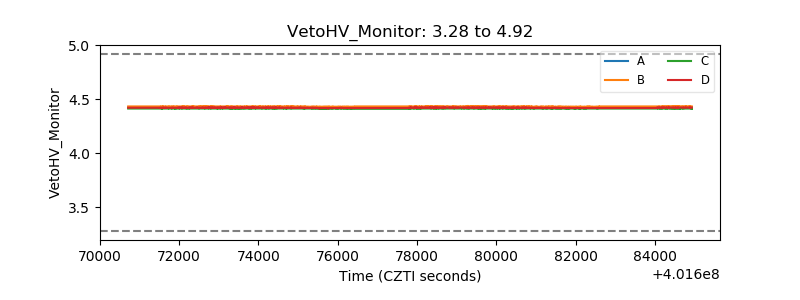 |
| Veto LLD | 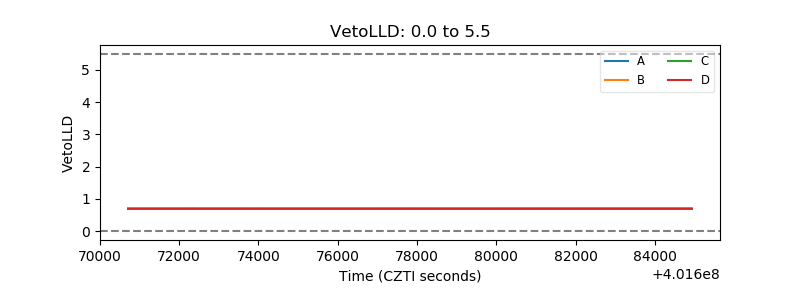 |
| Alpha Counter | 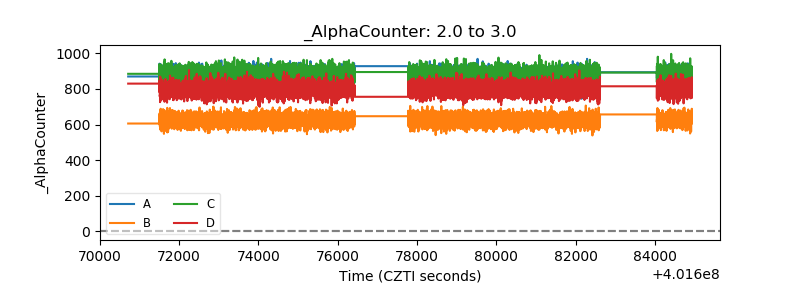 |
| _CPM_Rate | 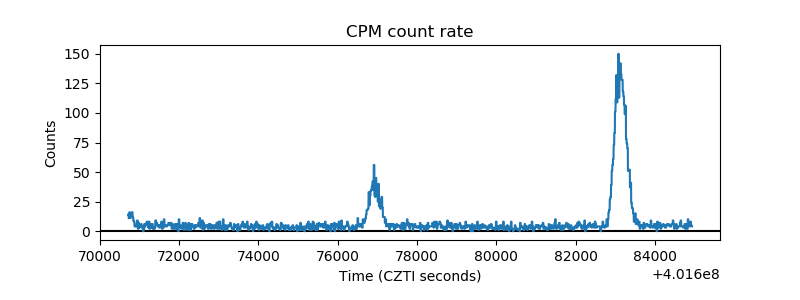 |
| CZT Counter | 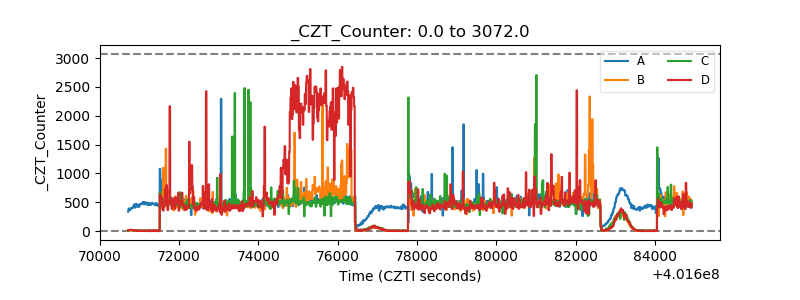 |
| +2.5 Volts monitor | 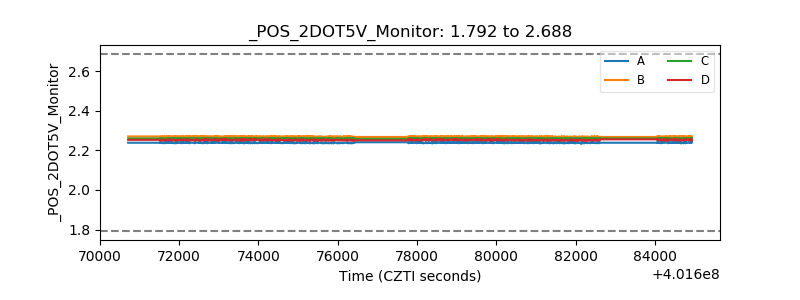 |
| +5 Volts monitor | 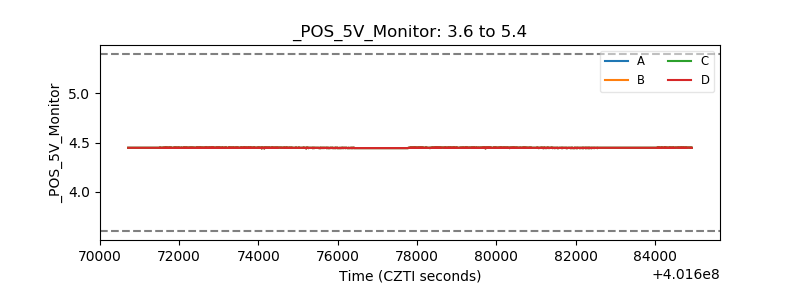 |
| _ROLL_ROT | 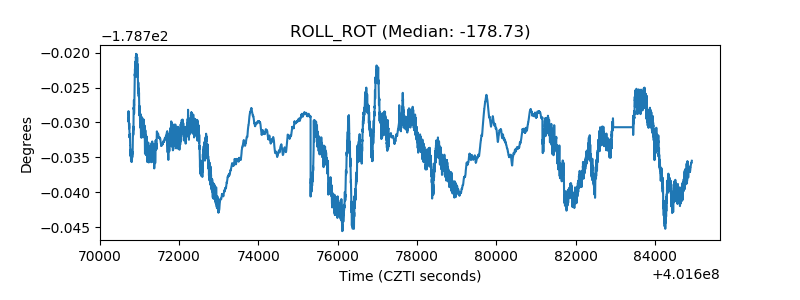 |
| _Roll_DEC | 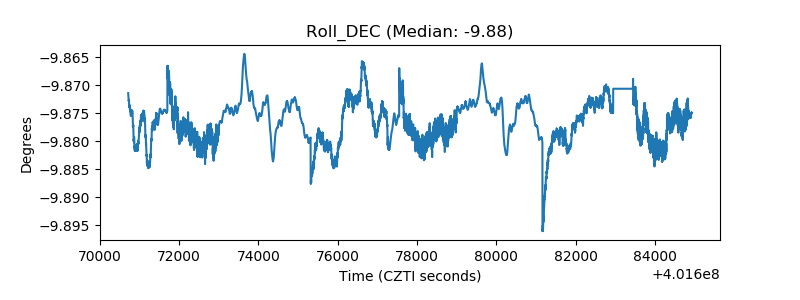 |
| _Roll_RA | 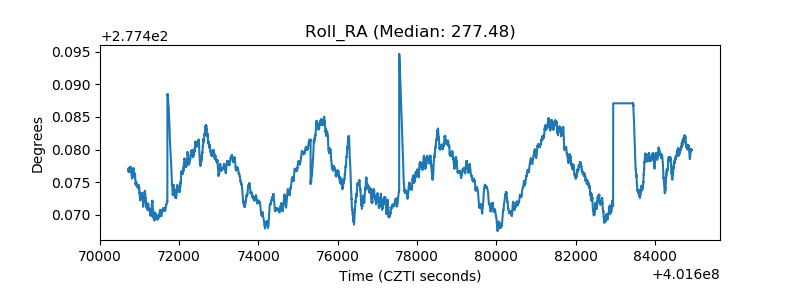 |
| Veto Counter | 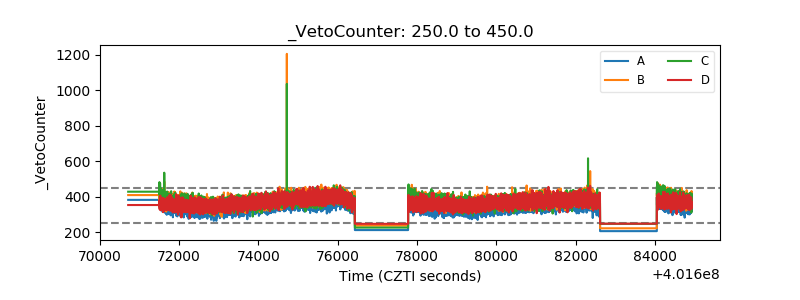 |