| Param | Original file | Final file |
|---|---|---|
| Filename | modeM0/AS1T05_057T01_9000005346_37793cztM0_level2.evt | modeM0/AS1T05_057T01_9000005346_37793cztM0_level2_quad_clean.evt |
| Size (bytes) | 413,812,800 | 79,773,120 |
| Size | 394.6 MB | 76.1 MB |
| Events in quadrant A | 2,883,589 | 521,131 |
| Events in quadrant B | 2,782,589 | 523,097 |
| Events in quadrant C | 2,829,845 | 518,346 |
| Events in quadrant D | 3,676,706 | 482,380 |
| Mode M0 | |||
|---|---|---|---|
| Quadrant | BADHDUFLAG | Total packets | Discarded packets |
| A | 0 | 11707 | 3 |
| B | 0 | 11489 | 2 |
| C | 0 | 11509 | 2 |
| D | 0 | 14383 | 2 |
| Mode SS | |||
|---|---|---|---|
| Quadrant | BADHDUFLAG | Total packets | Discarded packets |
| A | 0 | 108 | 0 |
| B | 0 | 108 | 0 |
| C | 0 | 108 | 0 |
| D | 0 | 108 | 0 |
| Mode M9 | |||
|---|---|---|---|
| Quadrant | BADHDUFLAG | Total packets | Discarded packets |
| A | 0 | 23 | 0 |
| B | 0 | 23 | 0 |
| C | 0 | 23 | 0 |
| D | 0 | 24 | 0 |
| Quadrant | Total seconds | Saturated seconds | Saturation percentage |
|---|---|---|---|
| A | 5293 | 22 | 0.415643% |
| B | 5293 | 18 | 0.340072% |
| C | 5293 | 26 | 0.491215% |
| D | 5293 | 156 | 2.947289% |
Noise dominated data is calculated using 1-second bins in cleaned event files. If a bin has >2000 counts, and if more than 50% of those come from <1% of pixels, then it is considered to be noise-dominated and hence unusable.
| Quadrant | # 1 sec bins | Bins with >0 counts | Bins with >2000 counts | High rate bins dominated by noise | Noise dominated (total time) | Noise dominated (detector-on time) | Marked lightcurve |
|---|---|---|---|---|---|---|---|
| A | 7115 | 5294 | 7 | 7 | 0.10% | 0.13% | 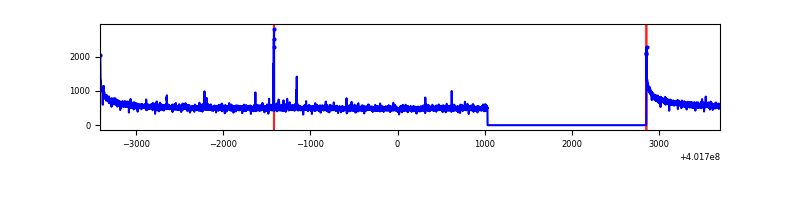 |
| B | 7115 | 5294 | 5 | 5 | 0.07% | 0.09% | 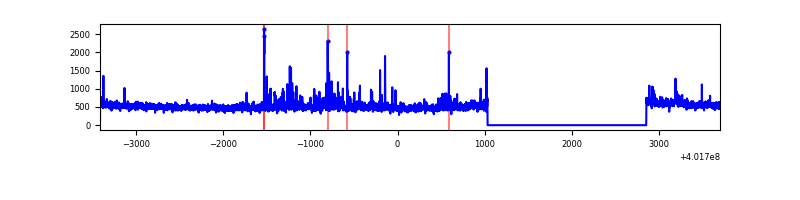 |
| C | 7115 | 5294 | 12 | 12 | 0.17% | 0.23% | 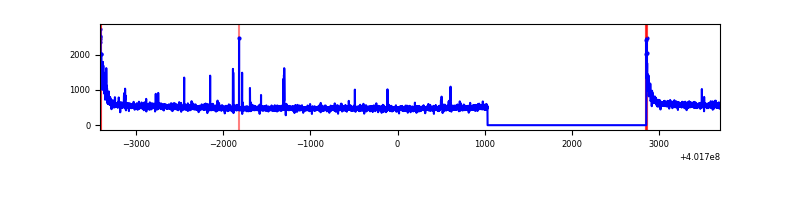 |
| D | 7115 | 5294 | 141 | 141 | 1.98% | 2.66% | 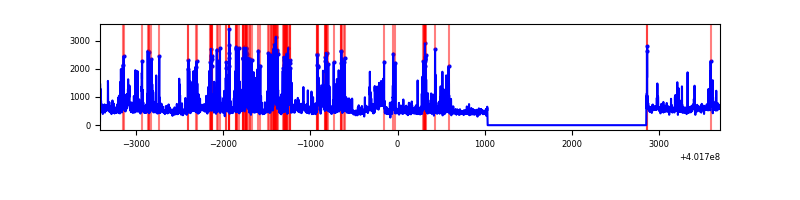 |
Top three noisy pixels from each quadrant. If the there are fewer than three noisy pixels in the level2.evt file, extra rows are filled as -1
| Pixel properties | Quadrant properties | ||||||
|---|---|---|---|---|---|---|---|
| Quadrant | DetID | PixID | Counts | Sigma | Mean | Median | Sigma |
| A | 10 | 83 | 330855 | 2518.24 | 647 | 637 | 131.1 |
| A | 13 | 248 | 20814 | 153.87 | 647 | 637 | 131.1 |
| A | 13 | 6 | 15652 | 114.5 | 647 | 637 | 131.1 |
| B | 0 | 229 | 101642 | 827.74 | 639 | 624 | 122.0 |
| B | 0 | 219 | 58843 | 477.04 | 639 | 624 | 122.0 |
| B | 0 | 230 | 37266 | 300.24 | 639 | 624 | 122.0 |
| C | 15 | 214 | 246896 | 1707.51 | 622 | 628 | 144.2 |
| C | 0 | 10 | 111424 | 768.21 | 622 | 628 | 144.2 |
| C | 0 | 207 | 42818 | 292.53 | 622 | 628 | 144.2 |
| D | 7 | 223 | 331009 | 2186.21 | 620 | 604 | 151.1 |
| D | 2 | 249 | 246478 | 1626.89 | 620 | 604 | 151.1 |
| D | 2 | 250 | 195028 | 1286.46 | 620 | 604 | 151.1 |
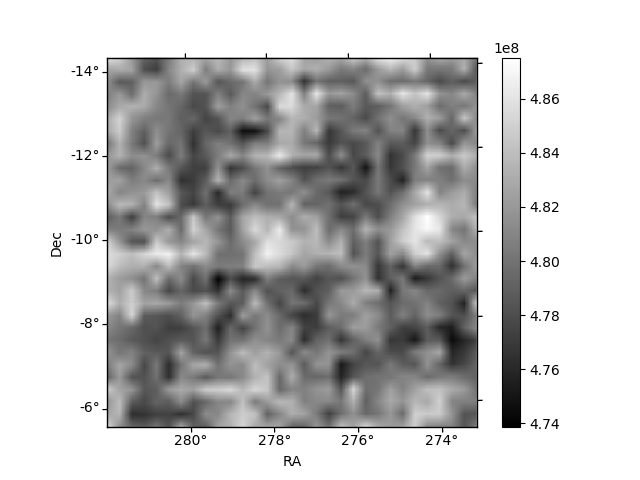
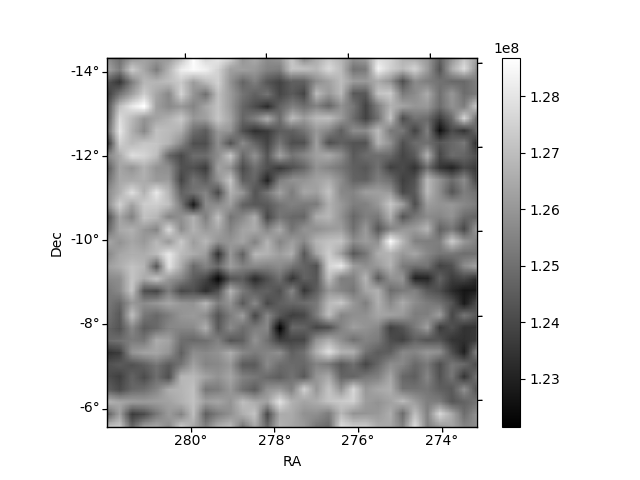
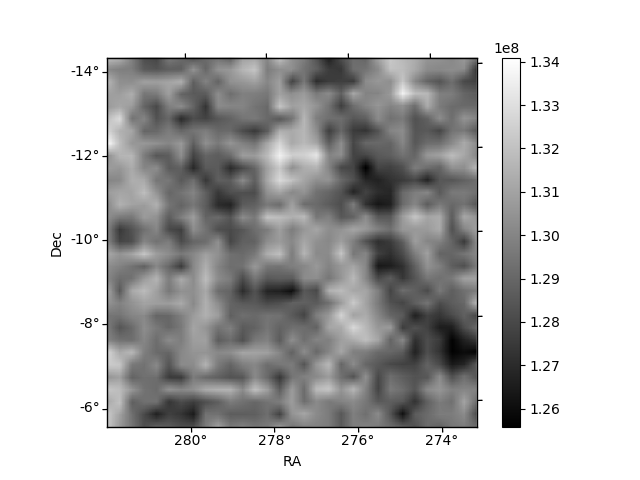
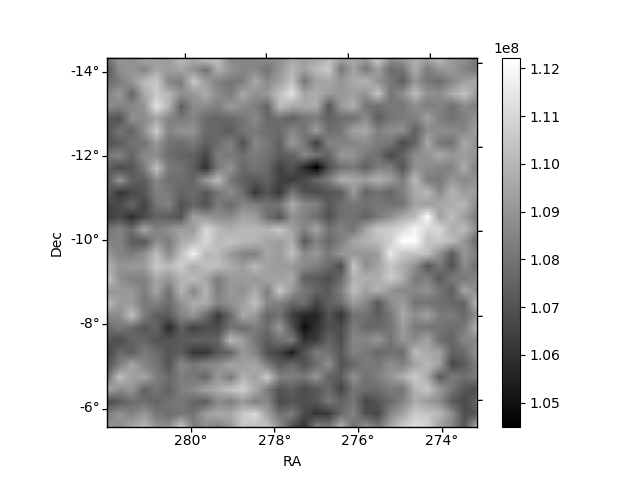
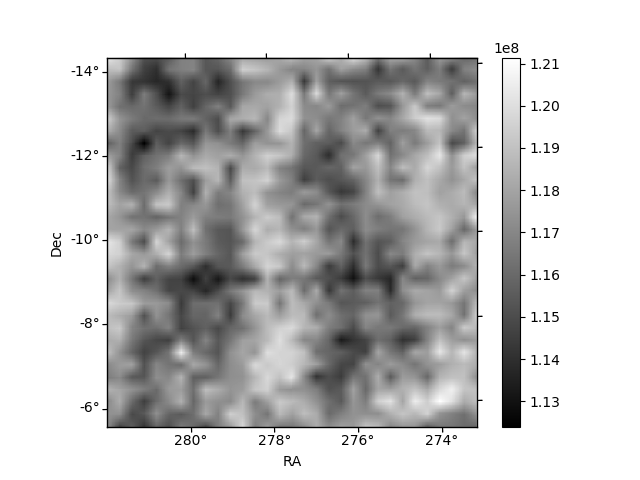
Histogram calculated using DETX and DETY for each event in the final _common_clean file
| Quadrant A | 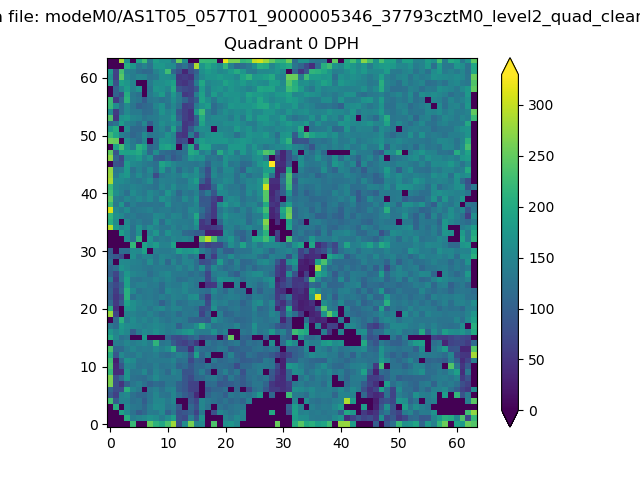 |
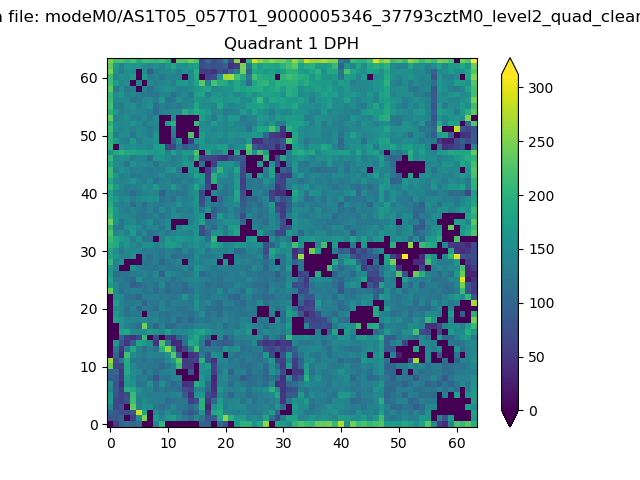 |
Quadrant B |
|---|---|---|---|
| Quadrant D | 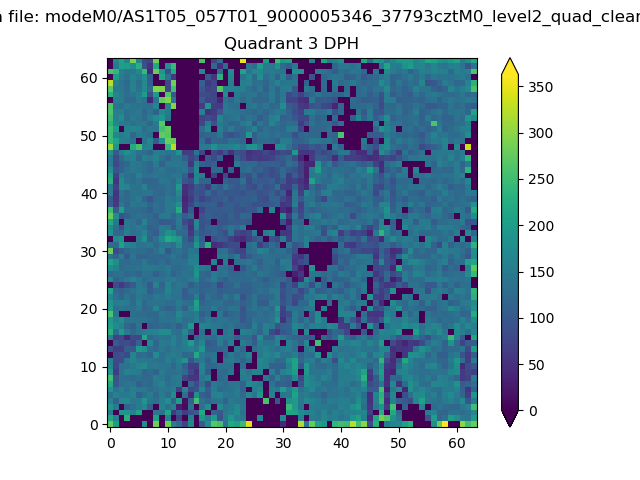 |
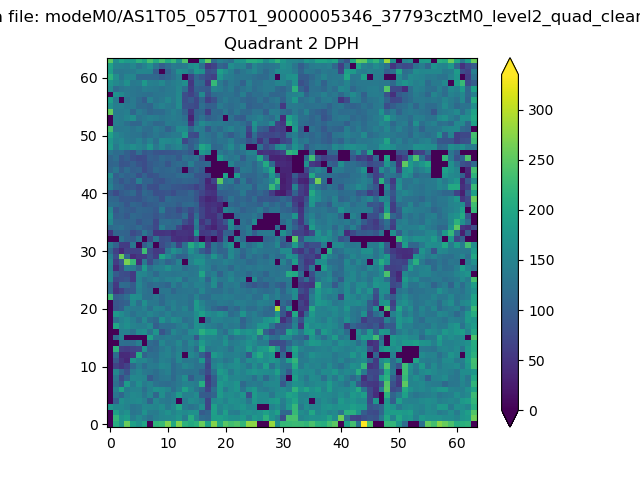 |
Quadrant C |
| Plot type | Count rate plots | Images |
|---|---|---|
| Comparison with Poisson distribution Blue bars denote a histogram of data divided into 1 sec bins. Red curve is a Poisson curve with rate = median count rate of data. |
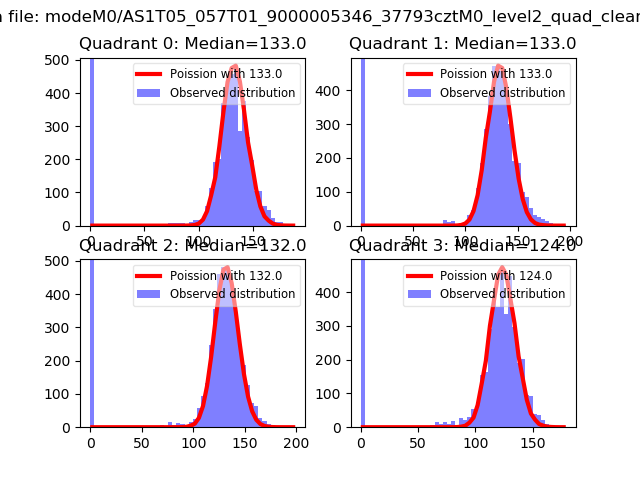 |
 |
| Quadrant-wise count rates Data is divided into 100 sec bins |
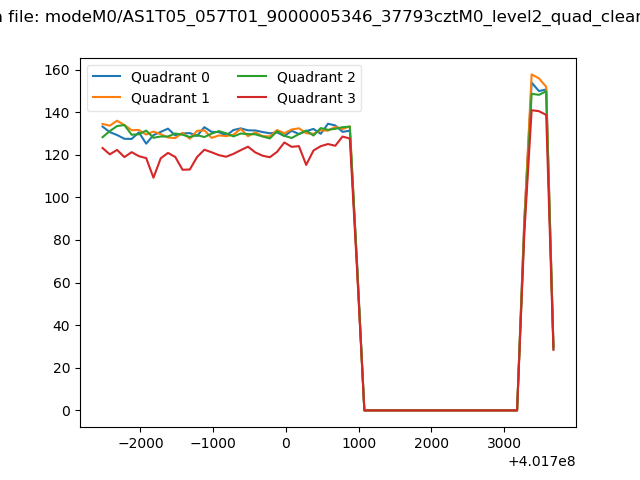 |
|
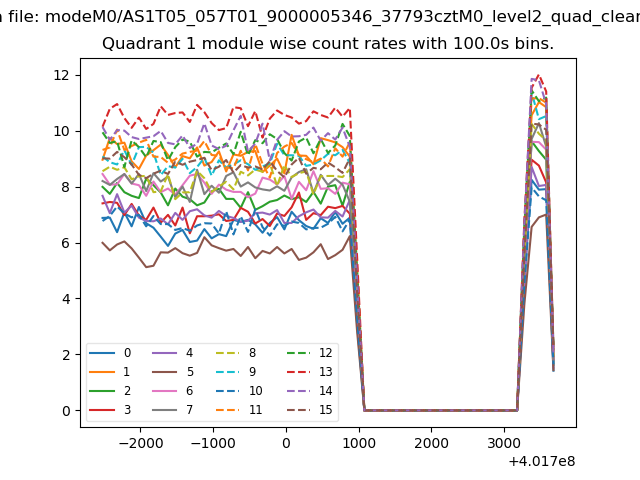
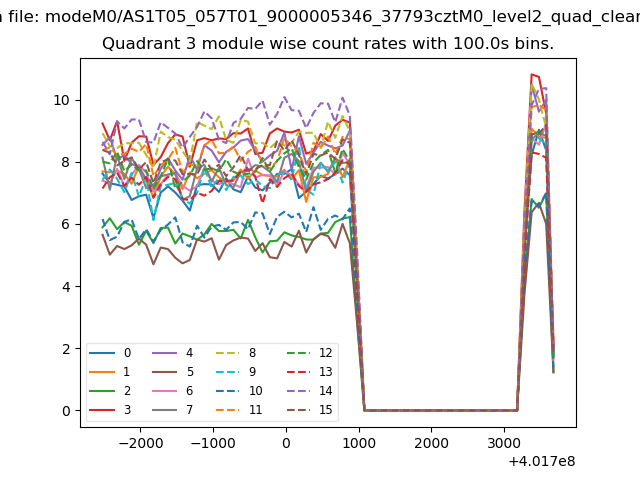
| Module-wise count rates for Quadrant A Data is divided into 100 sec bins |
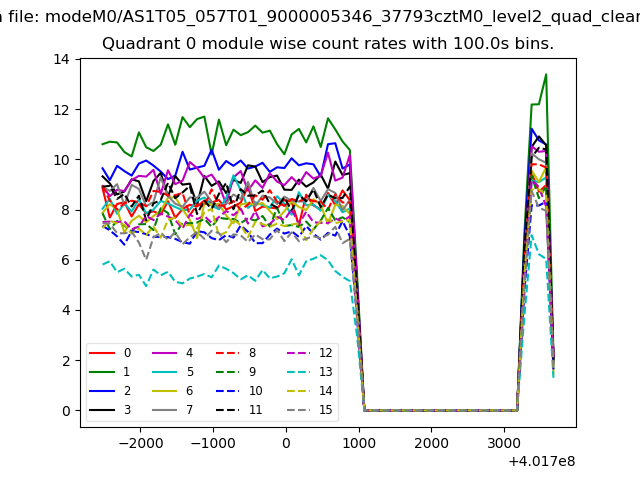 |
 |
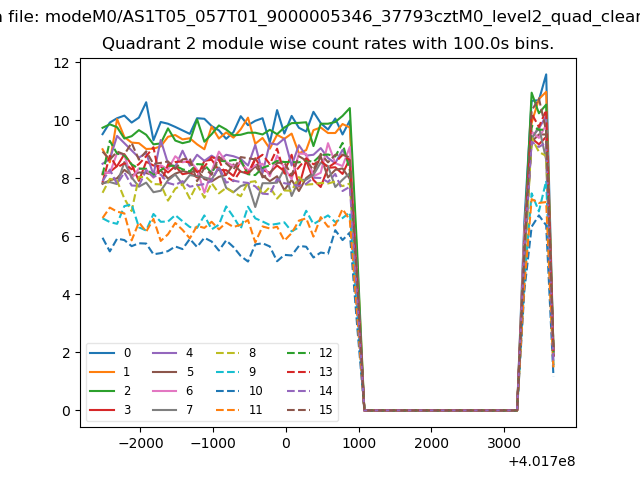
| Module-wise count rates for Quadrant B Data is divided into 100 sec bins |
 |
 |
| Module-wise count rates for Quadrant C Data is divided into 100 sec bins |
 |
 |
| Module-wise count rates for Quadrant D Data is divided into 100 sec bins |
 |
 |
| Parameter | Plot |
|---|---|
| CZT HV Monitor | 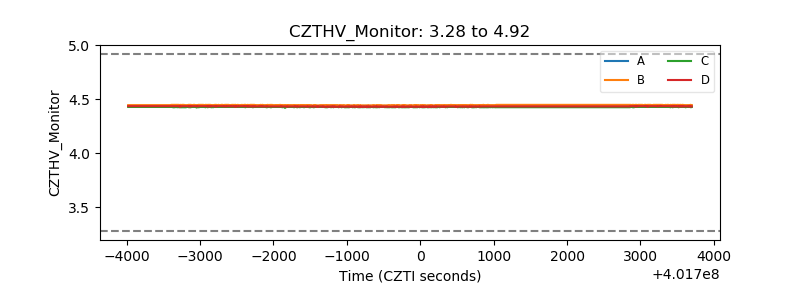 |
| D_VDD | 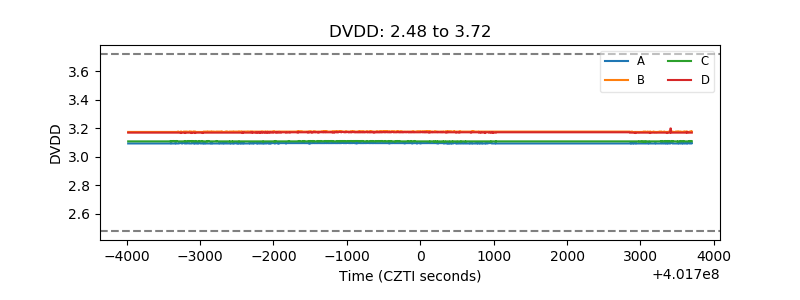 |
| Temperature 1 | 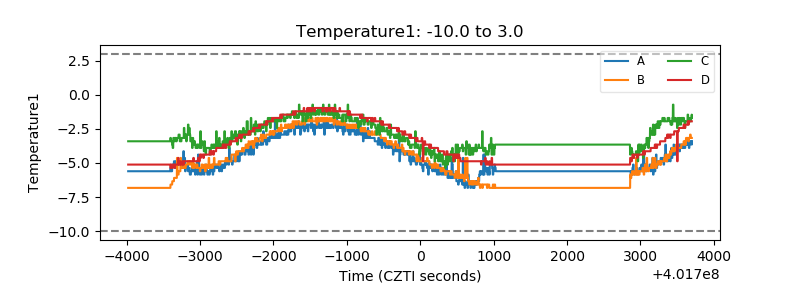 |
| Veto HV Monitor | 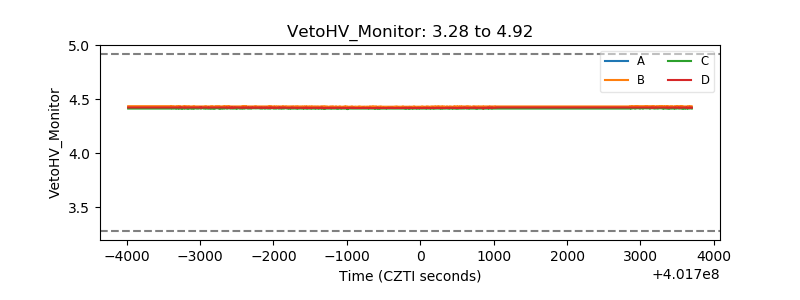 |
| Veto LLD | 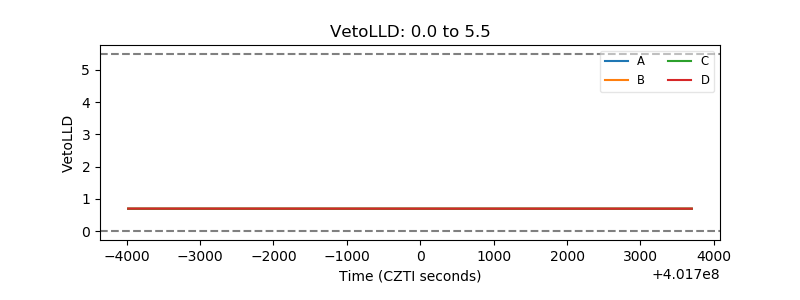 |
| Alpha Counter | 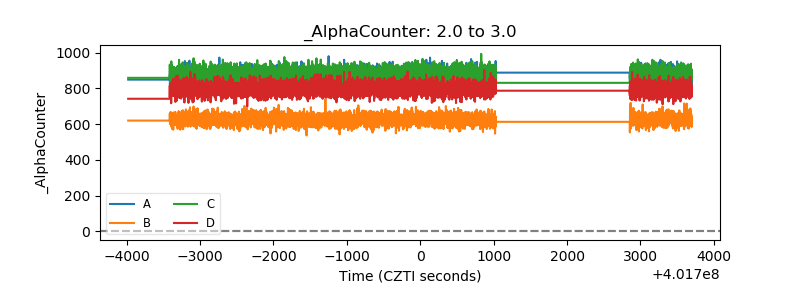 |
| _CPM_Rate | 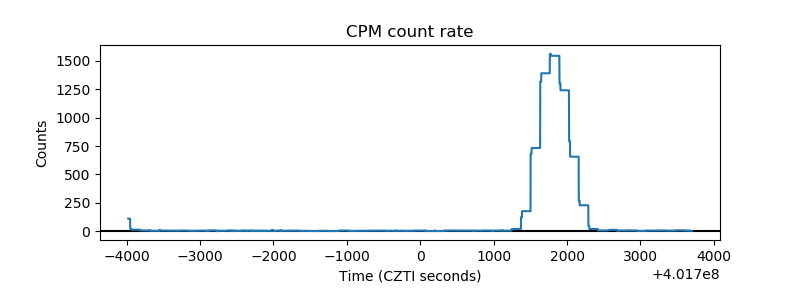 |
| CZT Counter | 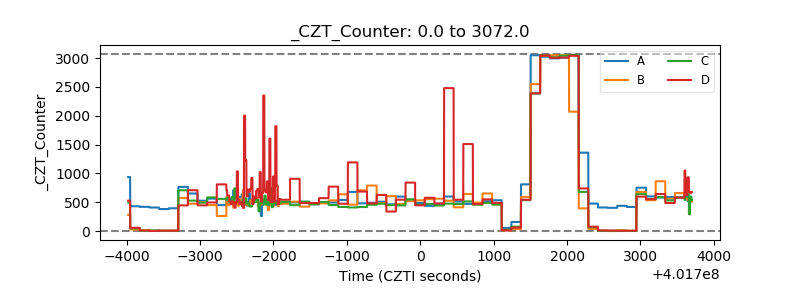 |
| +2.5 Volts monitor | 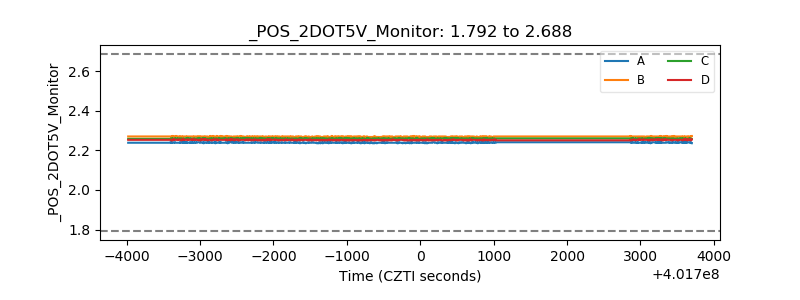 |
| +5 Volts monitor | 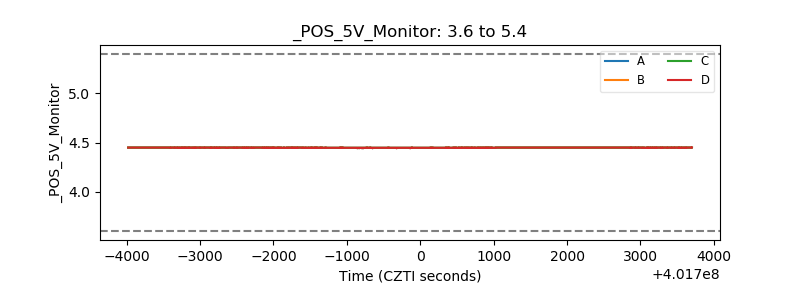 |
| _ROLL_ROT | 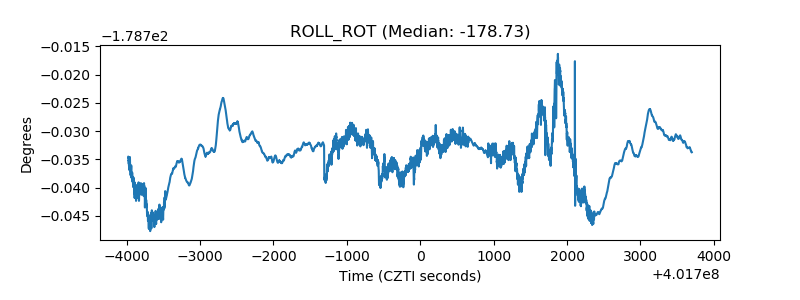 |
| _Roll_DEC | 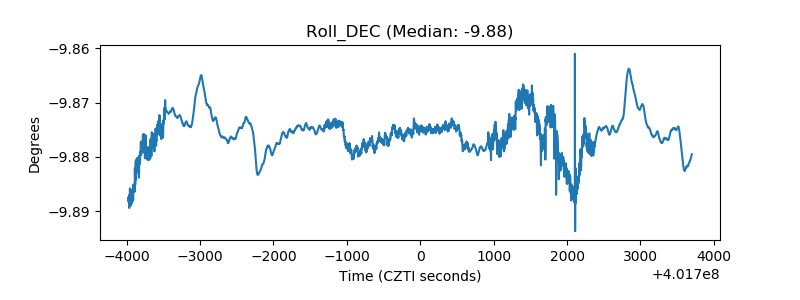 |
| _Roll_RA | 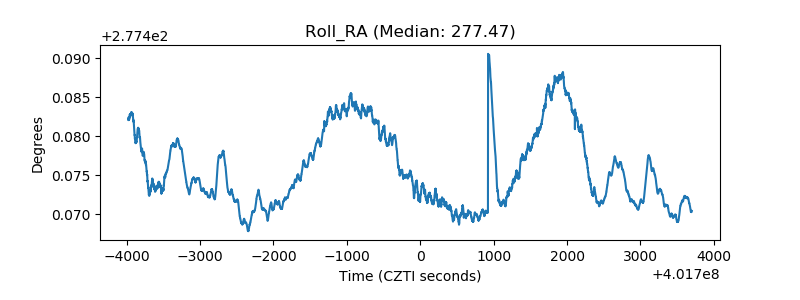 |
| Veto Counter | 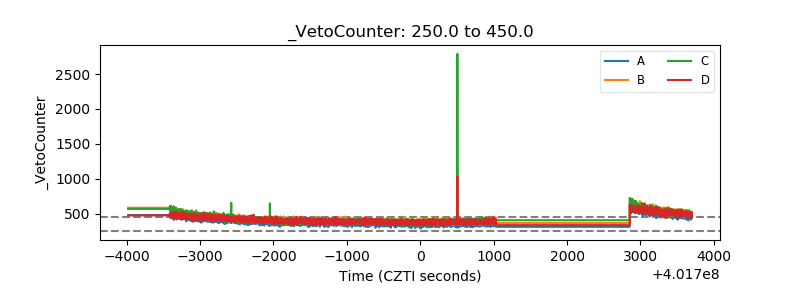 |