| Param | Original file | Final file |
|---|---|---|
| Filename | modeM0/AS1T05_057T01_9000005346_37794cztM0_level2.evt | modeM0/AS1T05_057T01_9000005346_37794cztM0_level2_quad_clean.evt |
| Size (bytes) | 445,435,200 | 93,352,320 |
| Size | 424.8 MB | 89.0 MB |
| Events in quadrant A | 3,143,502 | 630,422 |
| Events in quadrant B | 2,910,468 | 635,388 |
| Events in quadrant C | 2,838,348 | 623,360 |
| Events in quadrant D | 4,248,194 | 576,984 |
| Mode M0 | |||
|---|---|---|---|
| Quadrant | BADHDUFLAG | Total packets | Discarded packets |
| A | 0 | 12537 | 3 |
| B | 0 | 11842 | 2 |
| C | 0 | 11496 | 2 |
| D | 0 | 16176 | 2 |
| Mode SS | |||
|---|---|---|---|
| Quadrant | BADHDUFLAG | Total packets | Discarded packets |
| A | 0 | 104 | 0 |
| B | 0 | 104 | 0 |
| C | 0 | 104 | 0 |
| D | 0 | 104 | 0 |
| Mode M9 | |||
|---|---|---|---|
| Quadrant | BADHDUFLAG | Total packets | Discarded packets |
| A | 0 | 28 | 0 |
| B | 0 | 28 | 0 |
| C | 0 | 28 | 0 |
| D | 0 | 29 | 0 |
| Quadrant | Total seconds | Saturated seconds | Saturation percentage |
|---|---|---|---|
| A | 5155 | 46 | 0.892338% |
| B | 5155 | 29 | 0.562561% |
| C | 5155 | 29 | 0.562561% |
| D | 5155 | 282 | 5.470417% |
Noise dominated data is calculated using 1-second bins in cleaned event files. If a bin has >2000 counts, and if more than 50% of those come from <1% of pixels, then it is considered to be noise-dominated and hence unusable.
| Quadrant | # 1 sec bins | Bins with >0 counts | Bins with >2000 counts | High rate bins dominated by noise | Noise dominated (total time) | Noise dominated (detector-on time) | Marked lightcurve |
|---|---|---|---|---|---|---|---|
| A | 7098 | 5156 | 29 | 29 | 0.41% | 0.56% | 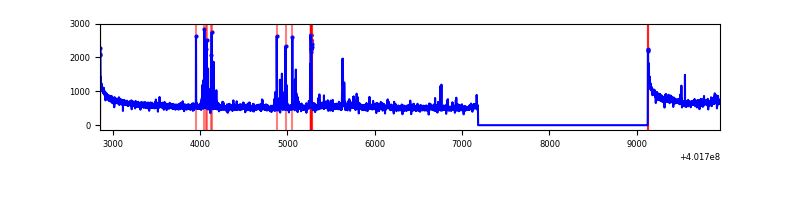 |
| B | 7098 | 5156 | 18 | 18 | 0.25% | 0.35% | 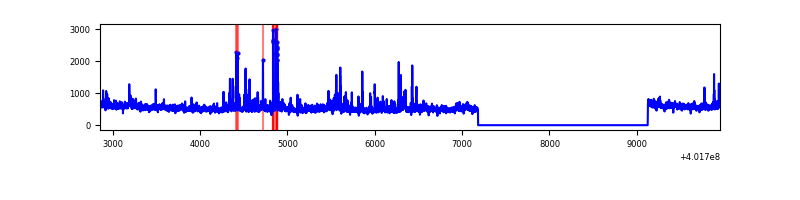 |
| C | 7098 | 5156 | 15 | 15 | 0.21% | 0.29% | 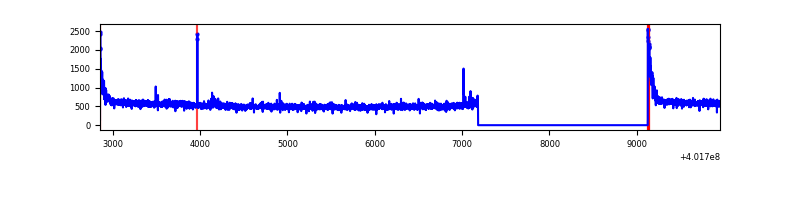 |
| D | 7098 | 5156 | 305 | 305 | 4.30% | 5.92% | 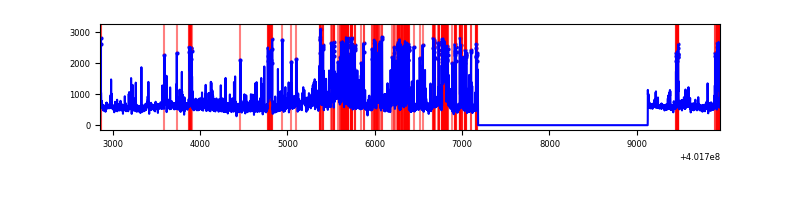 |
Top three noisy pixels from each quadrant. If the there are fewer than three noisy pixels in the level2.evt file, extra rows are filled as -1
| Pixel properties | Quadrant properties | ||||||
|---|---|---|---|---|---|---|---|
| Quadrant | DetID | PixID | Counts | Sigma | Mean | Median | Sigma |
| A | 10 | 83 | 332935 | 2531.85 | 657 | 647 | 131.2 |
| A | 15 | 222 | 107677 | 815.51 | 657 | 647 | 131.2 |
| A | 9 | 143 | 75790 | 572.55 | 657 | 647 | 131.2 |
| B | 0 | 229 | 136988 | 1111.08 | 646 | 632 | 122.7 |
| B | 5 | 172 | 91093 | 737.11 | 646 | 632 | 122.7 |
| B | 0 | 230 | 57002 | 459.32 | 646 | 632 | 122.7 |
| C | 15 | 214 | 240702 | 1653.71 | 628 | 634 | 145.2 |
| C | 0 | 10 | 104772 | 717.36 | 628 | 634 | 145.2 |
| C | 0 | 207 | 20914 | 139.7 | 628 | 634 | 145.2 |
| D | 13 | 249 | 774829 | 5079.35 | 625 | 610 | 152.4 |
| D | 12 | 235 | 301648 | 1974.99 | 625 | 610 | 152.4 |
| D | 7 | 223 | 161670 | 1056.65 | 625 | 610 | 152.4 |
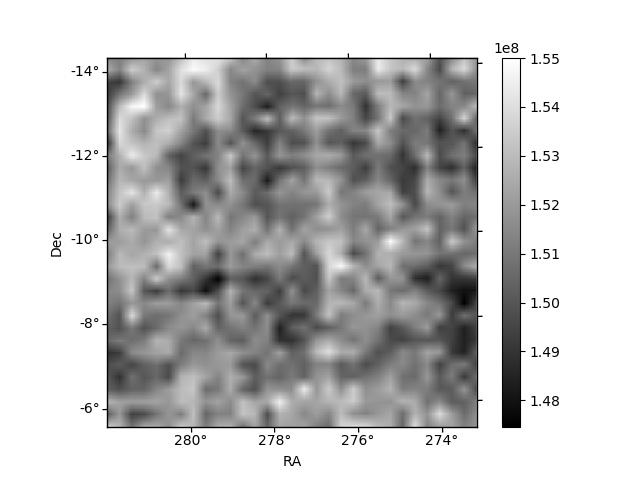
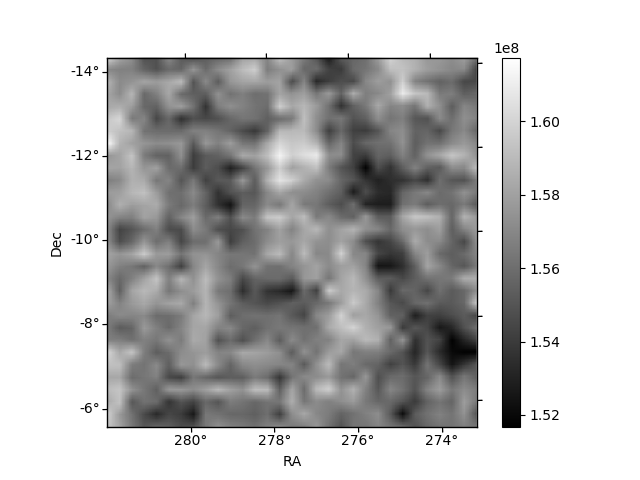
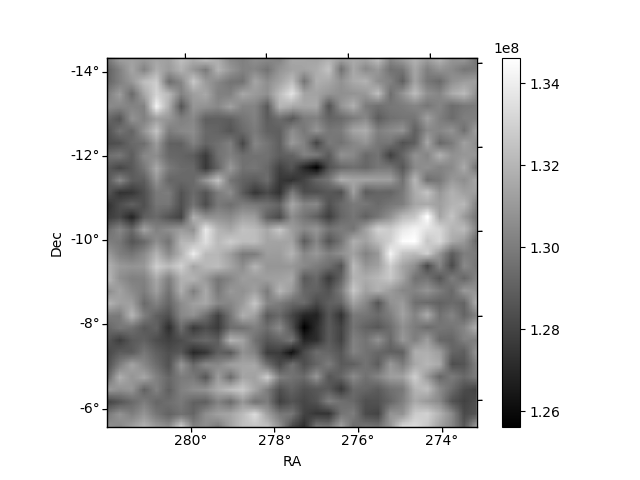
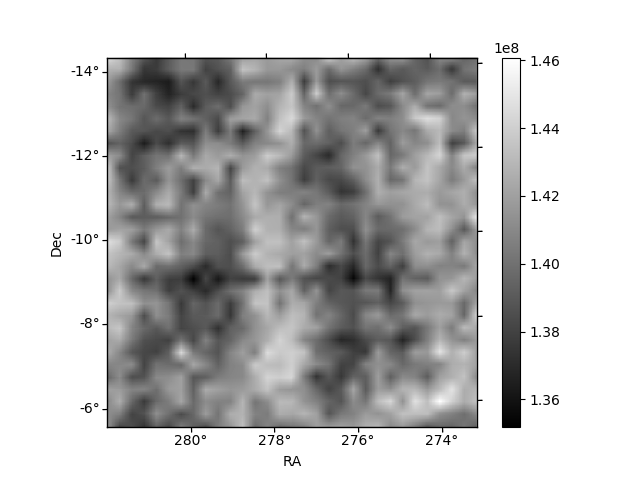
Histogram calculated using DETX and DETY for each event in the final _common_clean file
| Quadrant A | 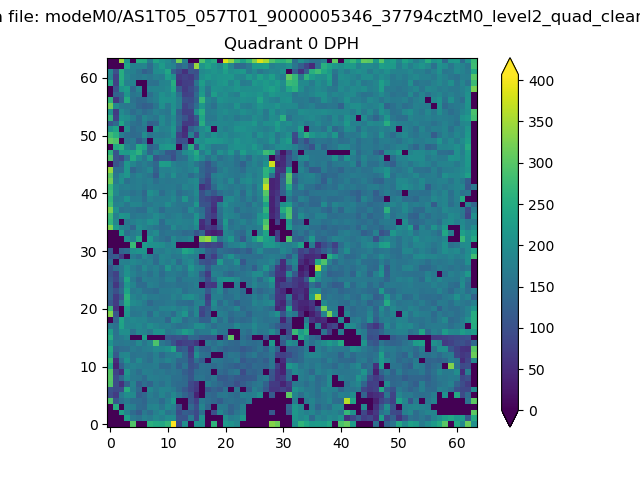 |
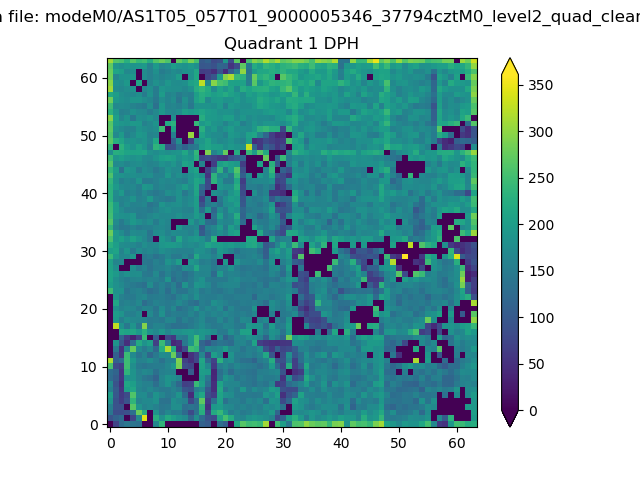 |
Quadrant B |
|---|---|---|---|
| Quadrant D | 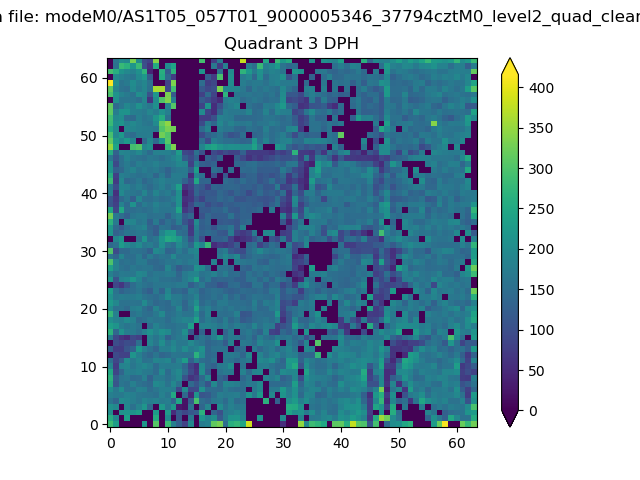 |
 |
Quadrant C |
| Plot type | Count rate plots | Images |
|---|---|---|
| Comparison with Poisson distribution Blue bars denote a histogram of data divided into 1 sec bins. Red curve is a Poisson curve with rate = median count rate of data. |
 |
 |
| Quadrant-wise count rates Data is divided into 100 sec bins |
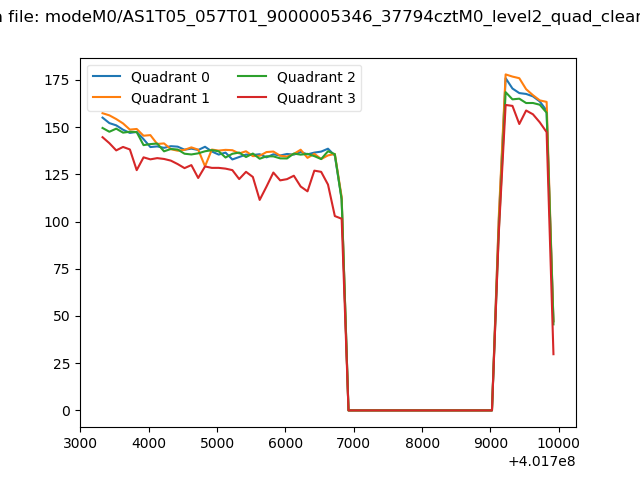 |
|
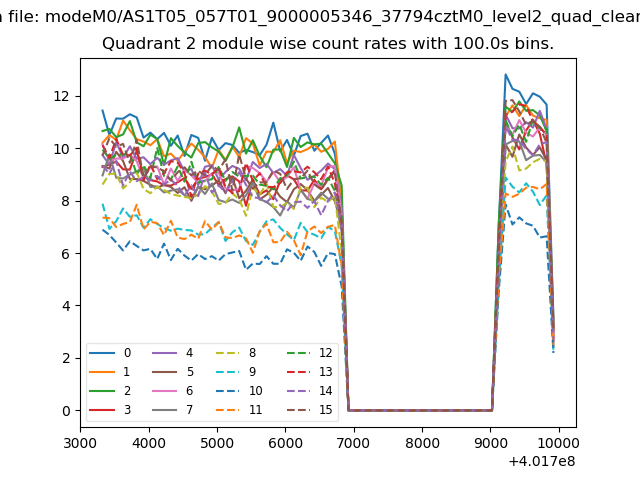
| Module-wise count rates for Quadrant A Data is divided into 100 sec bins |
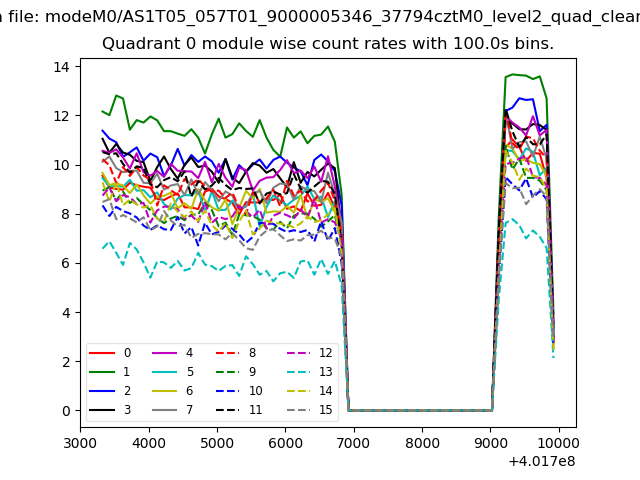 |
 |
| Module-wise count rates for Quadrant B Data is divided into 100 sec bins |
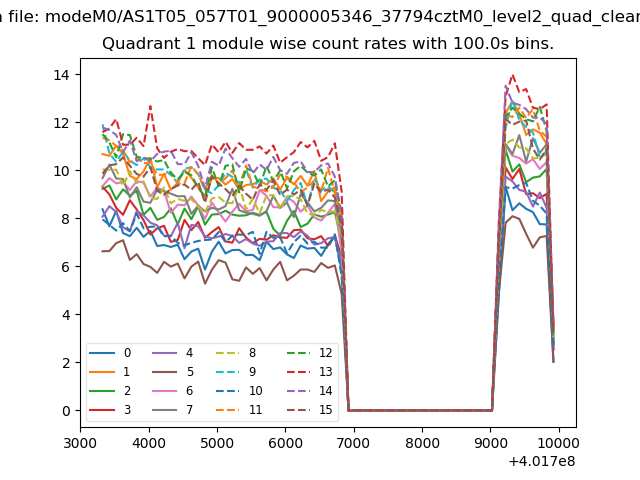 |
 |
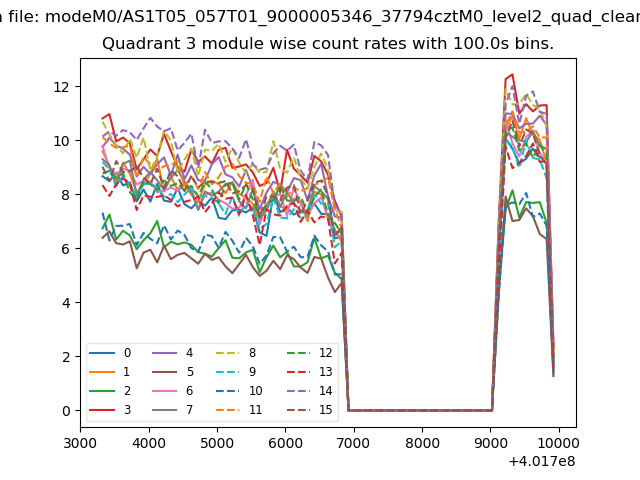
| Module-wise count rates for Quadrant C Data is divided into 100 sec bins |
 |
 |
| Module-wise count rates for Quadrant D Data is divided into 100 sec bins |
 |
 |
| Parameter | Plot |
|---|---|
| CZT HV Monitor | 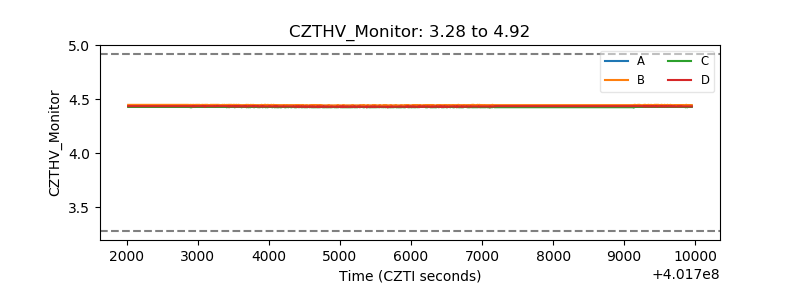 |
| D_VDD | 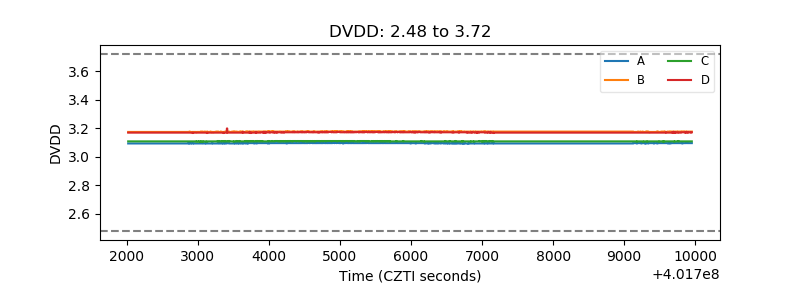 |
| Temperature 1 | 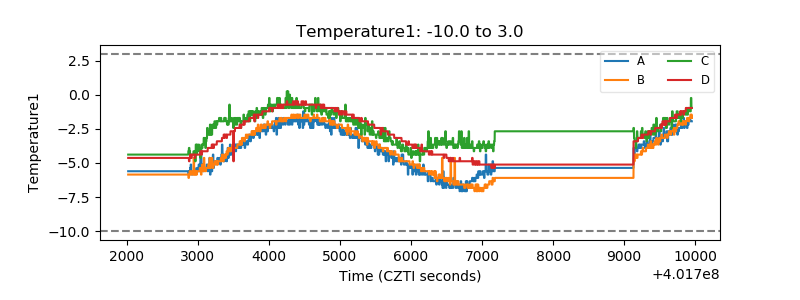 |
| Veto HV Monitor |  |
| Veto LLD | 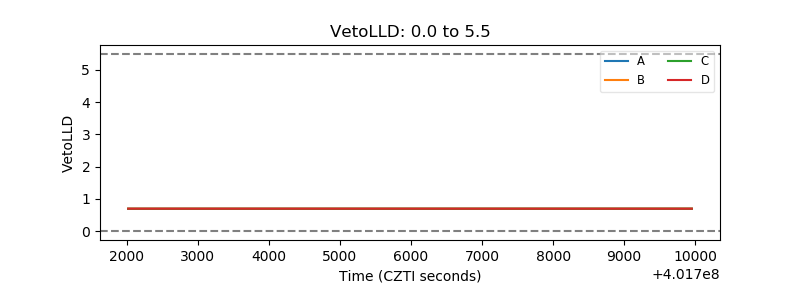 |
| Alpha Counter | 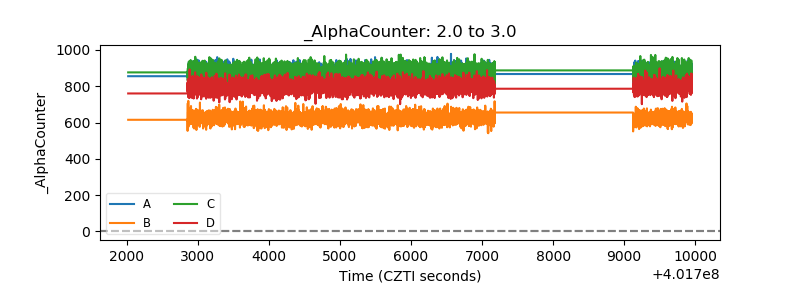 |
| _CPM_Rate | 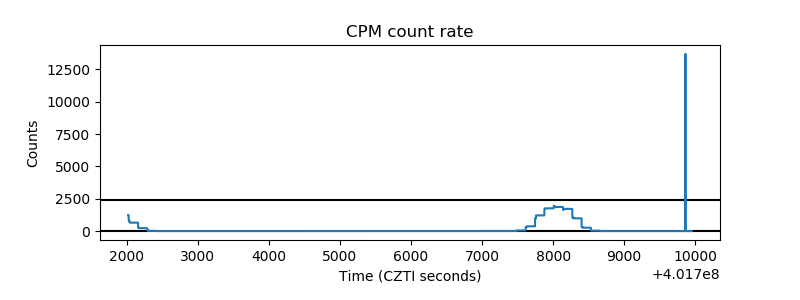 |
| CZT Counter | 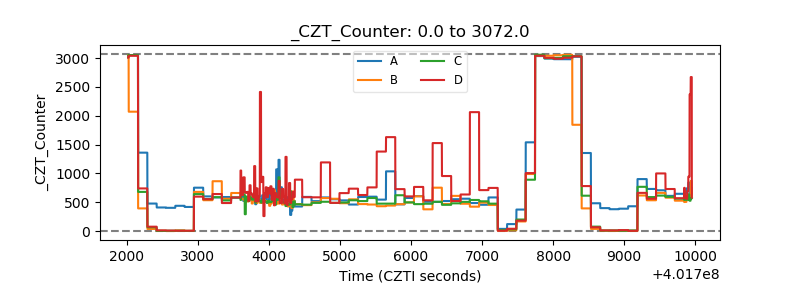 |
| +2.5 Volts monitor | 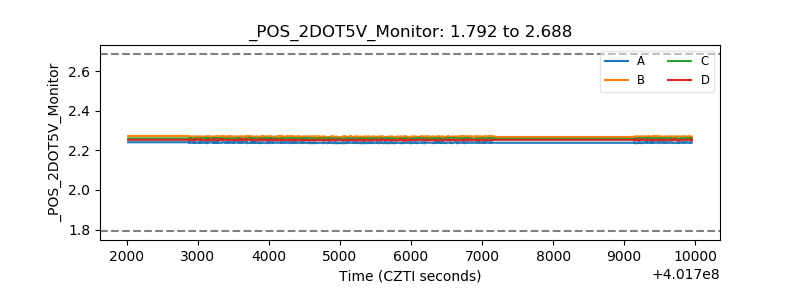 |
| +5 Volts monitor | 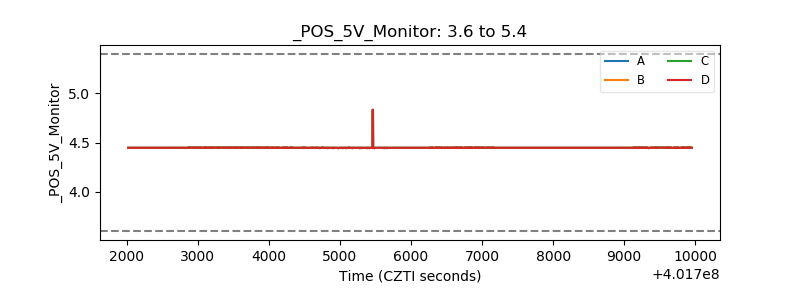 |
| _ROLL_ROT | 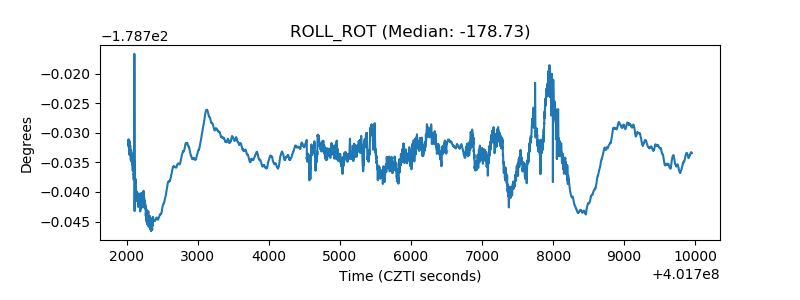 |
| _Roll_DEC | 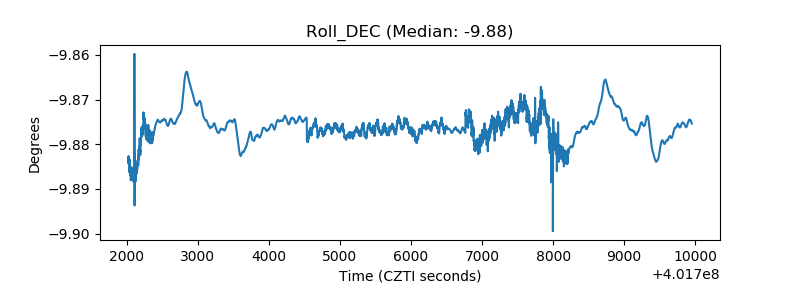 |
| _Roll_RA | 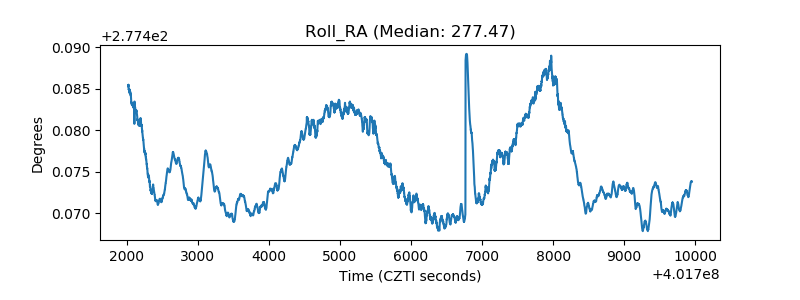 |
| Veto Counter | 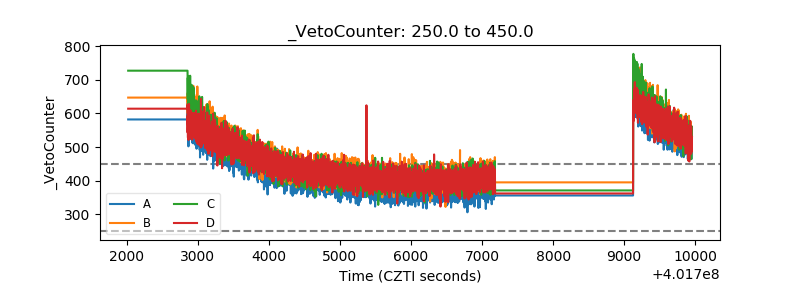 |