| Param | Original file | Final file |
|---|---|---|
| Filename | modeM0/AS1T05_057T01_9000005346_37795cztM0_level2.evt | modeM0/AS1T05_057T01_9000005346_37795cztM0_level2_quad_clean.evt |
| Size (bytes) | 451,926,720 | 96,589,440 |
| Size | 431.0 MB | 92.1 MB |
| Events in quadrant A | 3,047,490 | 668,078 |
| Events in quadrant B | 3,248,829 | 657,620 |
| Events in quadrant C | 2,800,335 | 651,810 |
| Events in quadrant D | 4,251,386 | 597,568 |
| Mode M0 | |||
|---|---|---|---|
| Quadrant | BADHDUFLAG | Total packets | Discarded packets |
| A | 0 | 12337 | 3 |
| B | 0 | 12842 | 2 |
| C | 0 | 11257 | 2 |
| D | 0 | 16030 | 2 |
| Mode SS | |||
|---|---|---|---|
| Quadrant | BADHDUFLAG | Total packets | Discarded packets |
| A | 0 | 102 | 0 |
| B | 0 | 102 | 0 |
| C | 0 | 102 | 0 |
| D | 0 | 102 | 0 |
| Mode M9 | |||
|---|---|---|---|
| Quadrant | BADHDUFLAG | Total packets | Discarded packets |
| A | 0 | 28 | 0 |
| B | 0 | 28 | 0 |
| C | 0 | 28 | 0 |
| D | 0 | 29 | 0 |
| Quadrant | Total seconds | Saturated seconds | Saturation percentage |
|---|---|---|---|
| A | 4989 | 27 | 0.541191% |
| B | 4989 | 173 | 3.467629% |
| C | 4989 | 33 | 0.661455% |
| D | 4989 | 359 | 7.195831% |
Noise dominated data is calculated using 1-second bins in cleaned event files. If a bin has >2000 counts, and if more than 50% of those come from <1% of pixels, then it is considered to be noise-dominated and hence unusable.
| Quadrant | # 1 sec bins | Bins with >0 counts | Bins with >2000 counts | High rate bins dominated by noise | Noise dominated (total time) | Noise dominated (detector-on time) | Marked lightcurve |
|---|---|---|---|---|---|---|---|
| A | 7052 | 4990 | 7 | 7 | 0.10% | 0.14% | 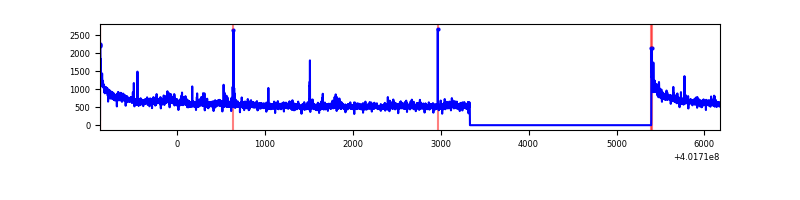 |
| B | 7052 | 4990 | 154 | 154 | 2.18% | 3.09% | 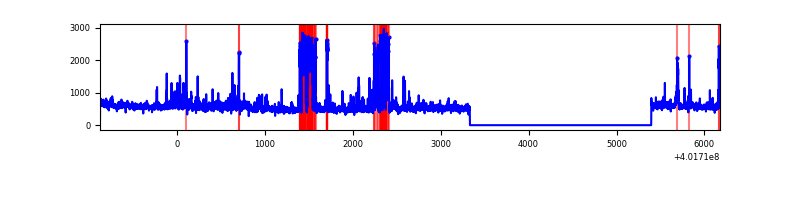 |
| C | 7052 | 4990 | 21 | 21 | 0.30% | 0.42% | 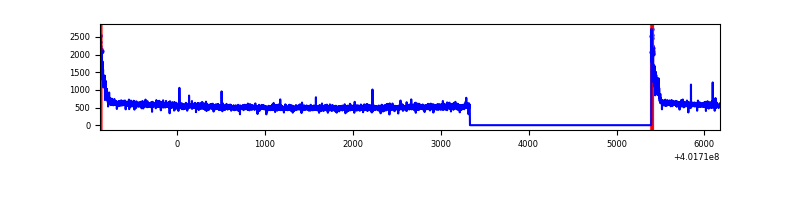 |
| D | 7052 | 4990 | 357 | 357 | 5.06% | 7.15% | 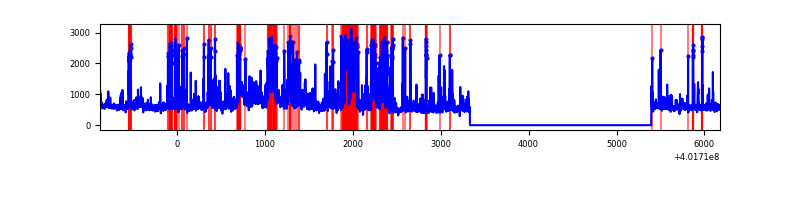 |
Top three noisy pixels from each quadrant. If the there are fewer than three noisy pixels in the level2.evt file, extra rows are filled as -1
| Pixel properties | Quadrant properties | ||||||
|---|---|---|---|---|---|---|---|
| Quadrant | DetID | PixID | Counts | Sigma | Mean | Median | Sigma |
| A | 10 | 83 | 336421 | 2566.44 | 651 | 641 | 130.8 |
| A | 15 | 222 | 118447 | 900.42 | 651 | 641 | 130.8 |
| A | 13 | 6 | 25611 | 190.85 | 651 | 641 | 130.8 |
| B | 0 | 229 | 237073 | 1991.65 | 628 | 614 | 118.7 |
| B | 5 | 172 | 227990 | 1915.14 | 628 | 614 | 118.7 |
| B | 4 | 81 | 133629 | 1120.36 | 628 | 614 | 118.7 |
| C | 15 | 214 | 233220 | 1635.58 | 618 | 625 | 142.2 |
| C | 0 | 10 | 140170 | 981.26 | 618 | 625 | 142.2 |
| C | 0 | 207 | 11165 | 74.12 | 618 | 625 | 142.2 |
| D | 13 | 249 | 922039 | 6048.92 | 612 | 596 | 152.3 |
| D | 12 | 235 | 355327 | 2328.67 | 612 | 596 | 152.3 |
| D | 7 | 223 | 98797 | 644.65 | 612 | 596 | 152.3 |
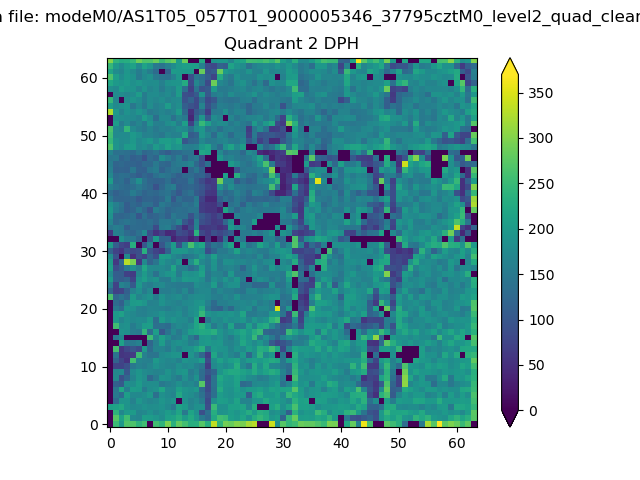
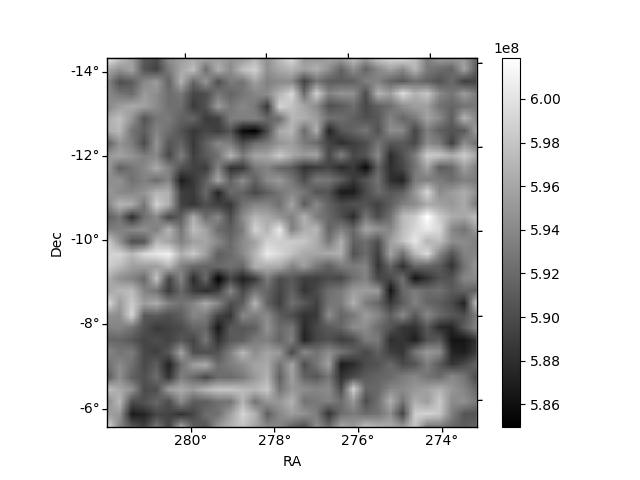
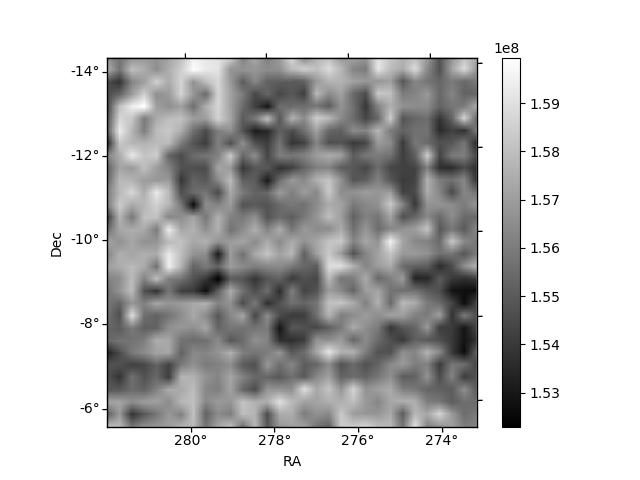
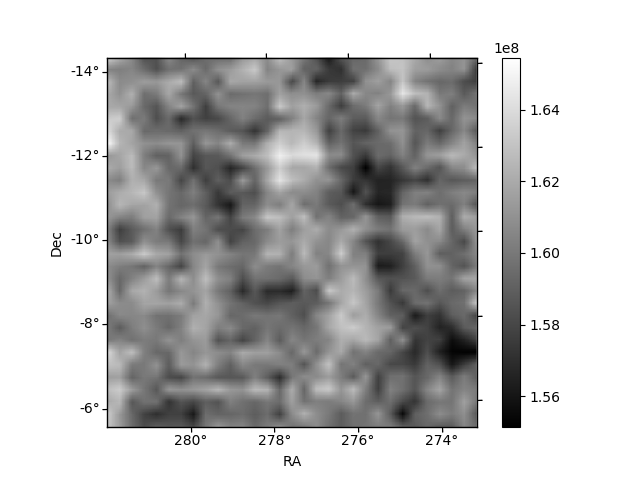
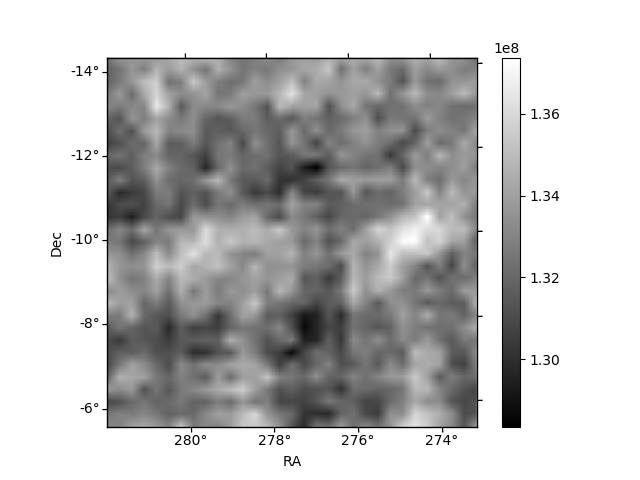
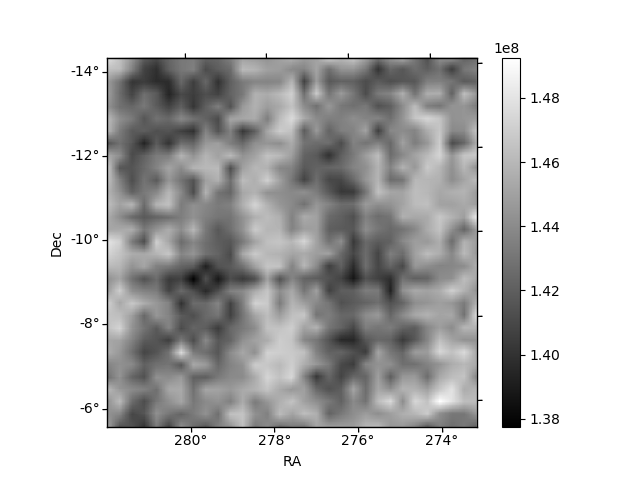
Histogram calculated using DETX and DETY for each event in the final _common_clean file
| Quadrant A | 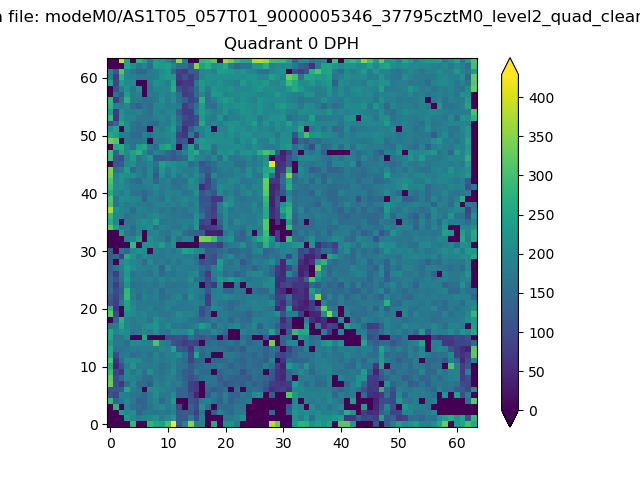 |
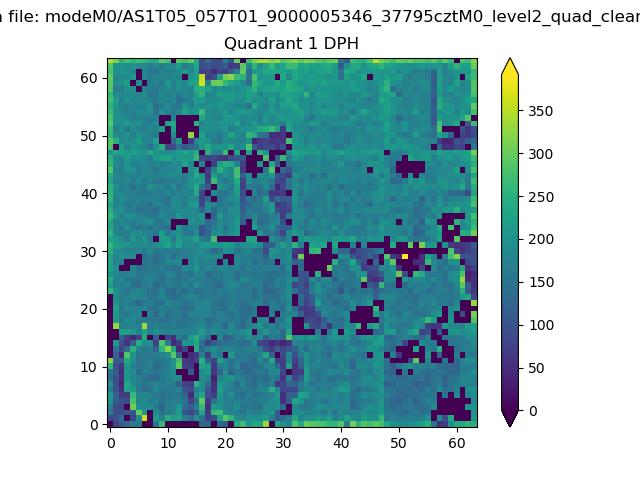 |
Quadrant B |
|---|---|---|---|
| Quadrant D | 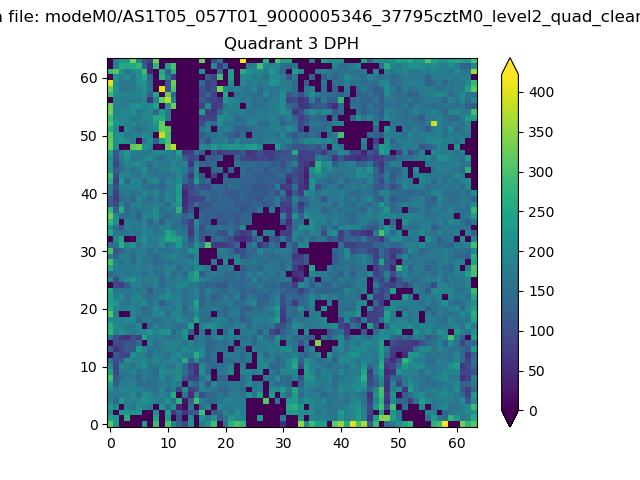 |
 |
Quadrant C |
| Plot type | Count rate plots | Images |
|---|---|---|
| Comparison with Poisson distribution Blue bars denote a histogram of data divided into 1 sec bins. Red curve is a Poisson curve with rate = median count rate of data. |
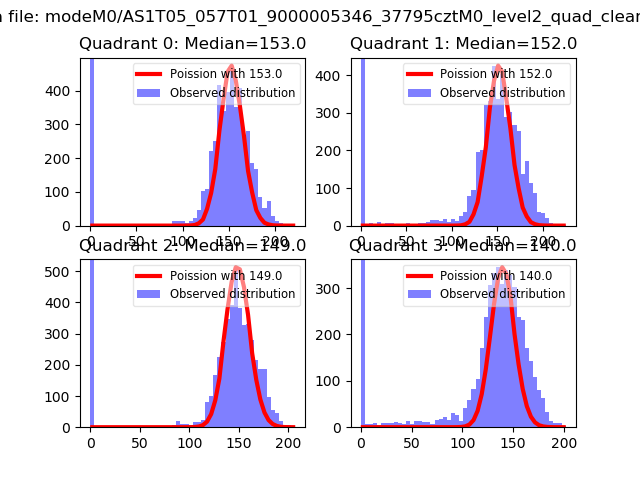 |
 |
| Quadrant-wise count rates Data is divided into 100 sec bins |
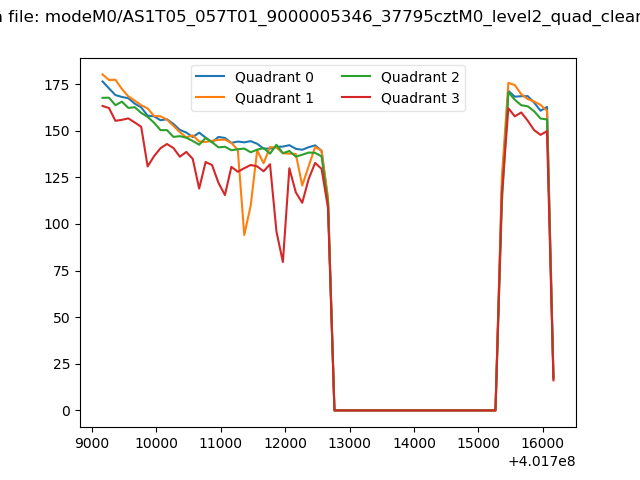 |
|
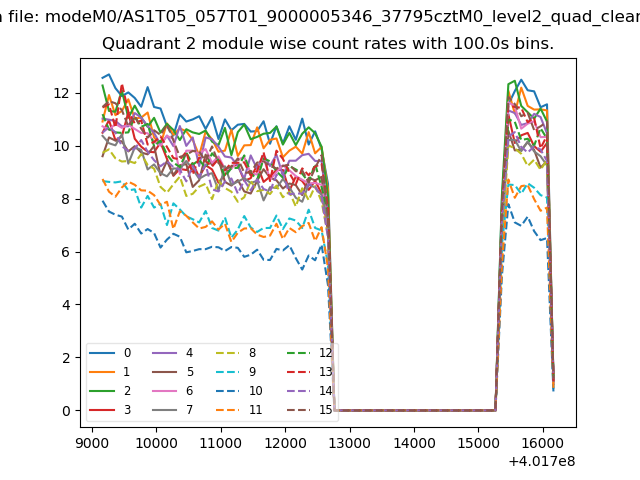
| Module-wise count rates for Quadrant A Data is divided into 100 sec bins |
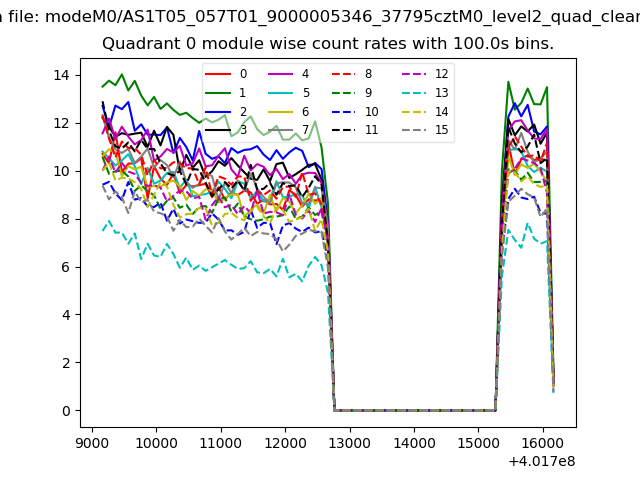 |
 |
| Module-wise count rates for Quadrant B Data is divided into 100 sec bins |
 |
 |
| Module-wise count rates for Quadrant C Data is divided into 100 sec bins |
 |
 |
| Module-wise count rates for Quadrant D Data is divided into 100 sec bins |
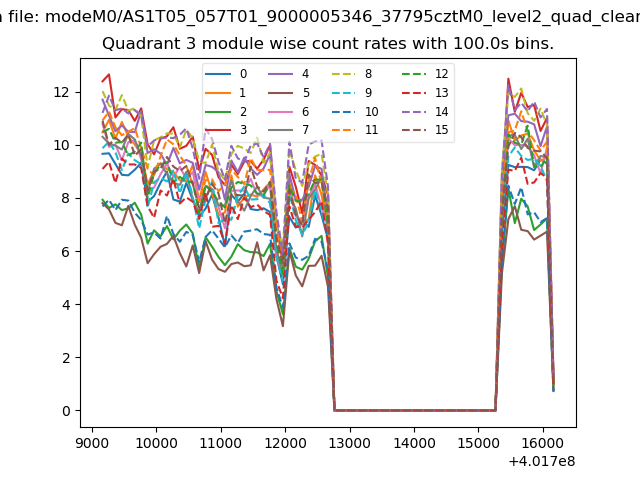 |
 |
| Parameter | Plot |
|---|---|
| CZT HV Monitor | 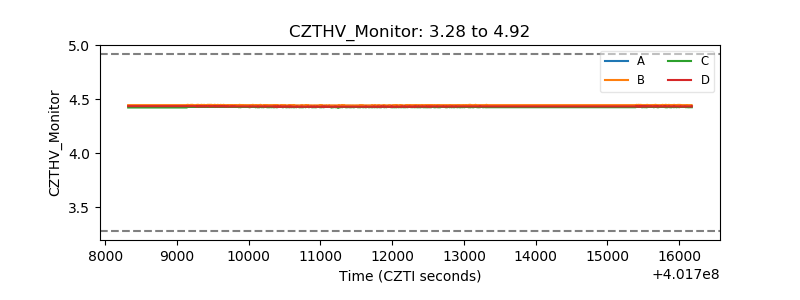 |
| D_VDD | 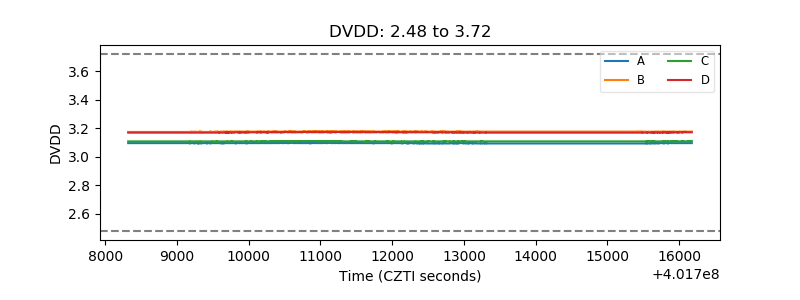 |
| Temperature 1 | 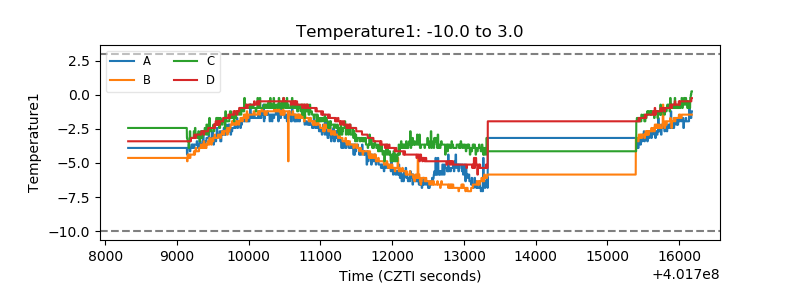 |
| Veto HV Monitor | 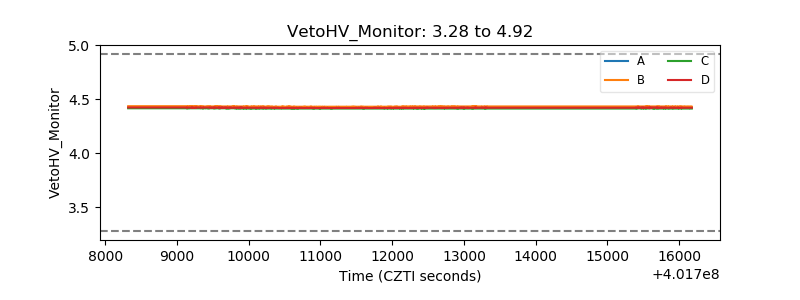 |
| Veto LLD | 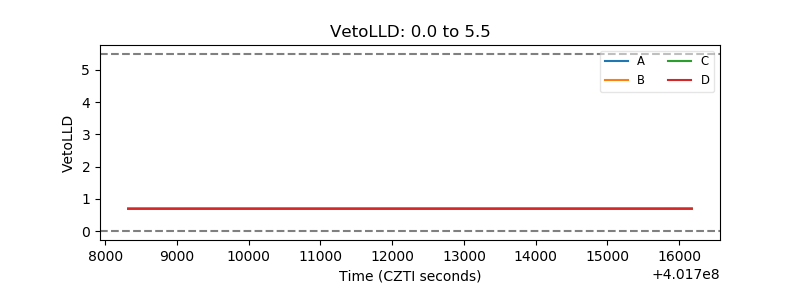 |
| Alpha Counter | 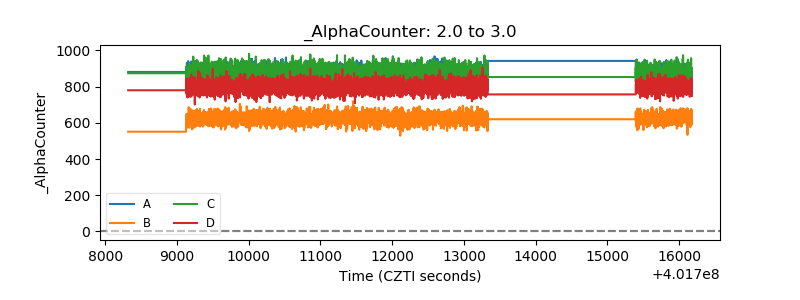 |
| _CPM_Rate | 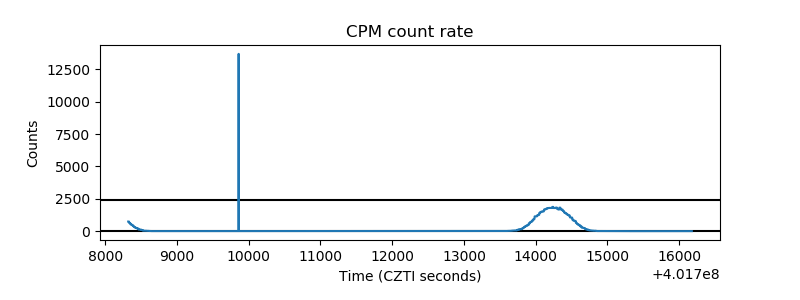 |
| CZT Counter | 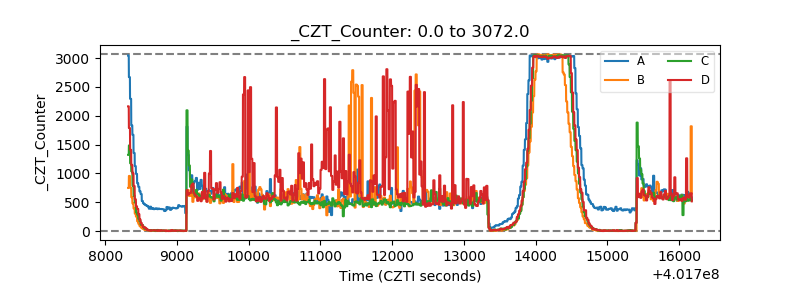 |
| +2.5 Volts monitor | 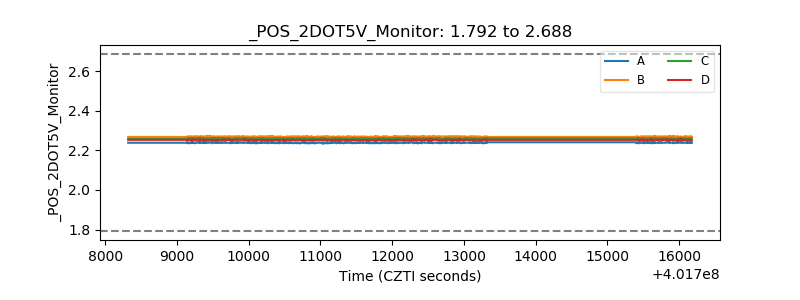 |
| +5 Volts monitor | 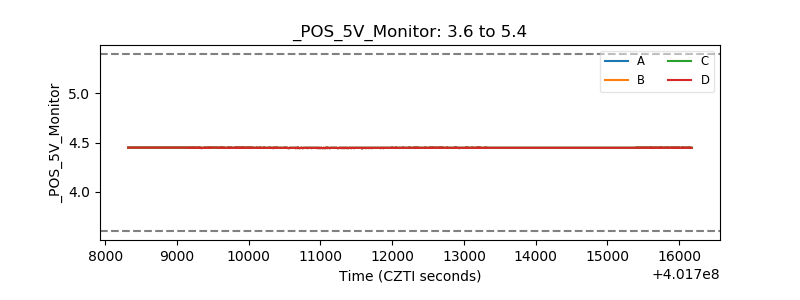 |
| _ROLL_ROT | 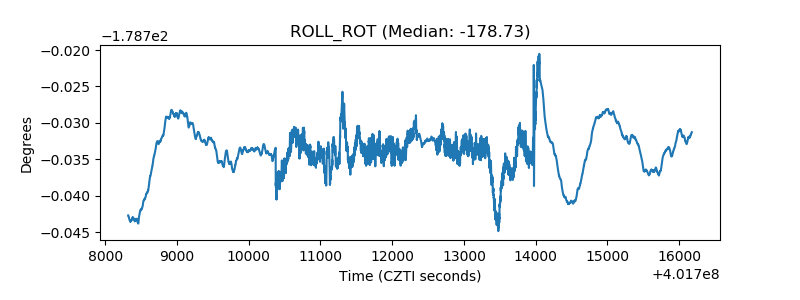 |
| _Roll_DEC | 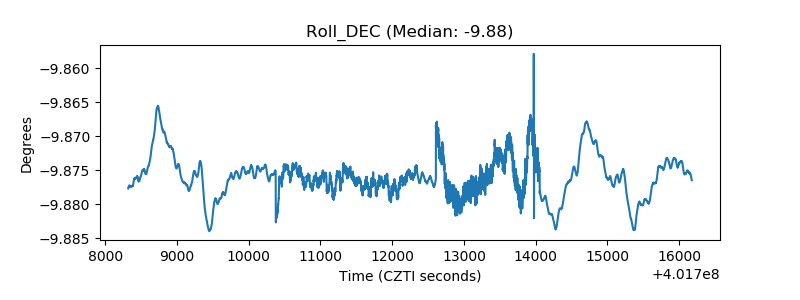 |
| _Roll_RA | 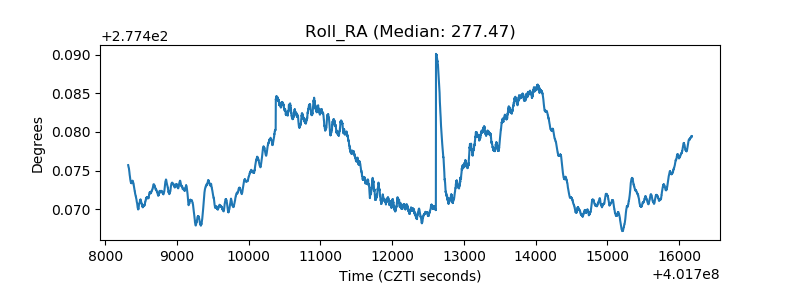 |
| Veto Counter | 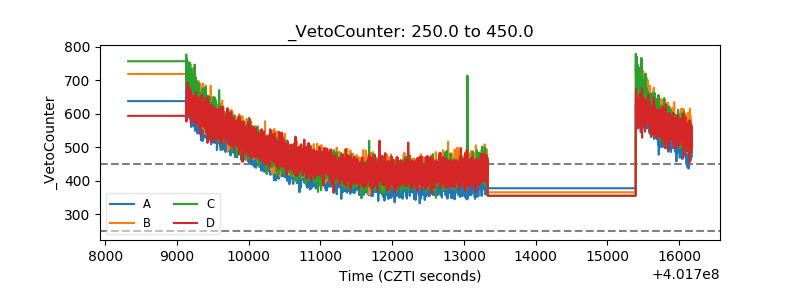 |