| Param | Original file | Final file |
|---|---|---|
| Filename | modeM0/AS1T05_057T01_9000005346_37796cztM0_level2.evt | modeM0/AS1T05_057T01_9000005346_37796cztM0_level2_quad_clean.evt |
| Size (bytes) | 346,726,080 | 71,671,680 |
| Size | 330.7 MB | 68.4 MB |
| Events in quadrant A | 2,427,641 | 483,523 |
| Events in quadrant B | 2,846,113 | 471,869 |
| Events in quadrant C | 2,301,539 | 469,403 |
| Events in quadrant D | 2,641,731 | 451,935 |
| Mode M0 | |||
|---|---|---|---|
| Quadrant | BADHDUFLAG | Total packets | Discarded packets |
| A | 0 | 9733 | 1 |
| B | 0 | 11135 | 1 |
| C | 0 | 9245 | 1 |
| D | 0 | 10445 | 1 |
| Mode SS | |||
|---|---|---|---|
| Quadrant | BADHDUFLAG | Total packets | Discarded packets |
| A | 0 | 86 | 0 |
| B | 0 | 86 | 0 |
| C | 0 | 86 | 0 |
| D | 0 | 86 | 0 |
| Mode M9 | |||
|---|---|---|---|
| Quadrant | BADHDUFLAG | Total packets | Discarded packets |
| A | 0 | 23 | 0 |
| B | 0 | 23 | 0 |
| C | 0 | 23 | 0 |
| D | 0 | 24 | 0 |
| Quadrant | Total seconds | Saturated seconds | Saturation percentage |
|---|---|---|---|
| A | 4165 | 25 | 0.600240% |
| B | 4165 | 149 | 3.577431% |
| C | 4165 | 31 | 0.744298% |
| D | 4165 | 46 | 1.104442% |
Noise dominated data is calculated using 1-second bins in cleaned event files. If a bin has >2000 counts, and if more than 50% of those come from <1% of pixels, then it is considered to be noise-dominated and hence unusable.
| Quadrant | # 1 sec bins | Bins with >0 counts | Bins with >2000 counts | High rate bins dominated by noise | Noise dominated (total time) | Noise dominated (detector-on time) | Marked lightcurve |
|---|---|---|---|---|---|---|---|
| A | 6289 | 4166 | 10 | 10 | 0.16% | 0.24% | 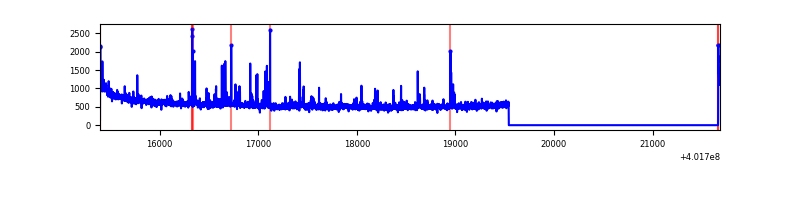 |
| B | 6289 | 4166 | 118 | 118 | 1.88% | 2.83% | 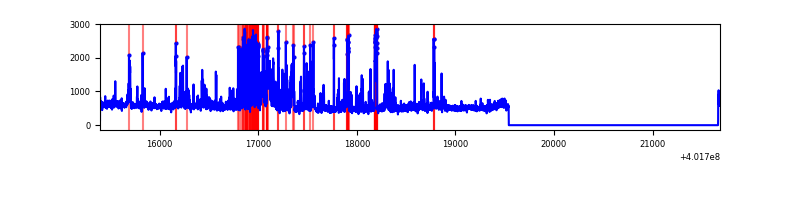 |
| C | 6289 | 4165 | 24 | 24 | 0.38% | 0.58% | 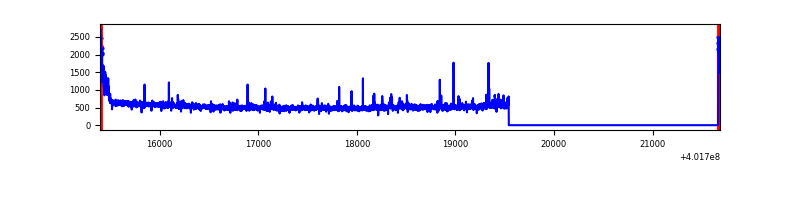 |
| D | 6289 | 4166 | 37 | 37 | 0.59% | 0.89% | 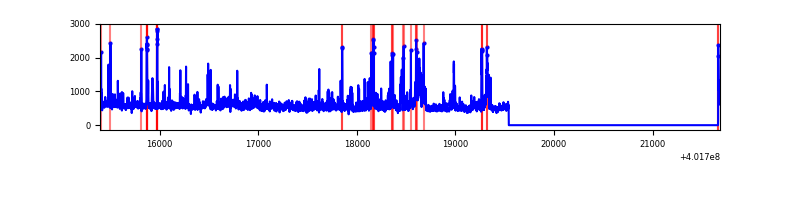 |
Top three noisy pixels from each quadrant. If the there are fewer than three noisy pixels in the level2.evt file, extra rows are filled as -1
| Pixel properties | Quadrant properties | ||||||
|---|---|---|---|---|---|---|---|
| Quadrant | DetID | PixID | Counts | Sigma | Mean | Median | Sigma |
| A | 10 | 83 | 238094 | 2245.64 | 524 | 516 | 105.8 |
| A | 9 | 143 | 77726 | 729.81 | 524 | 516 | 105.8 |
| A | 15 | 222 | 38378 | 357.88 | 524 | 516 | 105.8 |
| B | 4 | 232 | 296166 | 3066.97 | 506 | 494 | 96.4 |
| B | 0 | 229 | 196912 | 2037.42 | 506 | 494 | 96.4 |
| B | 5 | 172 | 161541 | 1670.52 | 506 | 494 | 96.4 |
| C | 15 | 214 | 190214 | 1632.11 | 497 | 502 | 116.2 |
| C | 0 | 10 | 105591 | 904.09 | 497 | 502 | 116.2 |
| C | 14 | 254 | 33865 | 287.03 | 497 | 502 | 116.2 |
| D | 2 | 249 | 173082 | 1398.77 | 504 | 493 | 123.4 |
| D | 12 | 235 | 120462 | 972.3 | 504 | 493 | 123.4 |
| D | 13 | 249 | 111033 | 895.89 | 504 | 493 | 123.4 |
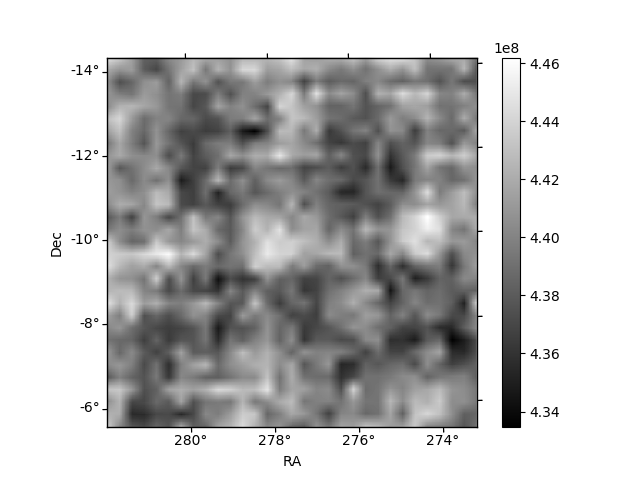
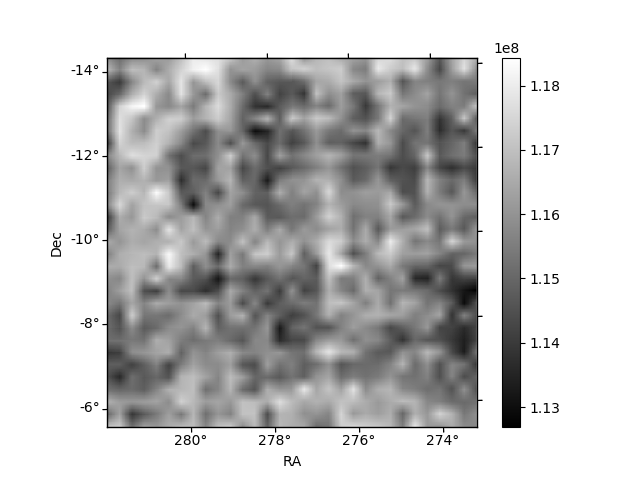
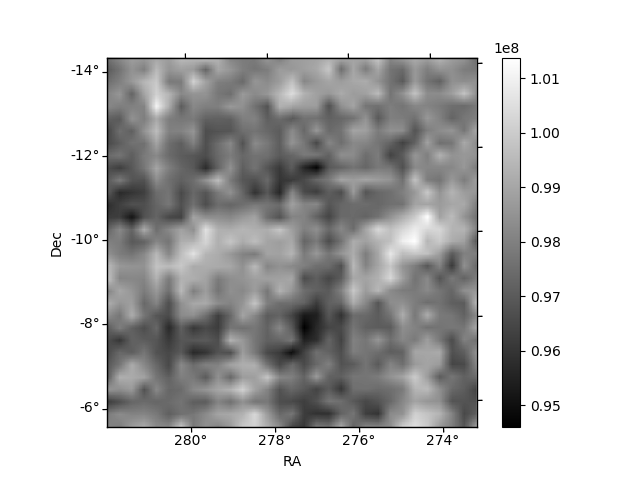
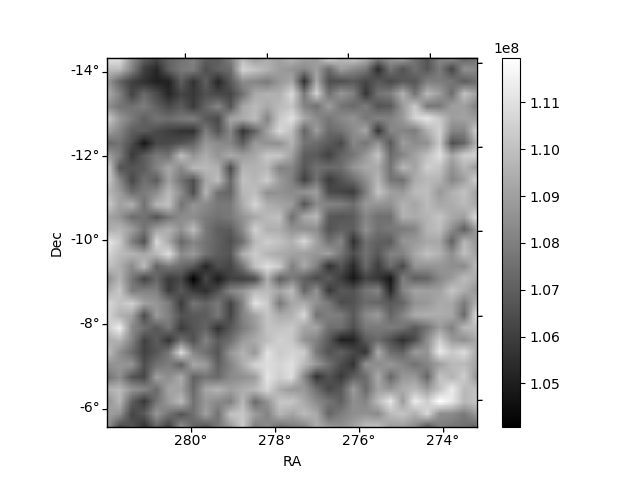
Histogram calculated using DETX and DETY for each event in the final _common_clean file
| Quadrant A | 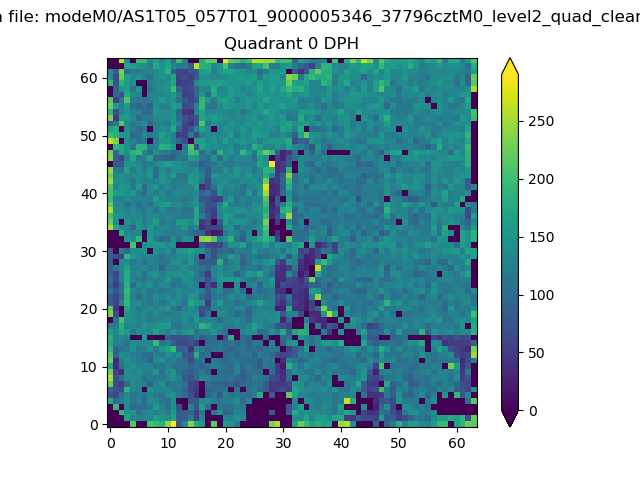 |
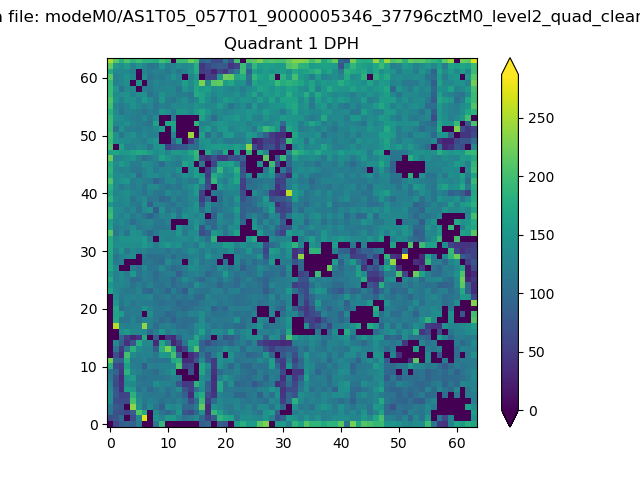 |
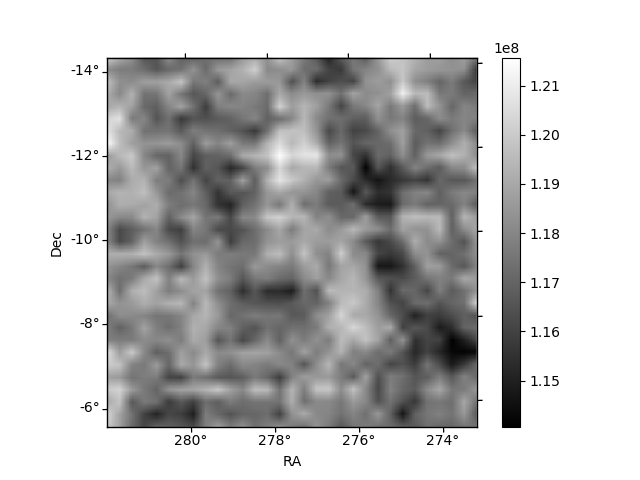
Quadrant B |
|---|---|---|---|
| Quadrant D | 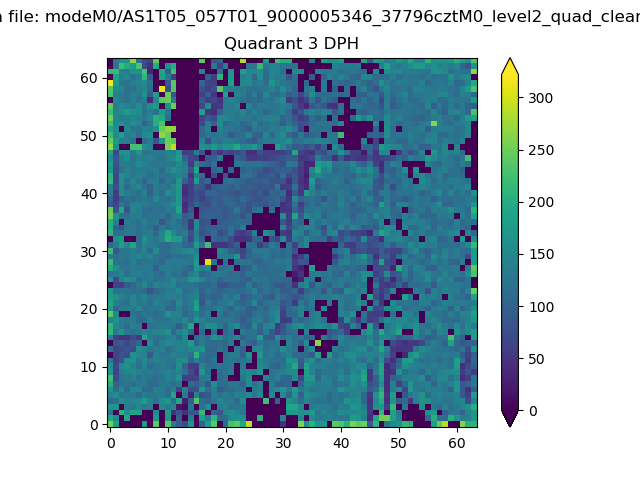 |
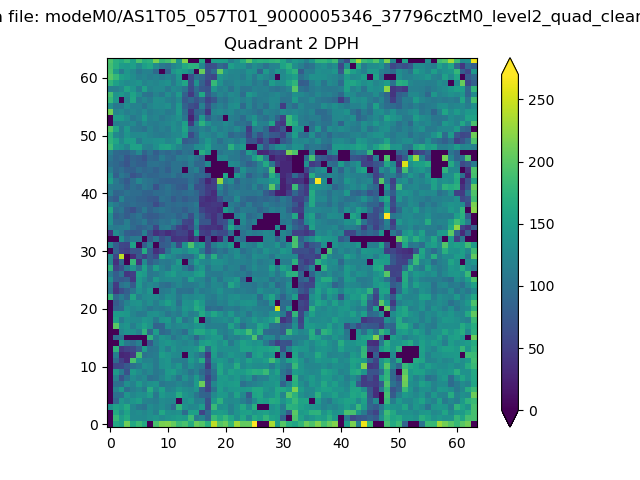 |
Quadrant C |
| Plot type | Count rate plots | Images |
|---|---|---|
| Comparison with Poisson distribution Blue bars denote a histogram of data divided into 1 sec bins. Red curve is a Poisson curve with rate = median count rate of data. |
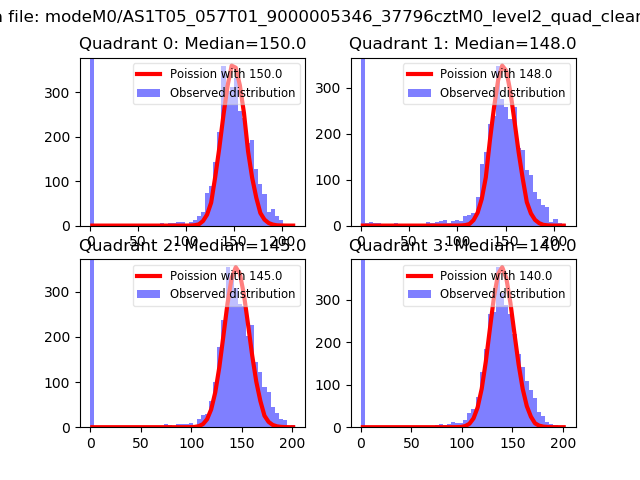 |
 |
| Quadrant-wise count rates Data is divided into 100 sec bins |
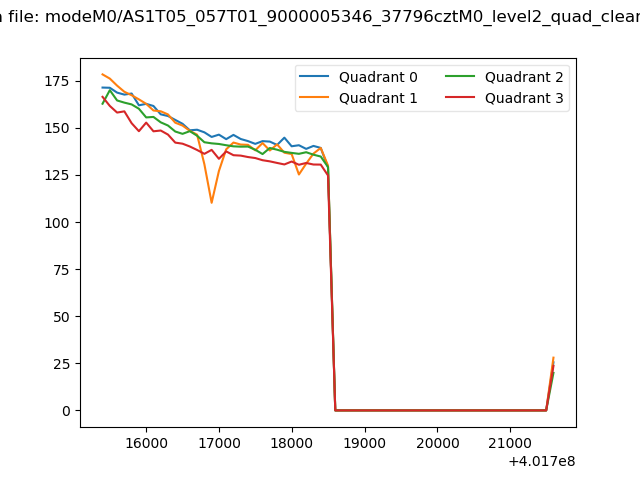 |
|
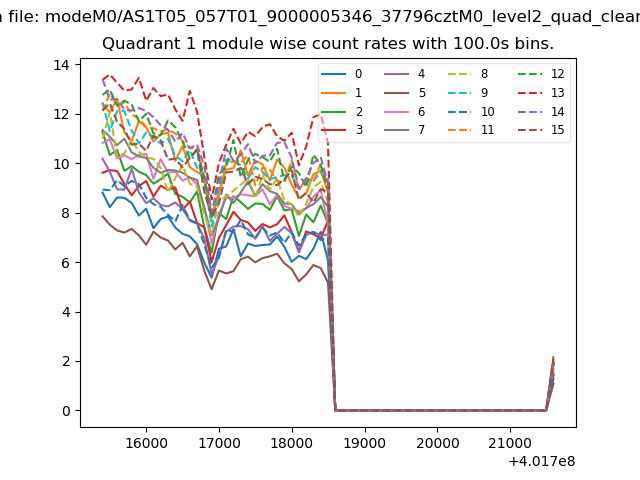
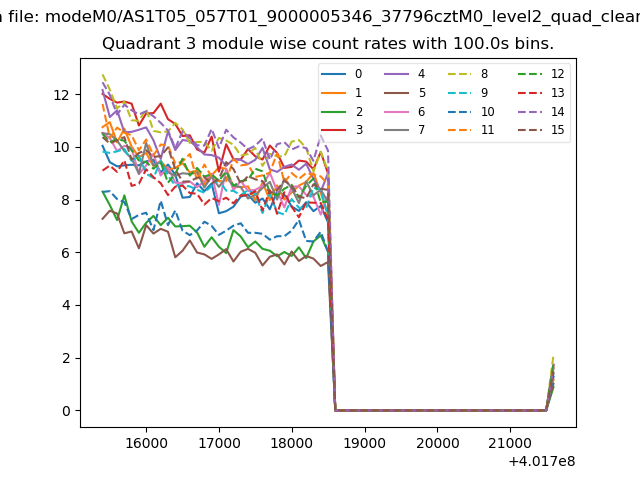
| Module-wise count rates for Quadrant A Data is divided into 100 sec bins |
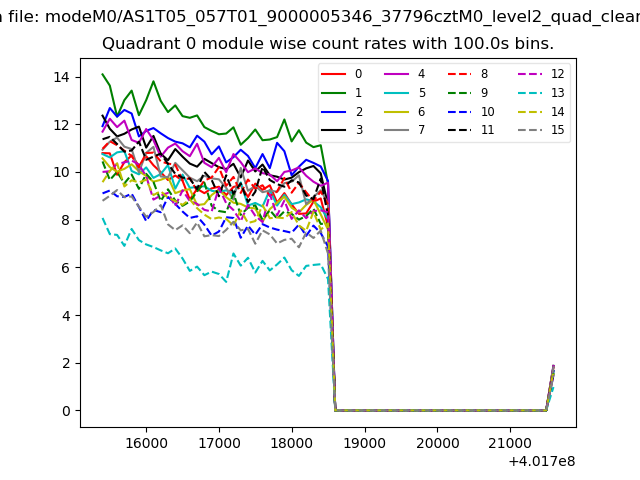 |
 |
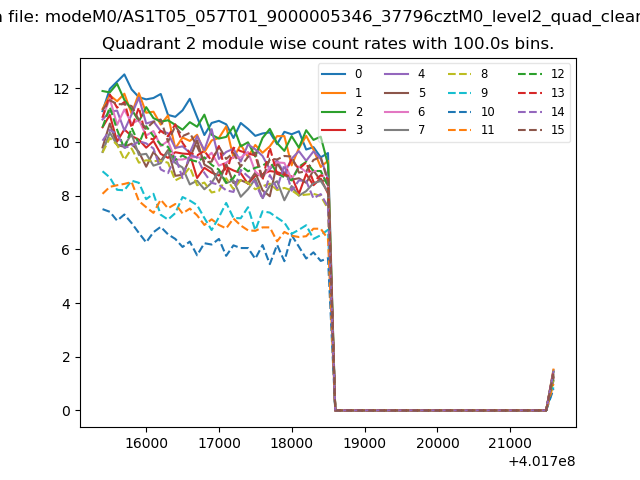
| Module-wise count rates for Quadrant B Data is divided into 100 sec bins |
 |
 |
| Module-wise count rates for Quadrant C Data is divided into 100 sec bins |
 |
 |
| Module-wise count rates for Quadrant D Data is divided into 100 sec bins |
 |
 |
| Parameter | Plot |
|---|---|
| CZT HV Monitor | 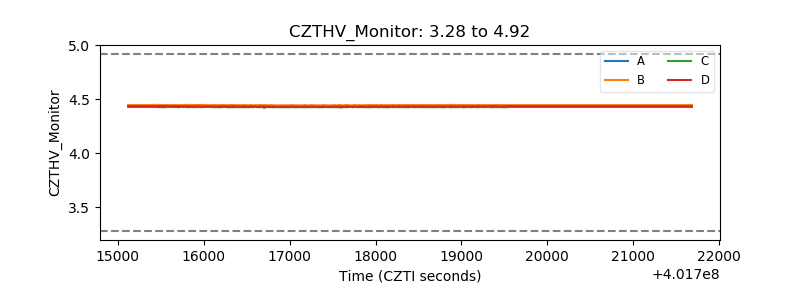 |
| D_VDD | 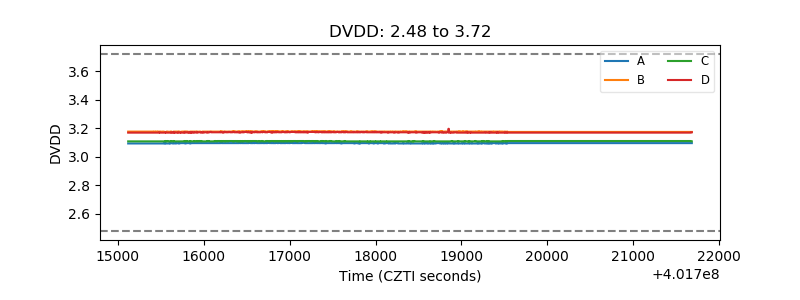 |
| Temperature 1 | 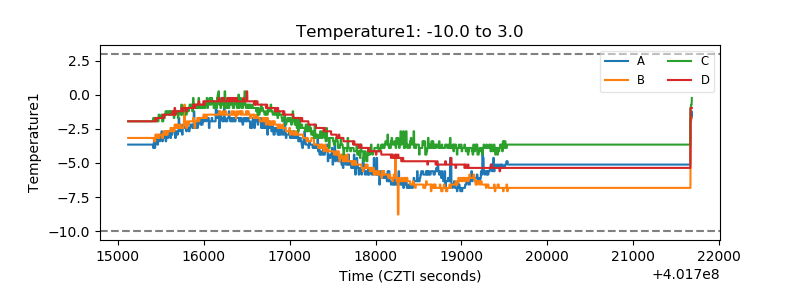 |
| Veto HV Monitor | 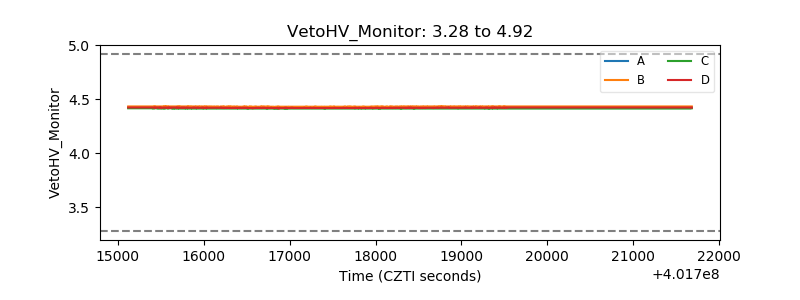 |
| Veto LLD | 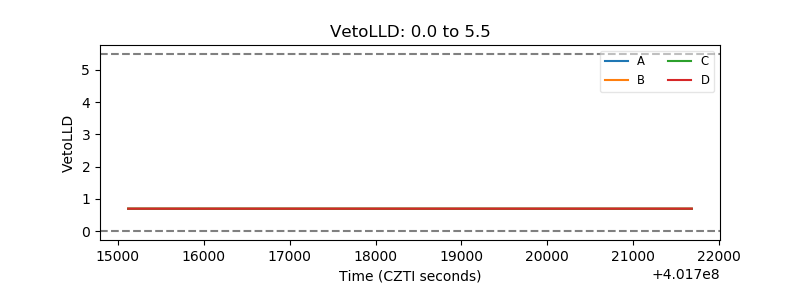 |
| Alpha Counter | 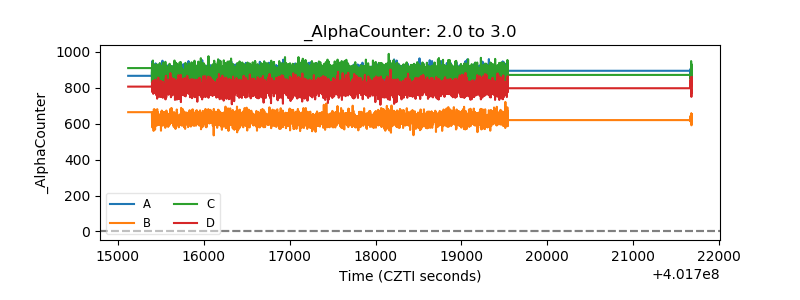 |
| _CPM_Rate | 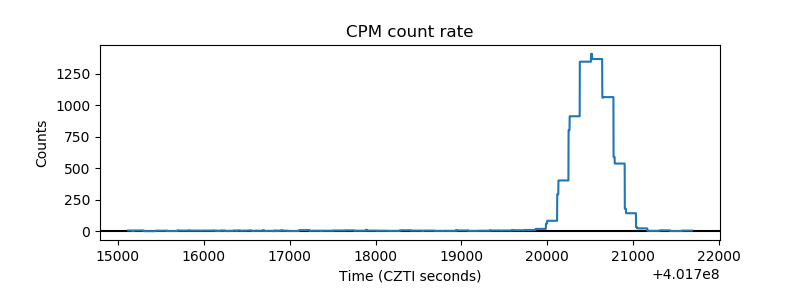 |
| CZT Counter | 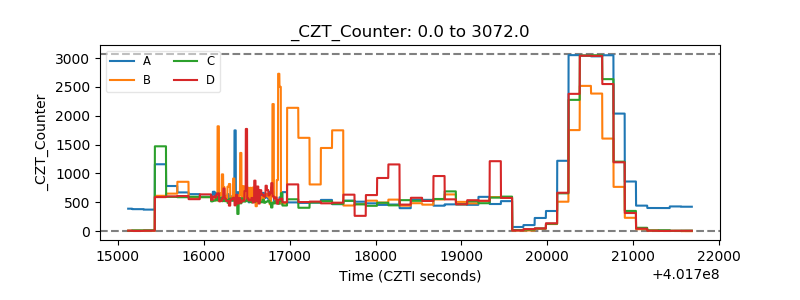 |
| +2.5 Volts monitor | 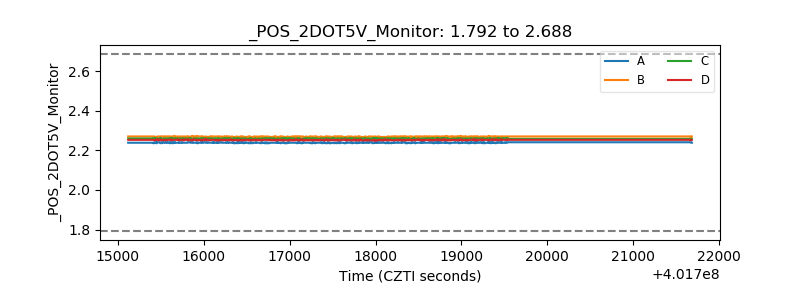 |
| +5 Volts monitor | 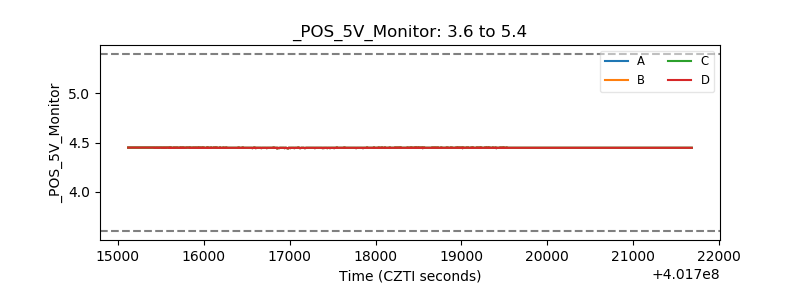 |
| _ROLL_ROT | 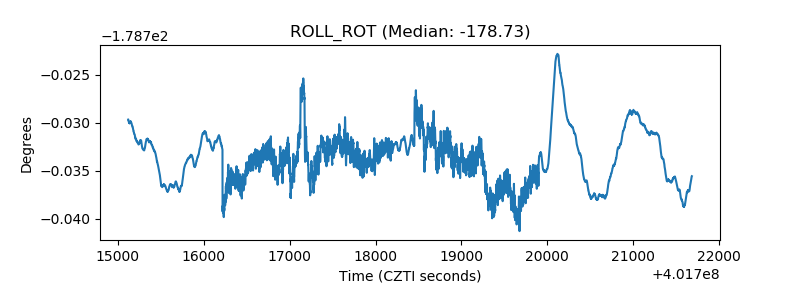 |
| _Roll_DEC | 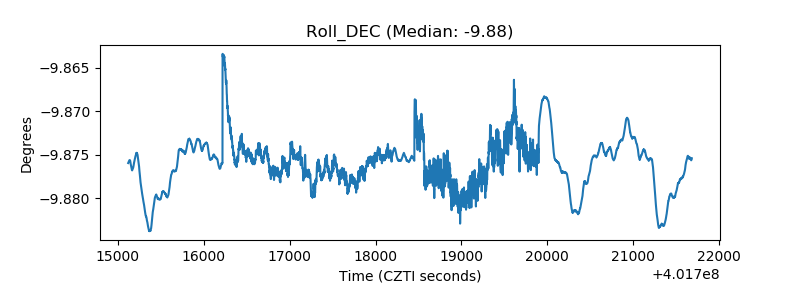 |
| _Roll_RA | 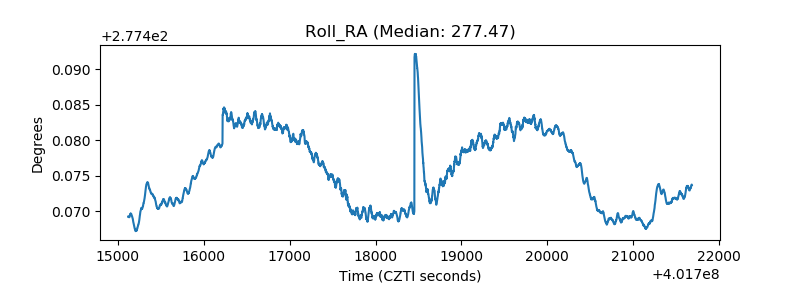 |
| Veto Counter | 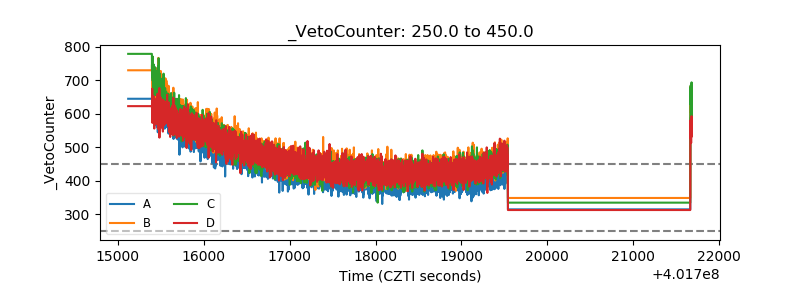 |