| Param | Original file | Final file |
|---|---|---|
| Filename | modeM0/AS1A10_103T06_9000005348_37796cztM0_level2.evt | modeM0/AS1A10_103T06_9000005348_37796cztM0_level2_quad_clean.evt |
| Size (bytes) | 22,812,480 | 4,740,480 |
| Size | 21.8 MB | 4.5 MB |
| Events in quadrant A | 126,035 | 30,960 |
| Events in quadrant B | 193,351 | 30,394 |
| Events in quadrant C | 116,117 | 31,189 |
| Events in quadrant D | 237,307 | 27,305 |
| Mode M0 | |||
|---|---|---|---|
| Quadrant | BADHDUFLAG | Total packets | Discarded packets |
| A | 0 | 524 | 1 |
| B | 0 | 732 | 0 |
| C | 0 | 449 | 0 |
| D | 0 | 851 | 0 |
| Mode SS | |||
|---|---|---|---|
| Quadrant | BADHDUFLAG | Total packets | Discarded packets |
| A | 0 | 4 | 0 |
| B | 0 | 4 | 0 |
| C | 0 | 4 | 0 |
| D | 0 | 4 | 0 |
| Quadrant | Total seconds | Saturated seconds | Saturation percentage |
|---|---|---|---|
| A | 212 | 1 | 0.471698% |
| B | 212 | 19 | 8.962264% |
| C | 212 | 0 | 0.000000% |
| D | 212 | 30 | 14.150943% |
Noise dominated data is calculated using 1-second bins in cleaned event files. If a bin has >2000 counts, and if more than 50% of those come from <1% of pixels, then it is considered to be noise-dominated and hence unusable.
| Quadrant | # 1 sec bins | Bins with >0 counts | Bins with >2000 counts | High rate bins dominated by noise | Noise dominated (total time) | Noise dominated (detector-on time) | Marked lightcurve |
|---|---|---|---|---|---|---|---|
| A | 212 | 212 | 0 | 0 | 0.00% | 0.00% | 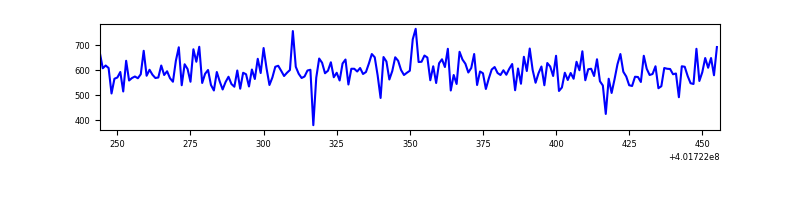 |
| B | 212 | 212 | 7 | 7 | 3.30% | 3.30% | 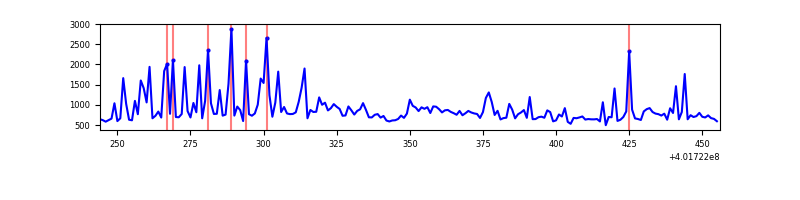 |
| C | 212 | 212 | 0 | 0 | 0.00% | 0.00% | 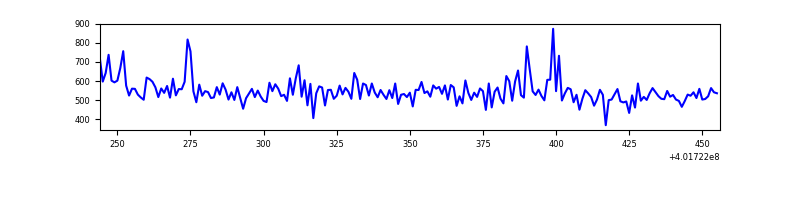 |
| D | 212 | 212 | 13 | 13 | 6.13% | 6.13% | 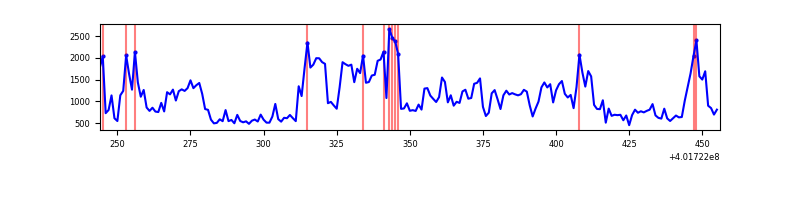 |
Top three noisy pixels from each quadrant. If the there are fewer than three noisy pixels in the level2.evt file, extra rows are filled as -1
| Pixel properties | Quadrant properties | ||||||
|---|---|---|---|---|---|---|---|
| Quadrant | DetID | PixID | Counts | Sigma | Mean | Median | Sigma |
| A | 10 | 83 | 11576 | 1458.41 | 28 | 27 | 7.9 |
| A | 15 | 222 | 1588 | 197.12 | 28 | 27 | 7.9 |
| A | 12 | 189 | 1579 | 195.99 | 28 | 27 | 7.9 |
| B | 4 | 232 | 34561 | 4777.24 | 26 | 26 | 7.2 |
| B | 0 | 189 | 22538 | 3114.09 | 26 | 26 | 7.2 |
| B | 0 | 229 | 12170 | 1679.88 | 26 | 26 | 7.2 |
| C | 15 | 214 | 9221 | 1156.85 | 26 | 26 | 7.9 |
| C | 12 | 250 | 1555 | 192.37 | 26 | 26 | 7.9 |
| C | 0 | 207 | 789 | 96.0 | 26 | 26 | 7.9 |
| D | 13 | 249 | 119450 | 14636.85 | 25 | 24 | 8.2 |
| D | 12 | 235 | 5576 | 680.45 | 25 | 24 | 8.2 |
| D | 10 | 199 | 5305 | 647.24 | 25 | 24 | 8.2 |
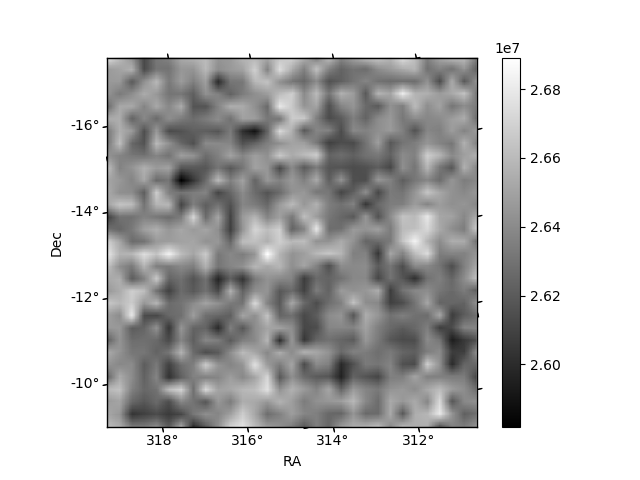
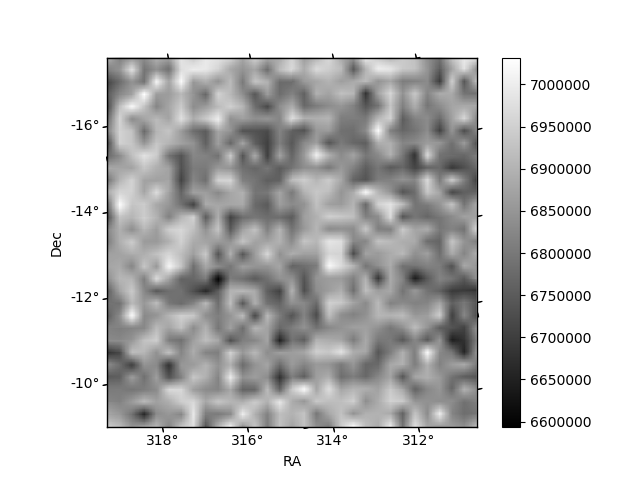
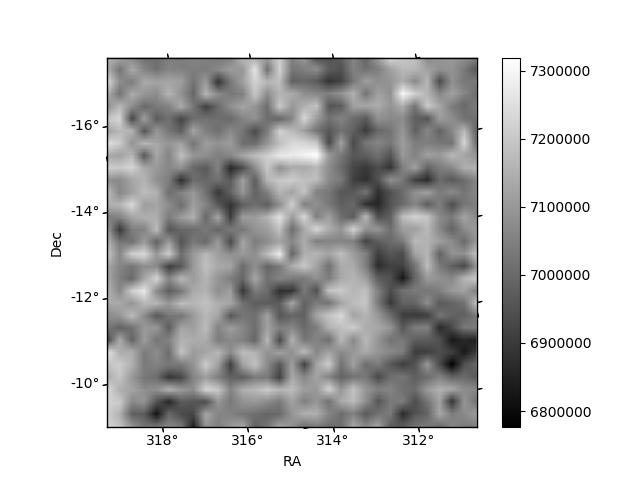
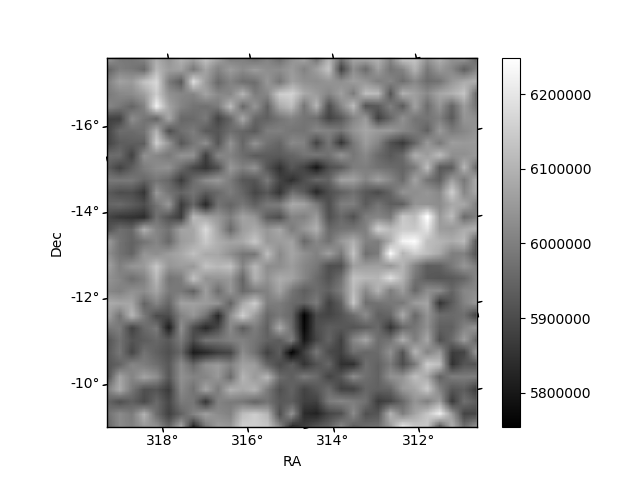
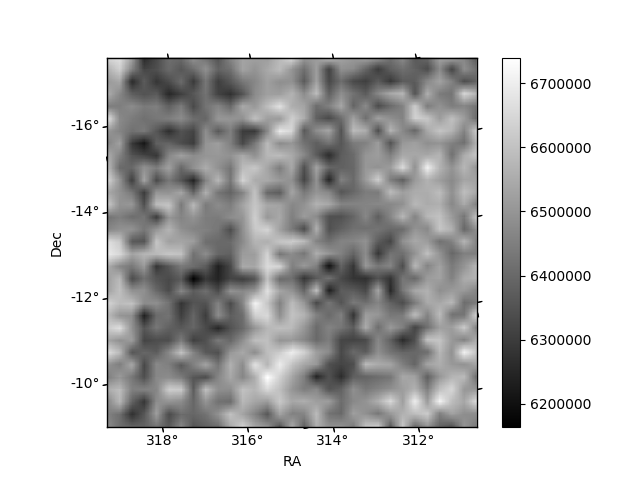
Histogram calculated using DETX and DETY for each event in the final _common_clean file
| Quadrant A | 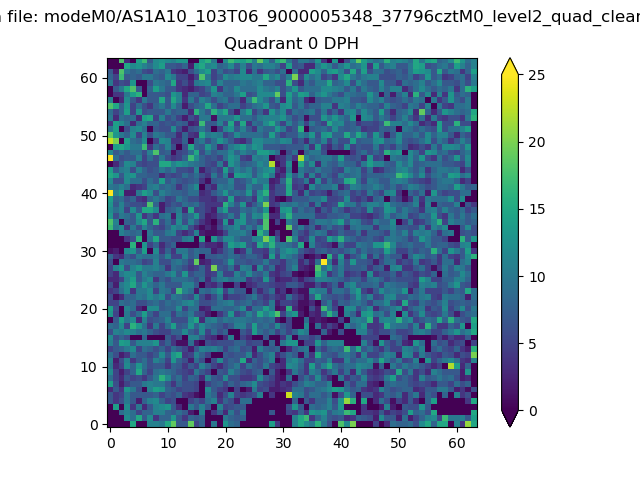 |
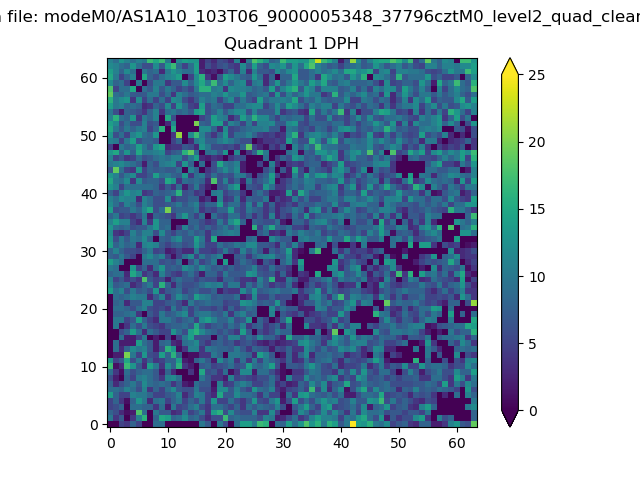 |
Quadrant B |
|---|---|---|---|
| Quadrant D | 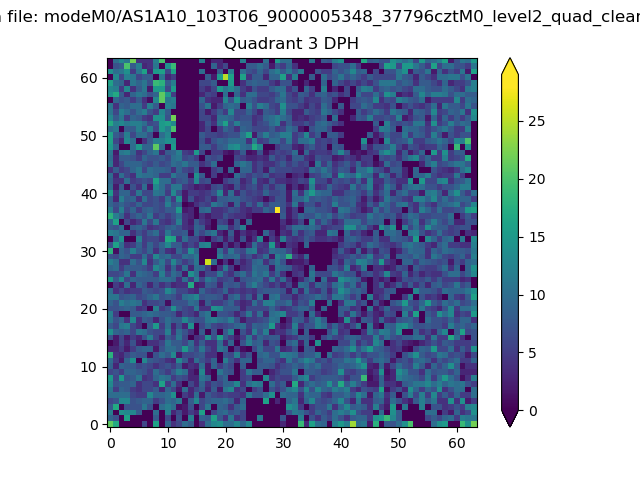 |
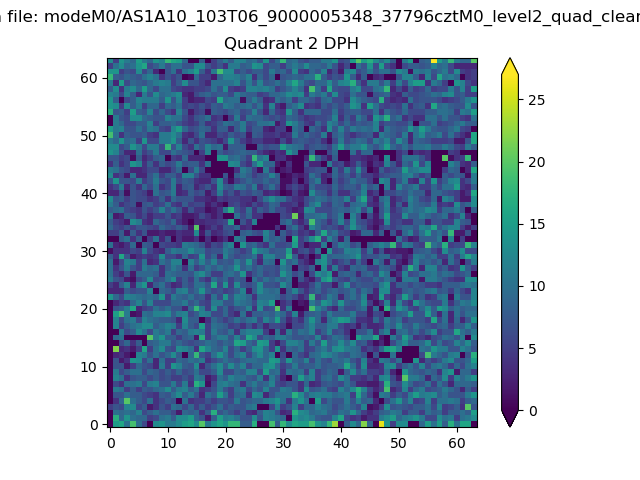 |
Quadrant C |
| Plot type | Count rate plots | Images |
|---|---|---|
| Comparison with Poisson distribution Blue bars denote a histogram of data divided into 1 sec bins. Red curve is a Poisson curve with rate = median count rate of data. |
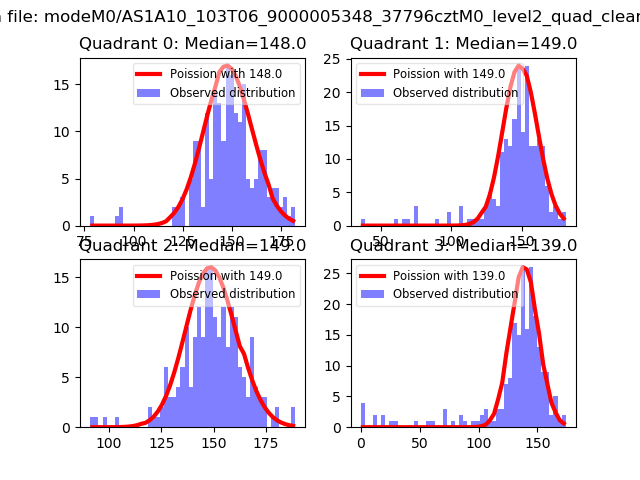 |
 |
| Quadrant-wise count rates Data is divided into 100 sec bins |
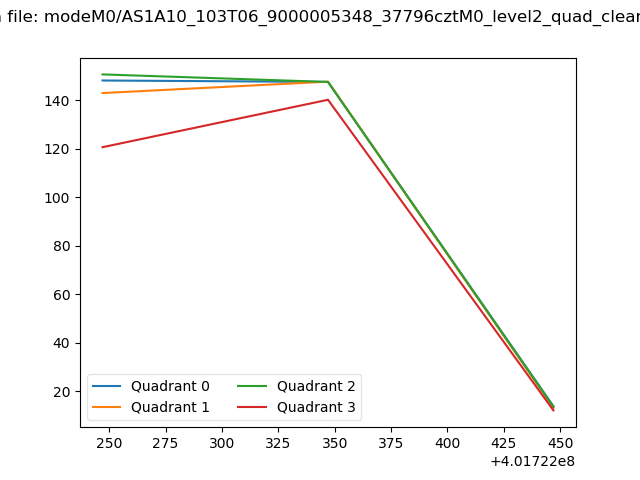 |
|
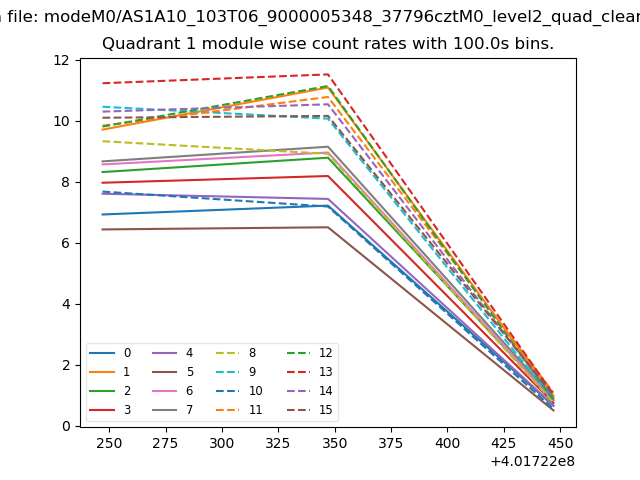
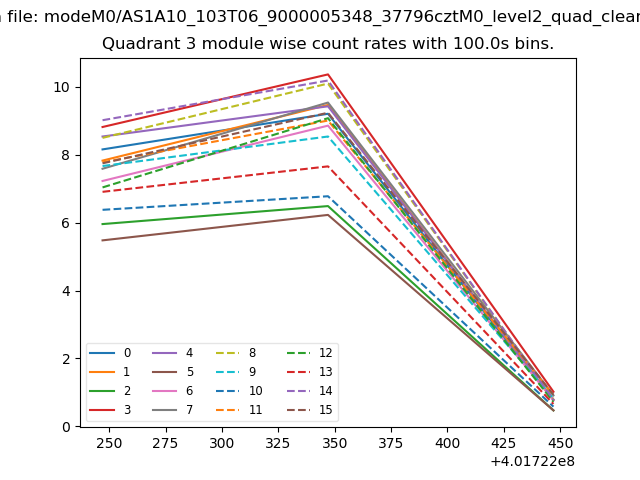
| Module-wise count rates for Quadrant A Data is divided into 100 sec bins |
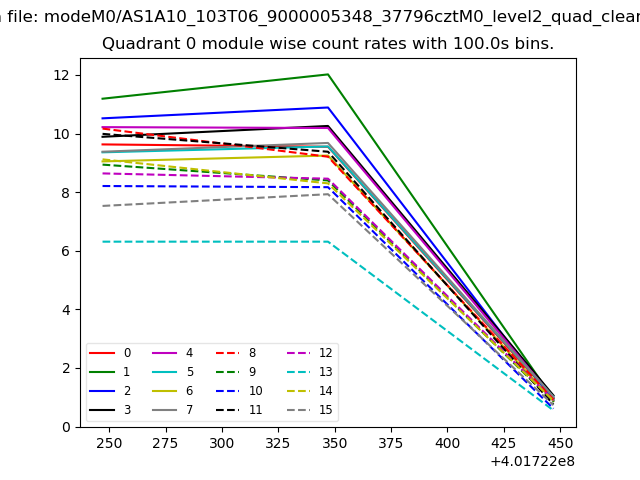 |
 |
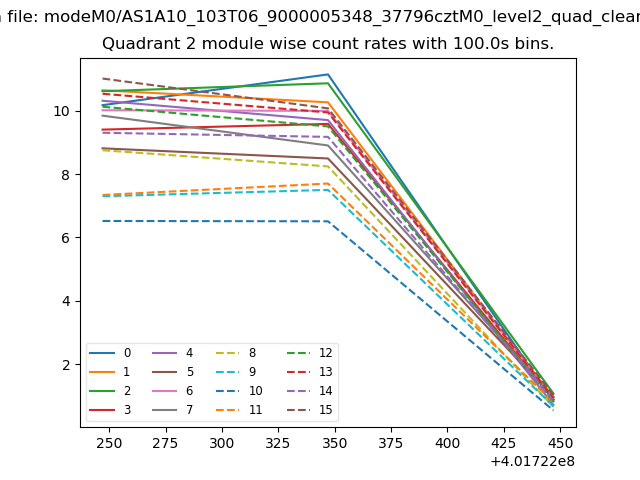
| Module-wise count rates for Quadrant B Data is divided into 100 sec bins |
 |
 |
| Module-wise count rates for Quadrant C Data is divided into 100 sec bins |
 |
 |
| Module-wise count rates for Quadrant D Data is divided into 100 sec bins |
 |
 |
| Parameter | Plot |
|---|---|
| CZT HV Monitor | 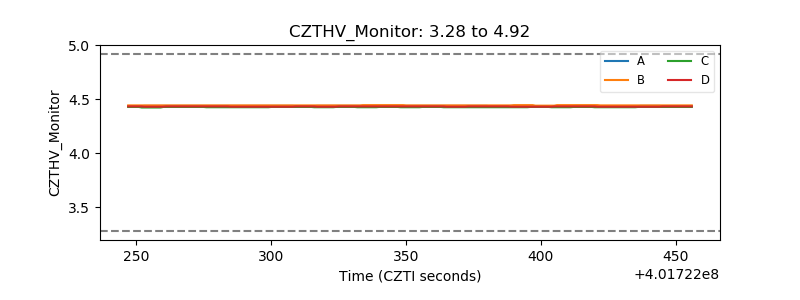 |
| D_VDD | 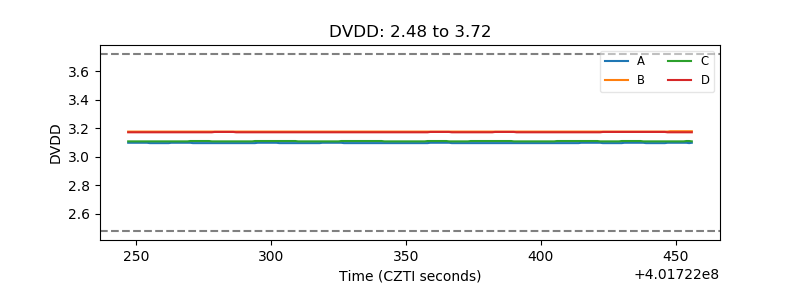 |
| Temperature 1 | 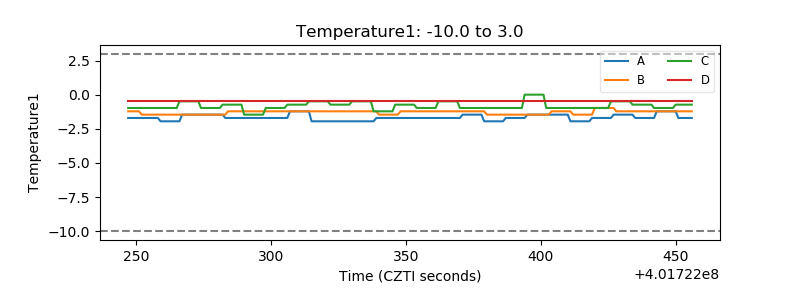 |
| Veto HV Monitor | 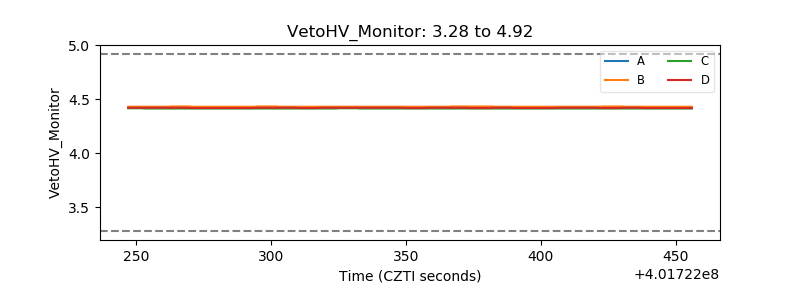 |
| Veto LLD | 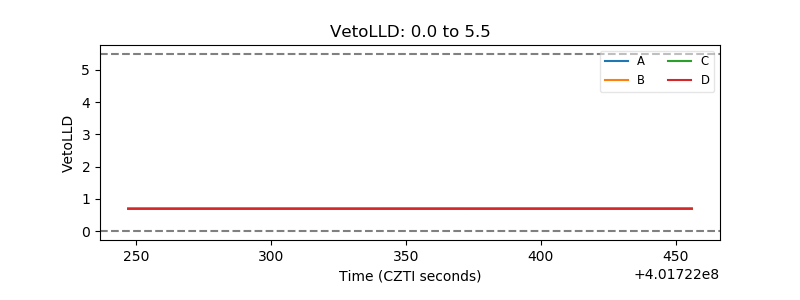 |
| Alpha Counter | 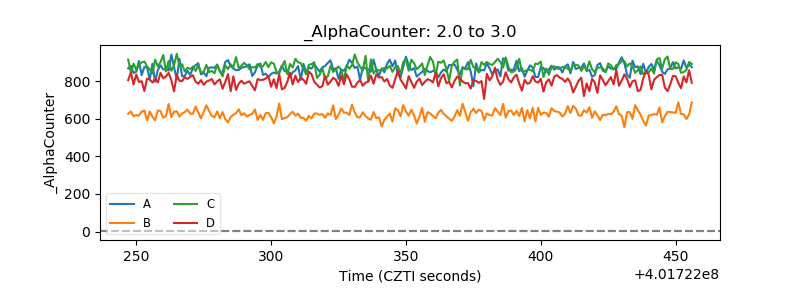 |
| _CPM_Rate | 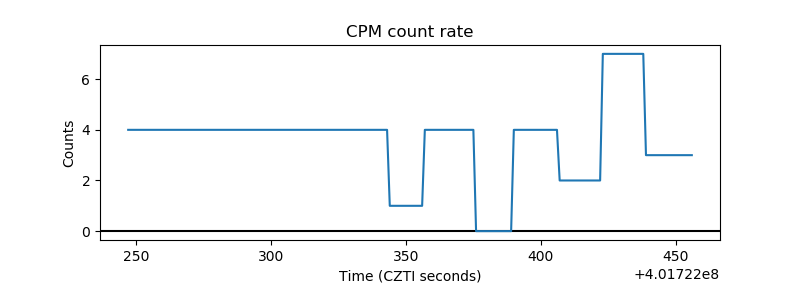 |
| CZT Counter | 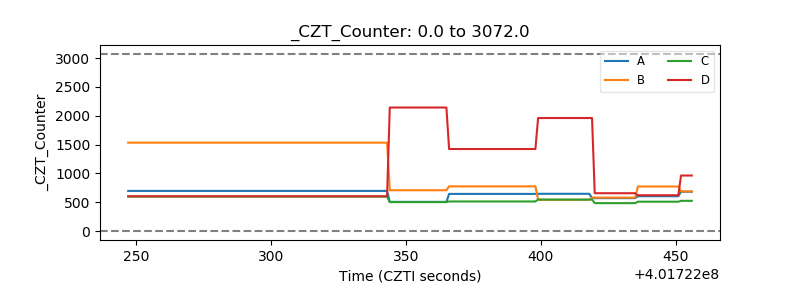 |
| +2.5 Volts monitor | 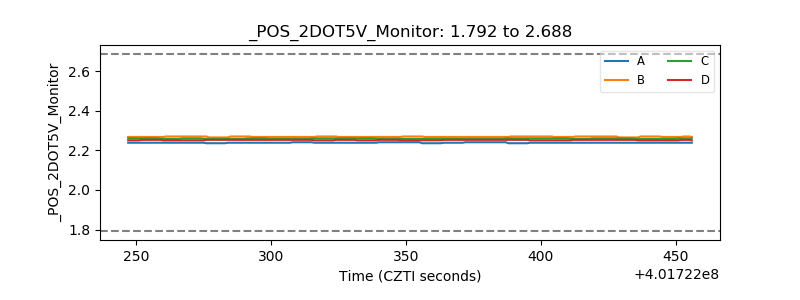 |
| +5 Volts monitor | 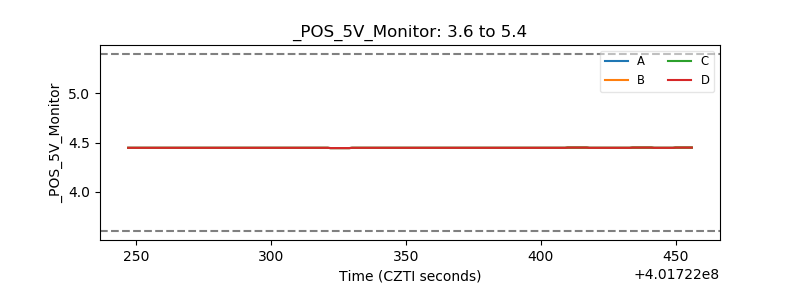 |
| _ROLL_ROT | 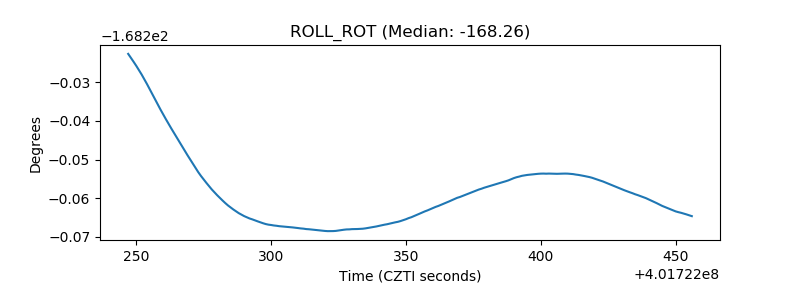 |
| _Roll_DEC | 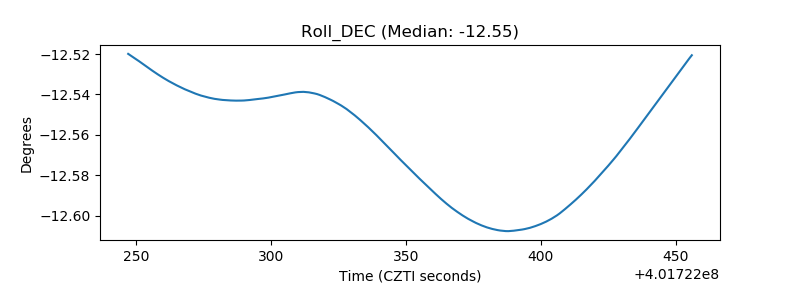 |
| _Roll_RA | 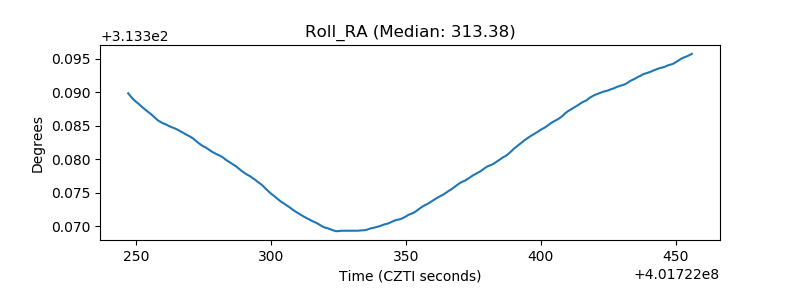 |
| Veto Counter | 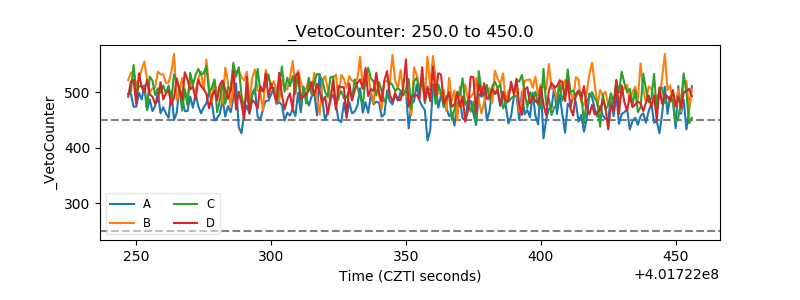 |