| Param | Original file | Final file |
|---|---|---|
| Filename | modeM0/AS1A10_103T06_9000005348_37797cztM0_level2.evt | modeM0/AS1A10_103T06_9000005348_37797cztM0_level2_quad_clean.evt |
| Size (bytes) | 428,532,480 | 72,172,800 |
| Size | 408.7 MB | 68.8 MB |
| Events in quadrant A | 2,618,427 | 494,921 |
| Events in quadrant B | 3,334,350 | 475,796 |
| Events in quadrant C | 2,234,172 | 490,959 |
| Events in quadrant D | 4,497,419 | 418,915 |
| Mode M9 | |||
|---|---|---|---|
| Quadrant | BADHDUFLAG | Total packets | Discarded packets |
| A | 0 | 22 | 0 |
| B | 0 | 22 | 0 |
| C | 0 | 22 | 0 |
| D | 0 | 22 | 0 |
| Mode M0 | |||
|---|---|---|---|
| Quadrant | BADHDUFLAG | Total packets | Discarded packets |
| A | 0 | 10452 | 2 |
| B | 0 | 12805 | 1 |
| C | 0 | 9120 | 1 |
| D | 0 | 16231 | 1 |
| Mode SS | |||
|---|---|---|---|
| Quadrant | BADHDUFLAG | Total packets | Discarded packets |
| A | 0 | 88 | 0 |
| B | 0 | 88 | 0 |
| C | 0 | 88 | 0 |
| D | 0 | 88 | 0 |
| Quadrant | Total seconds | Saturated seconds | Saturation percentage |
|---|---|---|---|
| A | 4329 | 23 | 0.531301% |
| B | 4329 | 293 | 6.768307% |
| C | 4329 | 10 | 0.231000% |
| D | 4329 | 734 | 16.955417% |
Noise dominated data is calculated using 1-second bins in cleaned event files. If a bin has >2000 counts, and if more than 50% of those come from <1% of pixels, then it is considered to be noise-dominated and hence unusable.
| Quadrant | # 1 sec bins | Bins with >0 counts | Bins with >2000 counts | High rate bins dominated by noise | Noise dominated (total time) | Noise dominated (detector-on time) | Marked lightcurve |
|---|---|---|---|---|---|---|---|
| A | 6481 | 4330 | 15 | 15 | 0.23% | 0.35% | 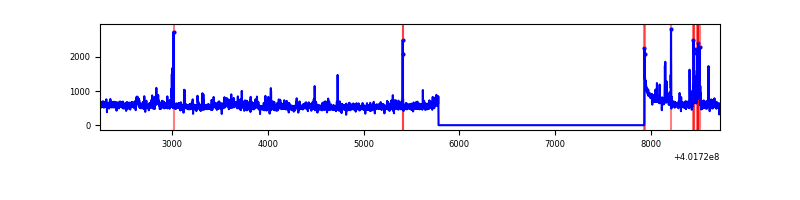 |
| B | 6480 | 4329 | 235 | 235 | 3.63% | 5.43% | 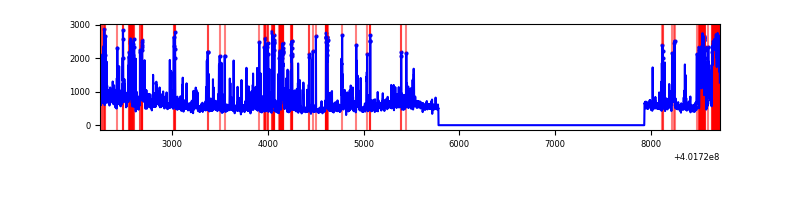 |
| C | 6481 | 4330 | 7 | 7 | 0.11% | 0.16% | 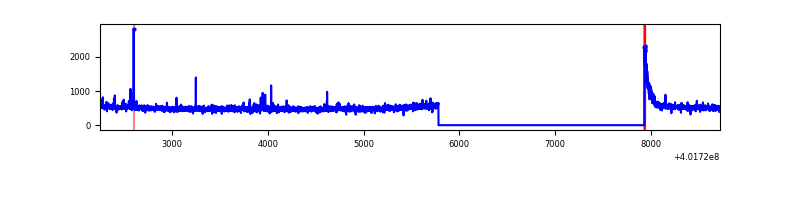 |
| D | 6481 | 4330 | 707 | 707 | 10.91% | 16.33% | 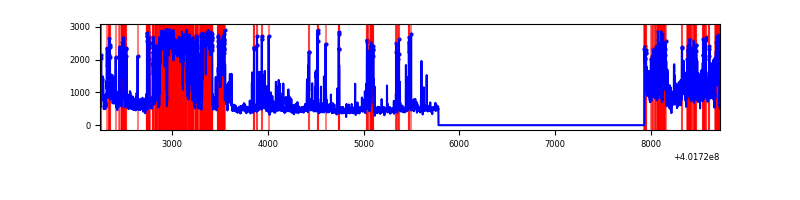 |
Top three noisy pixels from each quadrant. If the there are fewer than three noisy pixels in the level2.evt file, extra rows are filled as -1
| Pixel properties | Quadrant properties | ||||||
|---|---|---|---|---|---|---|---|
| Quadrant | DetID | PixID | Counts | Sigma | Mean | Median | Sigma |
| A | 15 | 222 | 252920 | 2388.74 | 521 | 513 | 105.7 |
| A | 10 | 83 | 252235 | 2382.26 | 521 | 513 | 105.7 |
| A | 9 | 143 | 27314 | 253.64 | 521 | 513 | 105.7 |
| B | 5 | 172 | 563630 | 5840.92 | 500 | 489 | 96.4 |
| B | 0 | 229 | 215761 | 2232.81 | 500 | 489 | 96.4 |
| B | 4 | 81 | 144608 | 1494.81 | 500 | 489 | 96.4 |
| C | 15 | 214 | 192763 | 1683.77 | 496 | 501 | 114.2 |
| C | 0 | 10 | 65857 | 572.37 | 496 | 501 | 114.2 |
| C | 0 | 207 | 13815 | 116.6 | 496 | 501 | 114.2 |
| D | 13 | 249 | 1920863 | 16729.22 | 464 | 452 | 114.8 |
| D | 7 | 223 | 371752 | 3234.5 | 464 | 452 | 114.8 |
| D | 10 | 199 | 85714 | 742.74 | 464 | 452 | 114.8 |
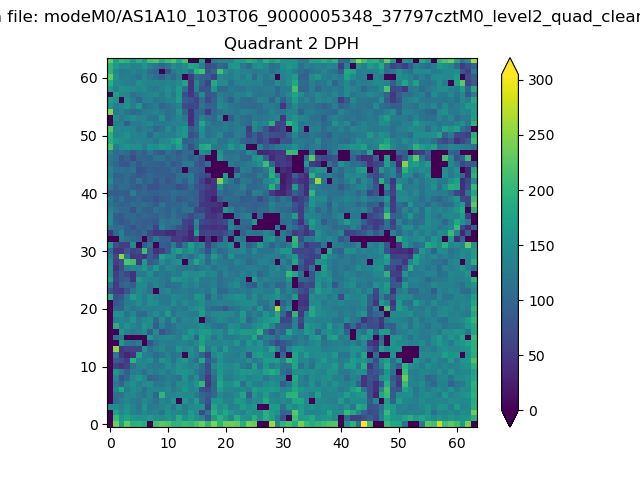
Histogram calculated using DETX and DETY for each event in the final _common_clean file
| Quadrant A | 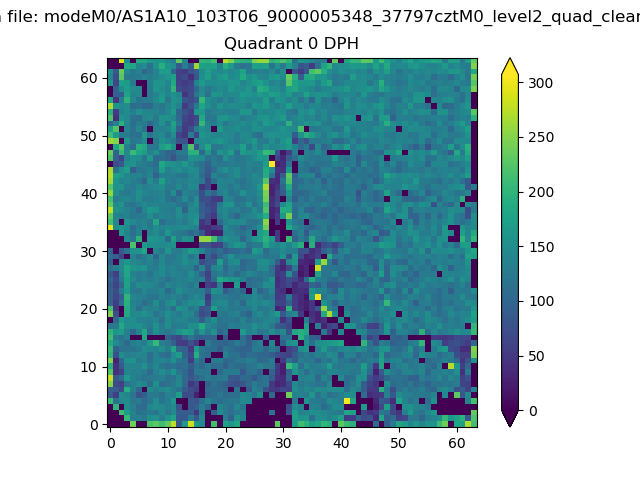 |
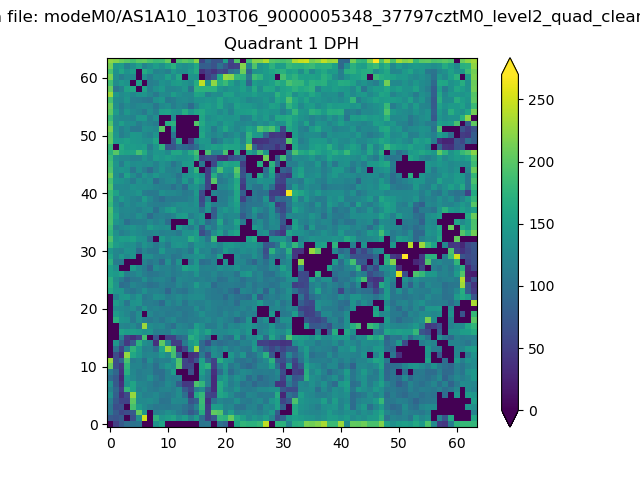 |
Quadrant B |
|---|---|---|---|
| Quadrant D | 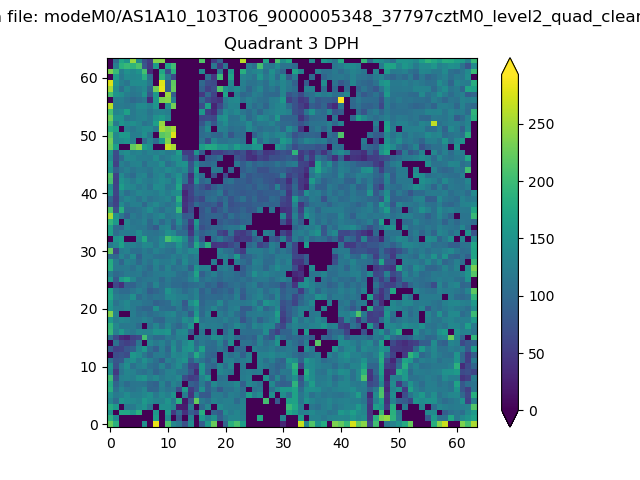 |
 |
Quadrant C |
| Plot type | Count rate plots | Images |
|---|---|---|
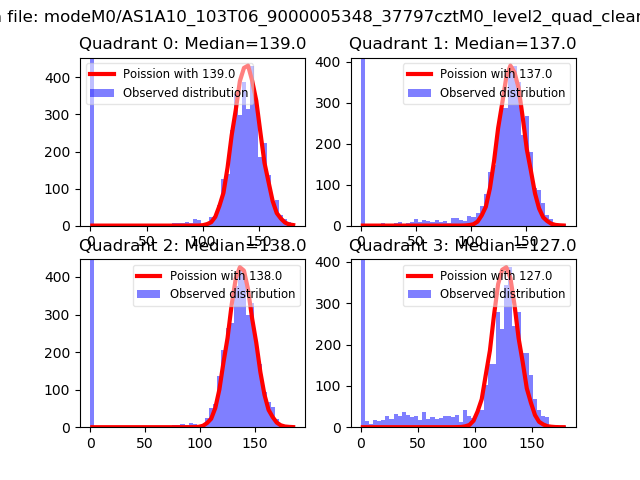
| Comparison with Poisson distribution Blue bars denote a histogram of data divided into 1 sec bins. Red curve is a Poisson curve with rate = median count rate of data. |
 |
 |
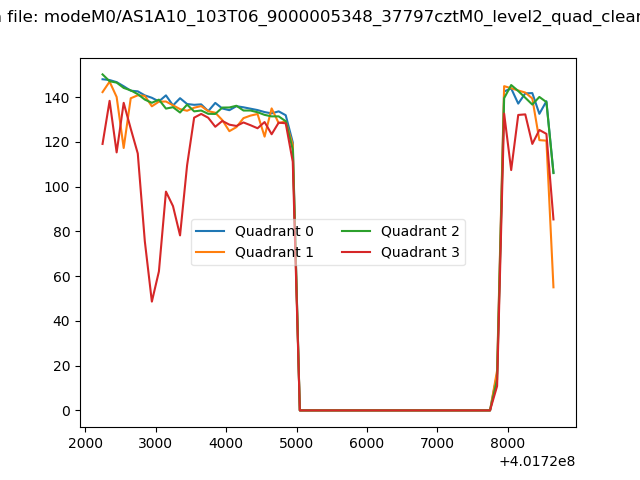
| Quadrant-wise count rates Data is divided into 100 sec bins |
 |
|
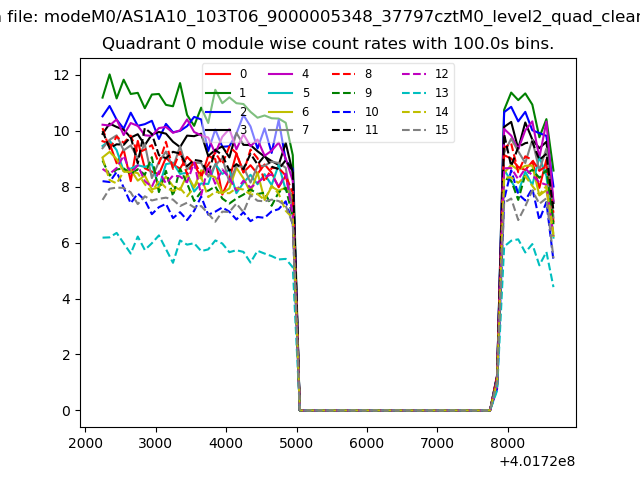
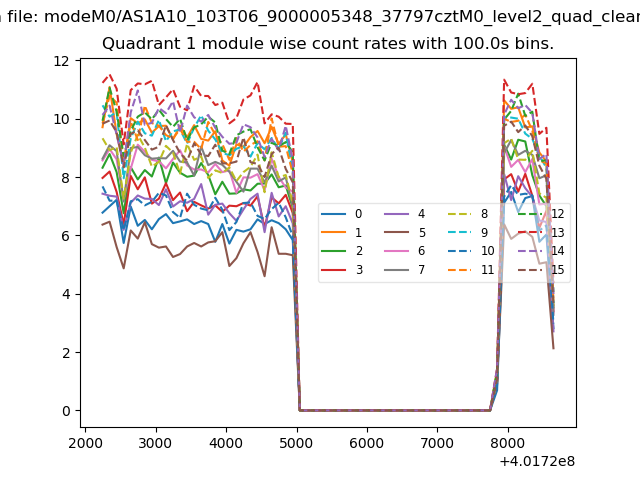
| Module-wise count rates for Quadrant A Data is divided into 100 sec bins |
 |
 |
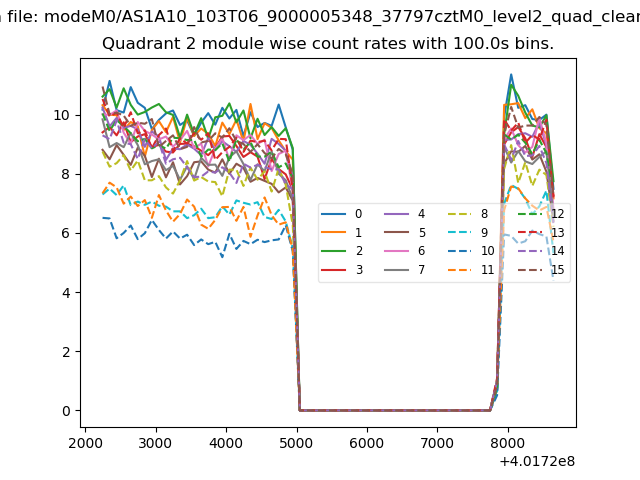
| Module-wise count rates for Quadrant B Data is divided into 100 sec bins |
 |
 |
| Module-wise count rates for Quadrant C Data is divided into 100 sec bins |
 |
 |
| Module-wise count rates for Quadrant D Data is divided into 100 sec bins |
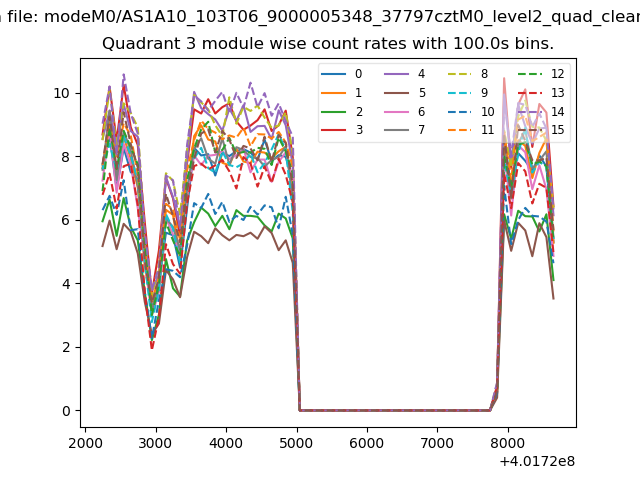 |
 |
| Parameter | Plot |
|---|---|
| CZT HV Monitor | 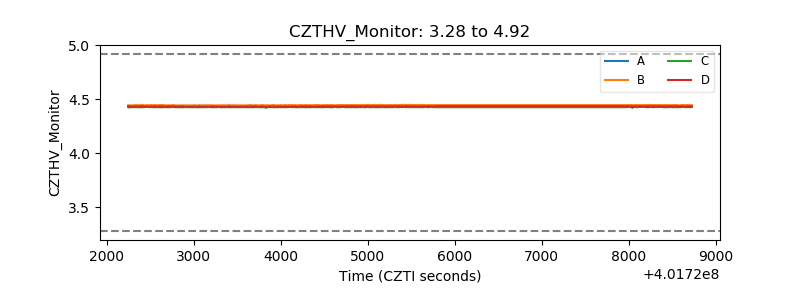 |
| D_VDD | 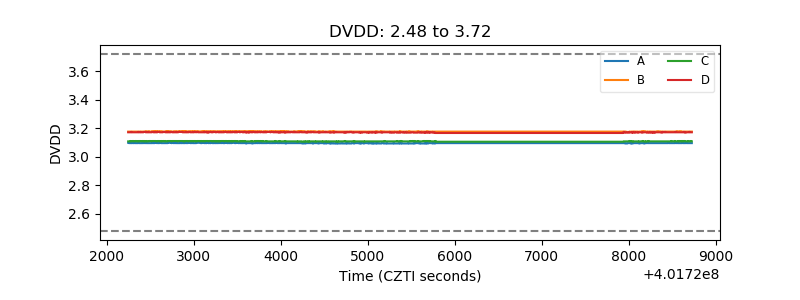 |
| Temperature 1 | 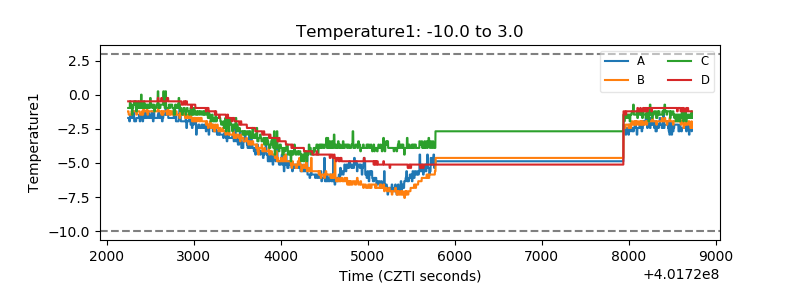 |
| Veto HV Monitor | 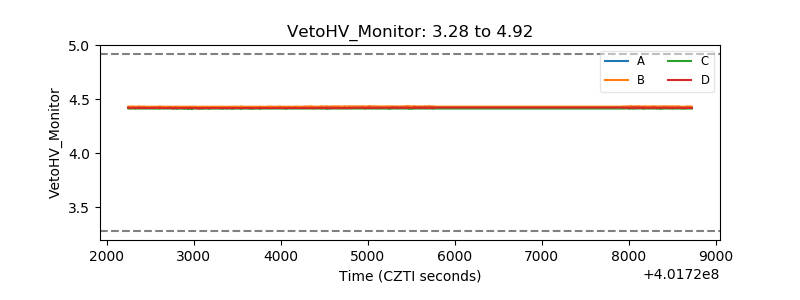 |
| Veto LLD | 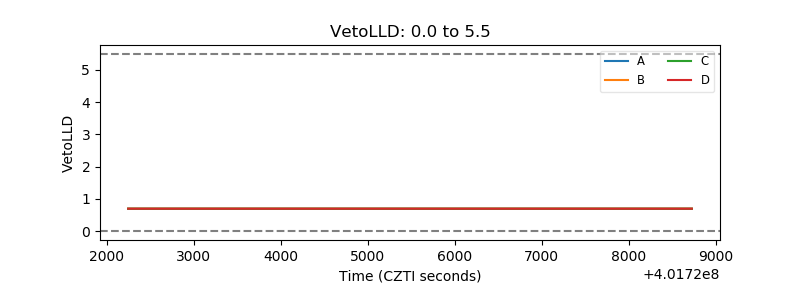 |
| Alpha Counter | 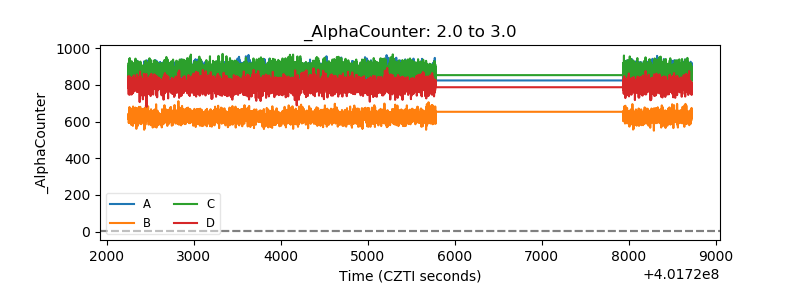 |
| _CPM_Rate | 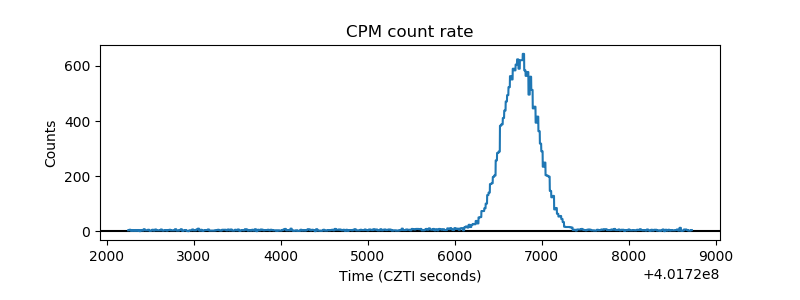 |
| CZT Counter | 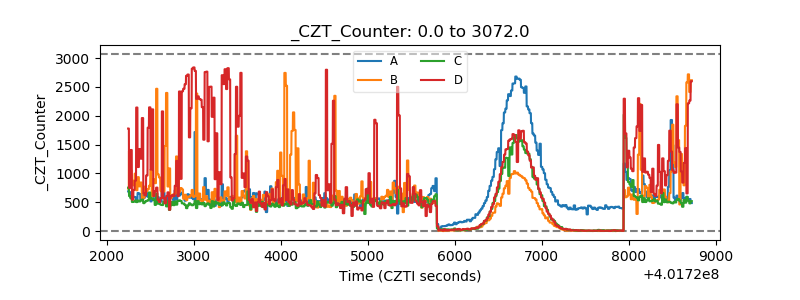 |
| +2.5 Volts monitor | 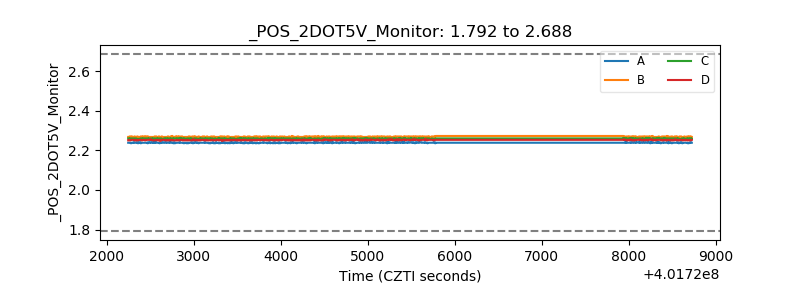 |
| +5 Volts monitor | 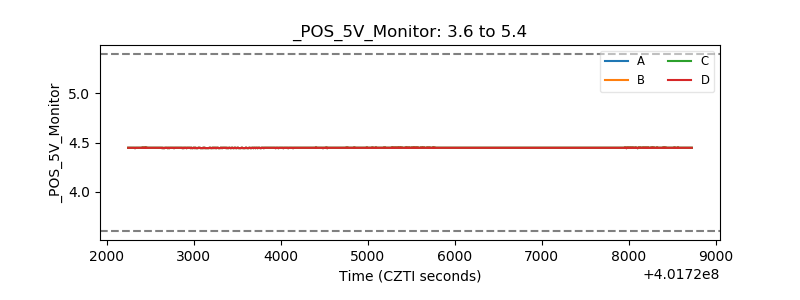 |
| _ROLL_ROT | 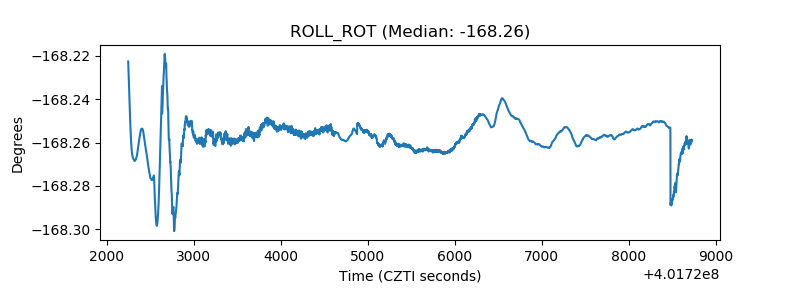 |
| _Roll_DEC | 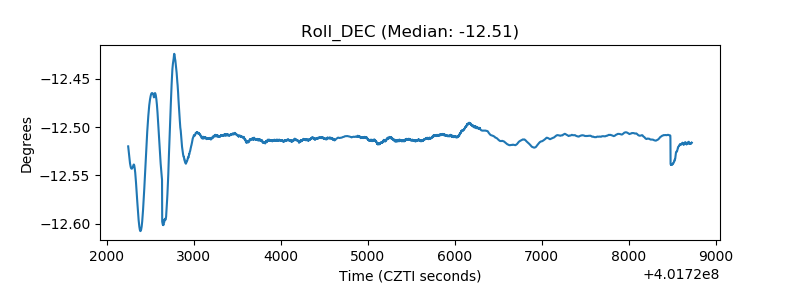 |
| _Roll_RA |  |
| Veto Counter | 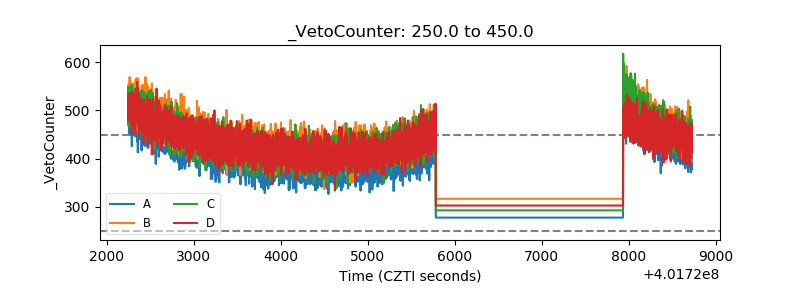 |