| Param | Original file | Final file |
|---|---|---|
| Filename | modeM0/AS1A10_103T06_9000005348_37798cztM0_level2.evt | modeM0/AS1A10_103T06_9000005348_37798cztM0_level2_quad_clean.evt |
| Size (bytes) | 513,987,840 | 78,370,560 |
| Size | 490.2 MB | 74.7 MB |
| Events in quadrant A | 3,141,638 | 522,304 |
| Events in quadrant B | 3,577,731 | 515,078 |
| Events in quadrant C | 2,815,587 | 523,180 |
| Events in quadrant D | 5,672,629 | 441,537 |
| Mode M9 | |||
|---|---|---|---|
| Quadrant | BADHDUFLAG | Total packets | Discarded packets |
| A | 0 | 39 | 0 |
| B | 0 | 39 | 0 |
| C | 0 | 39 | 0 |
| D | 0 | 40 | 0 |
| Mode M0 | |||
|---|---|---|---|
| Quadrant | BADHDUFLAG | Total packets | Discarded packets |
| A | 0 | 12538 | 3 |
| B | 0 | 14028 | 2 |
| C | 0 | 11573 | 2 |
| D | 0 | 20448 | 2 |
| Mode SS | |||
|---|---|---|---|
| Quadrant | BADHDUFLAG | Total packets | Discarded packets |
| A | 0 | 108 | 0 |
| B | 0 | 108 | 0 |
| C | 0 | 108 | 0 |
| D | 0 | 108 | 0 |
| Quadrant | Total seconds | Saturated seconds | Saturation percentage |
|---|---|---|---|
| A | 5294 | 46 | 0.868908% |
| B | 5294 | 244 | 4.608991% |
| C | 5294 | 41 | 0.774462% |
| D | 5294 | 818 | 15.451454% |
Noise dominated data is calculated using 1-second bins in cleaned event files. If a bin has >2000 counts, and if more than 50% of those come from <1% of pixels, then it is considered to be noise-dominated and hence unusable.
| Quadrant | # 1 sec bins | Bins with >0 counts | Bins with >2000 counts | High rate bins dominated by noise | Noise dominated (total time) | Noise dominated (detector-on time) | Marked lightcurve |
|---|---|---|---|---|---|---|---|
| A | 7326 | 5295 | 35 | 35 | 0.48% | 0.66% | 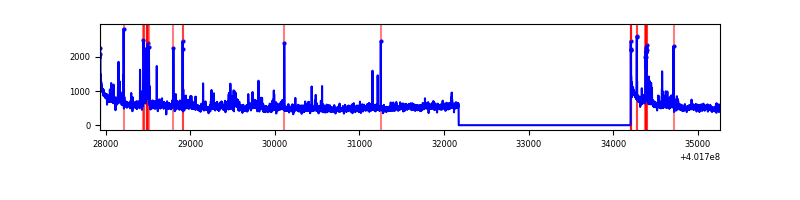 |
| B | 7326 | 5295 | 208 | 208 | 2.84% | 3.93% | 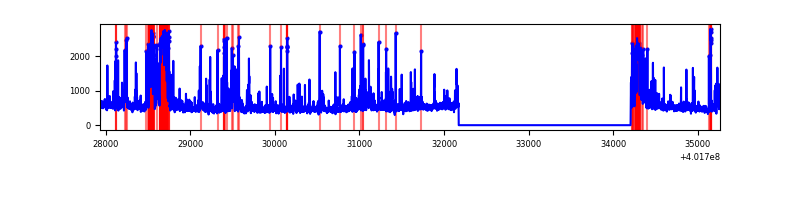 |
| C | 7326 | 5295 | 37 | 37 | 0.51% | 0.70% | 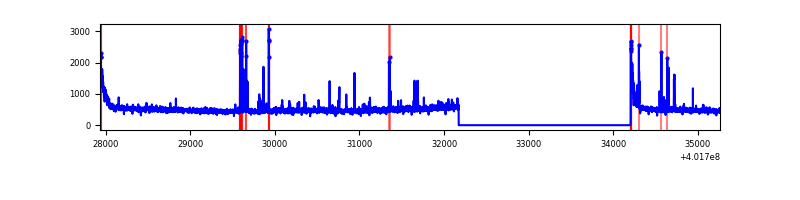 |
| D | 7326 | 5295 | 855 | 855 | 11.67% | 16.15% | 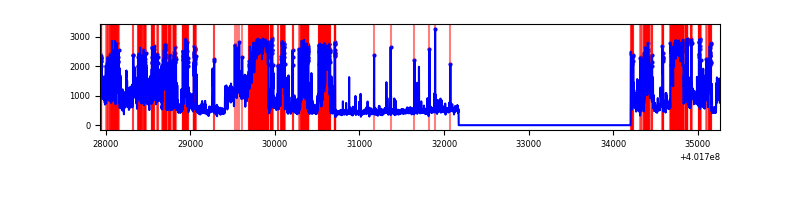 |
Top three noisy pixels from each quadrant. If the there are fewer than three noisy pixels in the level2.evt file, extra rows are filled as -1
| Pixel properties | Quadrant properties | ||||||
|---|---|---|---|---|---|---|---|
| Quadrant | DetID | PixID | Counts | Sigma | Mean | Median | Sigma |
| A | 10 | 83 | 347365 | 2792.33 | 617 | 607 | 124.2 |
| A | 15 | 222 | 280328 | 2252.5 | 617 | 607 | 124.2 |
| A | 9 | 143 | 69877 | 557.81 | 617 | 607 | 124.2 |
| B | 5 | 172 | 659865 | 5693.86 | 601 | 586 | 115.8 |
| B | 0 | 229 | 311209 | 2682.69 | 601 | 586 | 115.8 |
| B | 0 | 230 | 68478 | 586.35 | 601 | 586 | 115.8 |
| C | 15 | 214 | 237958 | 1717.37 | 591 | 595 | 138.2 |
| C | 0 | 207 | 136322 | 982.01 | 591 | 595 | 138.2 |
| C | 0 | 10 | 119413 | 859.67 | 591 | 595 | 138.2 |
| D | 13 | 249 | 2530046 | 18423.81 | 556 | 541 | 137.3 |
| D | 7 | 223 | 430685 | 3132.98 | 556 | 541 | 137.3 |
| D | 10 | 199 | 242595 | 1763.02 | 556 | 541 | 137.3 |
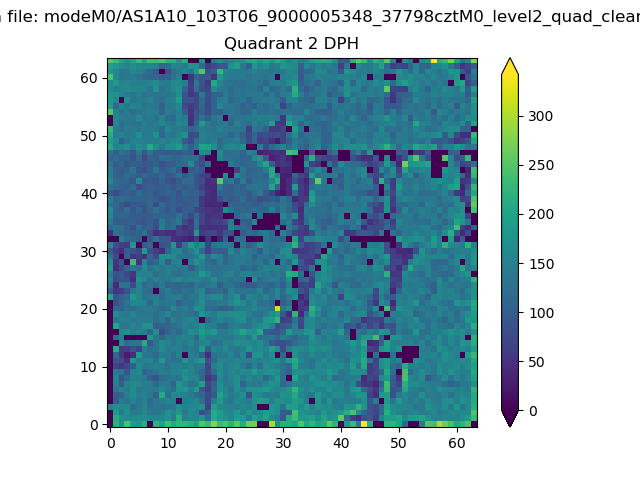
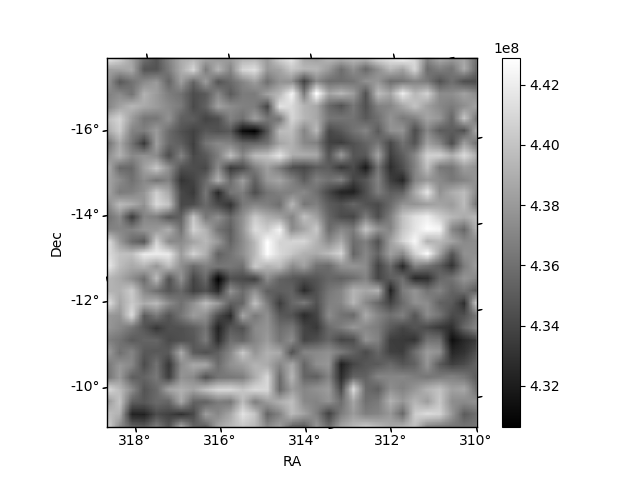
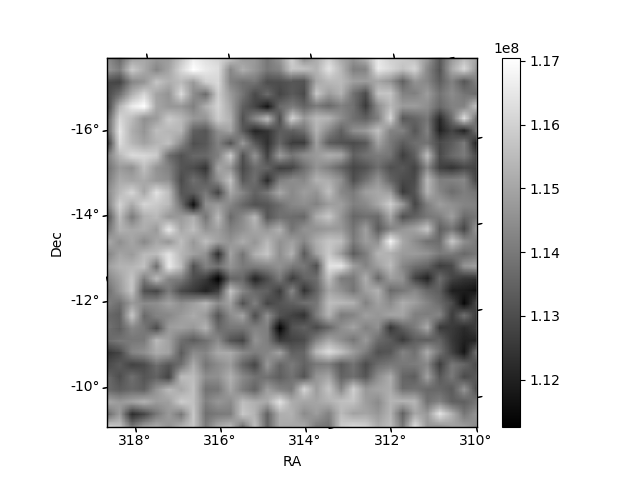
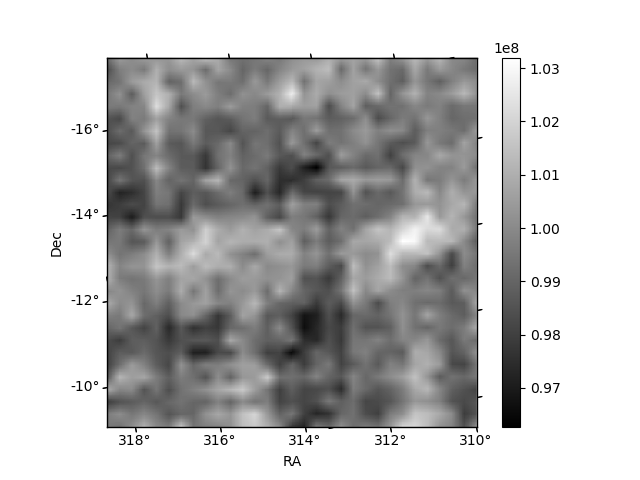
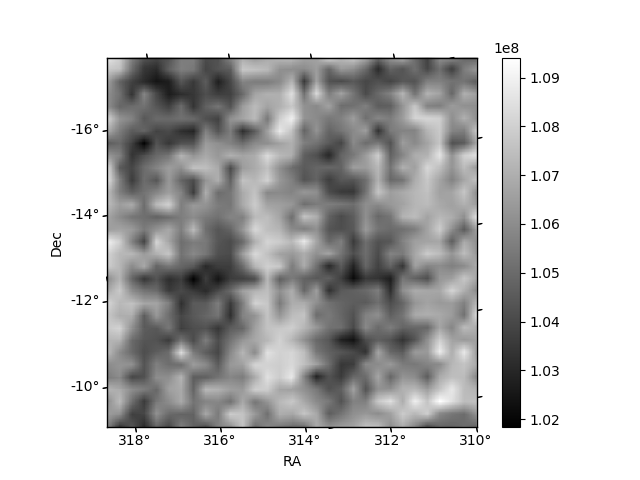
Histogram calculated using DETX and DETY for each event in the final _common_clean file
| Quadrant A | 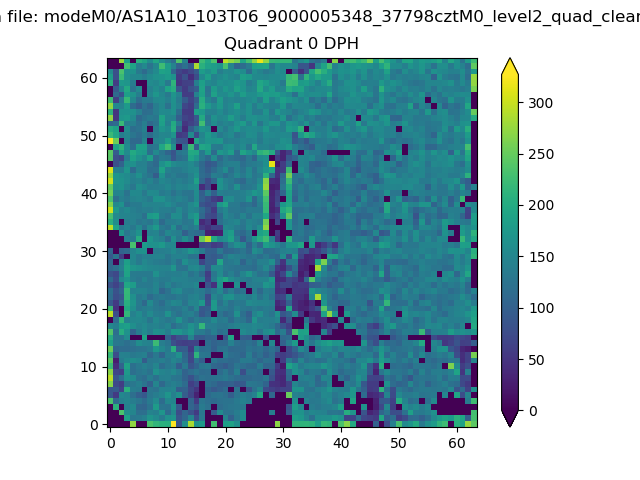 |
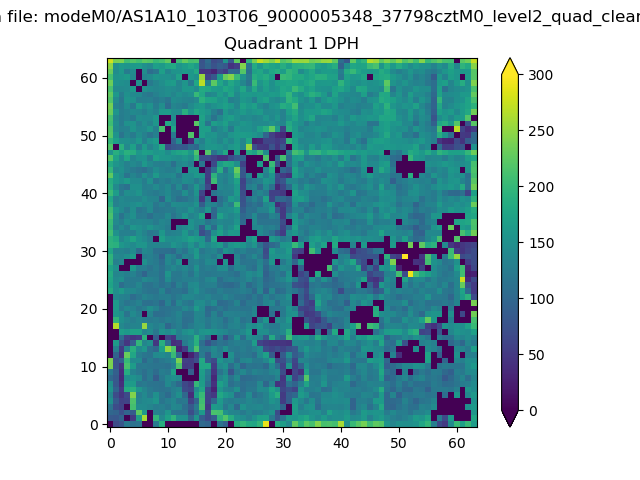 |
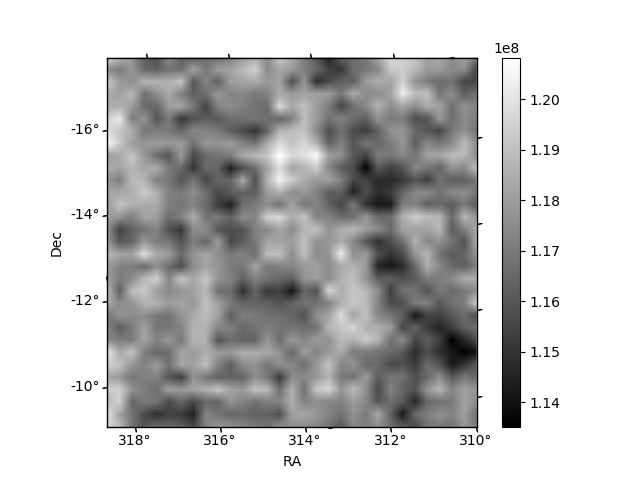
Quadrant B |
|---|---|---|---|
| Quadrant D | 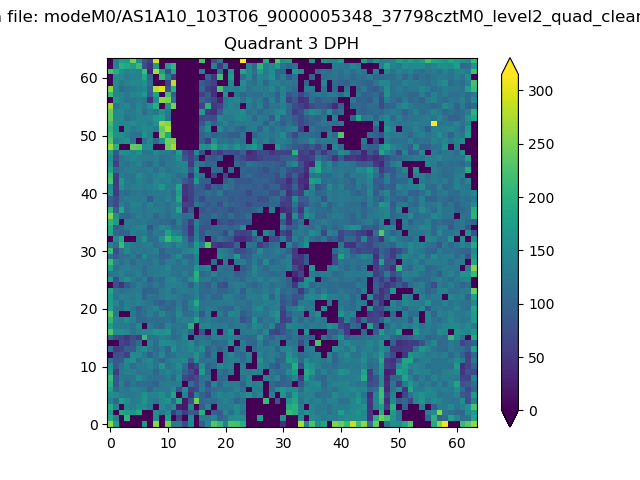 |
 |
Quadrant C |
| Plot type | Count rate plots | Images |
|---|---|---|
| Comparison with Poisson distribution Blue bars denote a histogram of data divided into 1 sec bins. Red curve is a Poisson curve with rate = median count rate of data. |
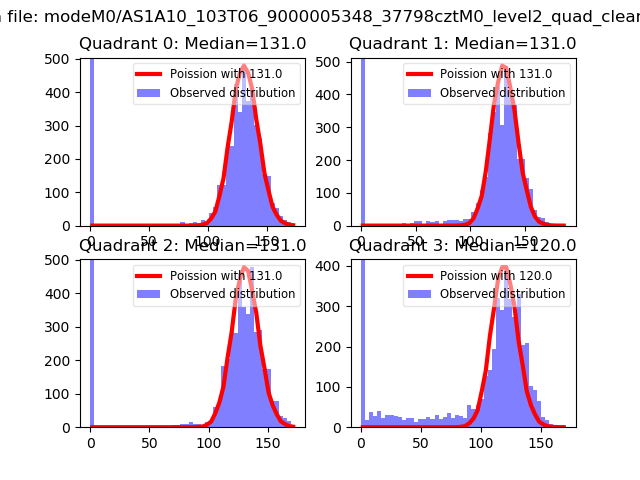 |
 |
| Quadrant-wise count rates Data is divided into 100 sec bins |
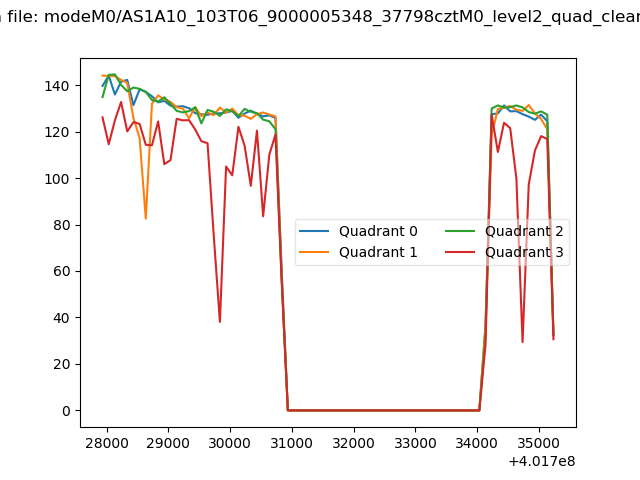 |
|
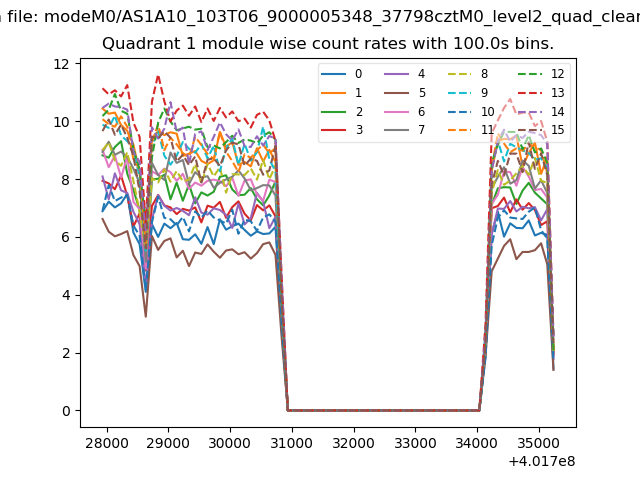
| Module-wise count rates for Quadrant A Data is divided into 100 sec bins |
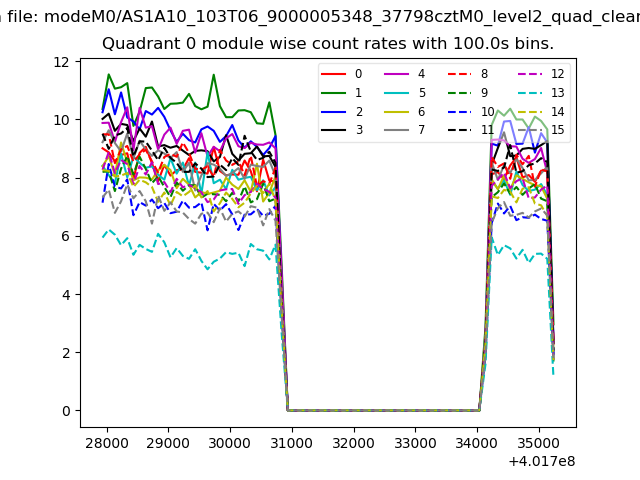 |
 |
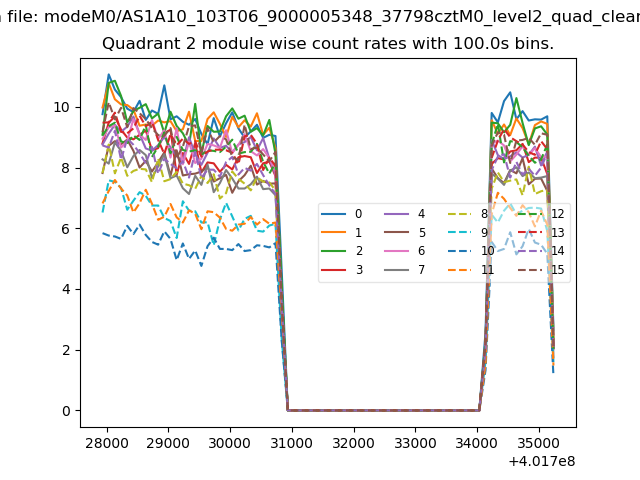
| Module-wise count rates for Quadrant B Data is divided into 100 sec bins |
 |
 |
| Module-wise count rates for Quadrant C Data is divided into 100 sec bins |
 |
 |
| Module-wise count rates for Quadrant D Data is divided into 100 sec bins |
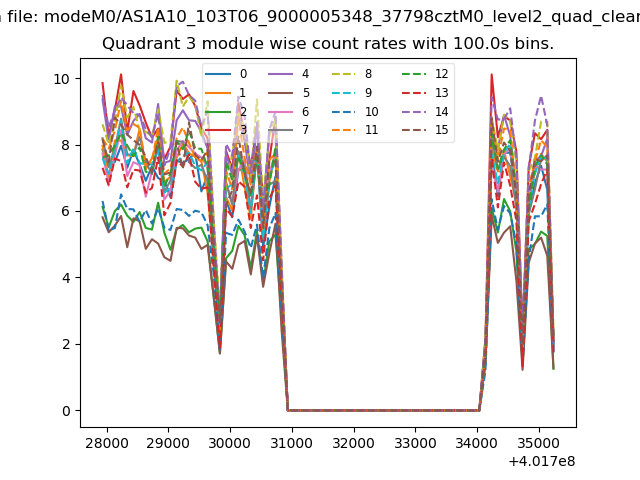 |
 |
| Parameter | Plot |
|---|---|
| CZT HV Monitor | 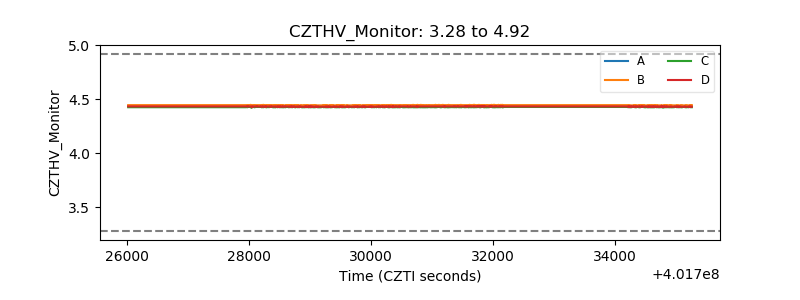 |
| D_VDD | 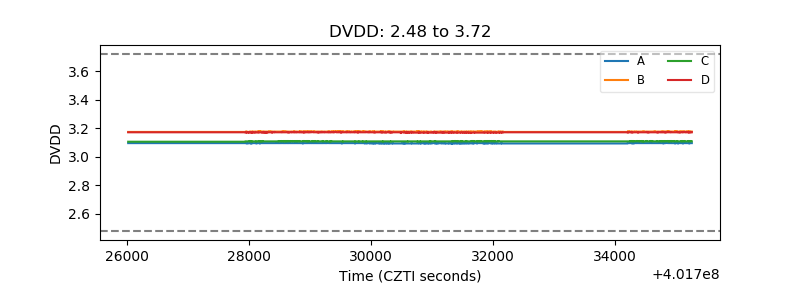 |
| Temperature 1 | 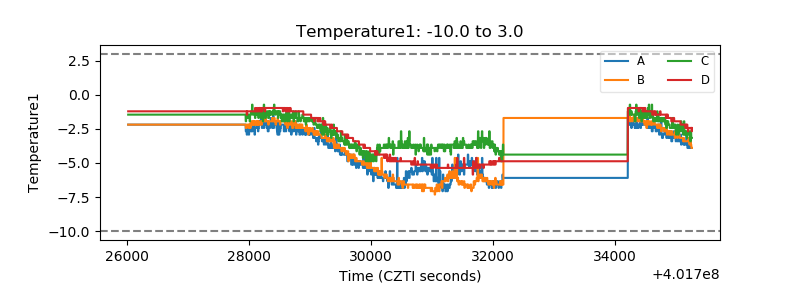 |
| Veto HV Monitor |  |
| Veto LLD | 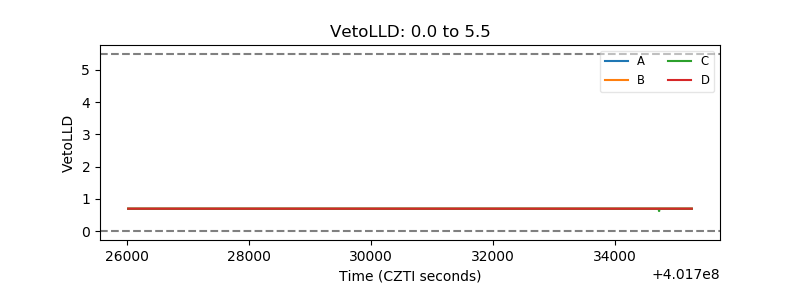 |
| Alpha Counter | 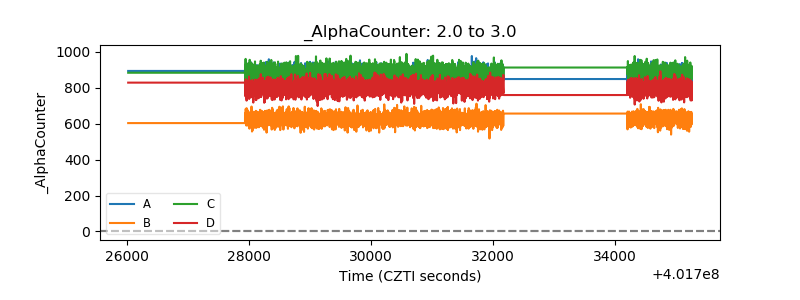 |
| _CPM_Rate | 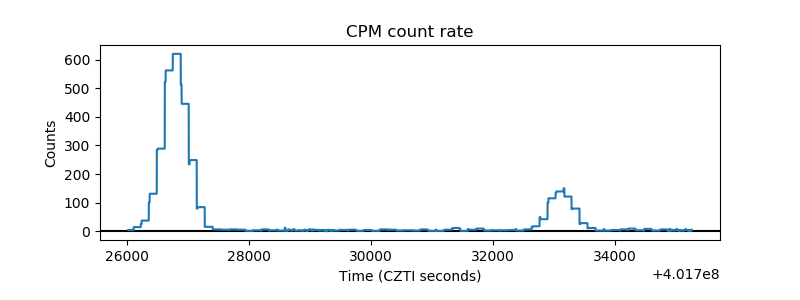 |
| CZT Counter | 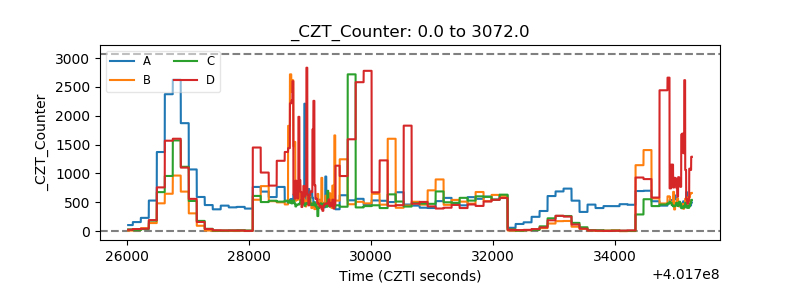 |
| +2.5 Volts monitor | 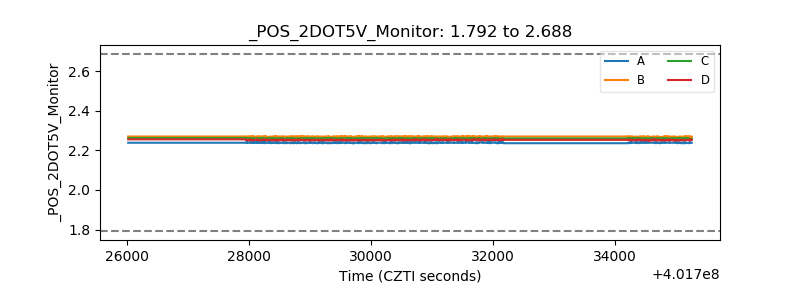 |
| +5 Volts monitor | 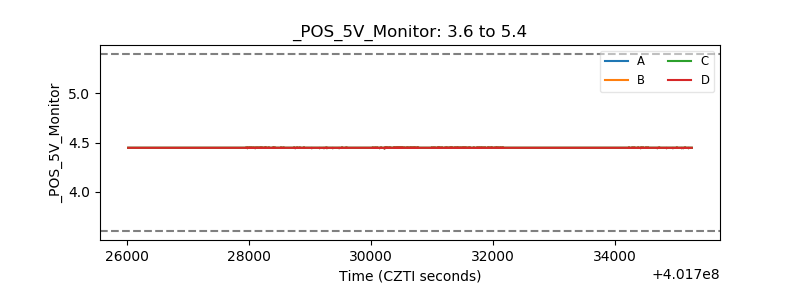 |
| _ROLL_ROT | 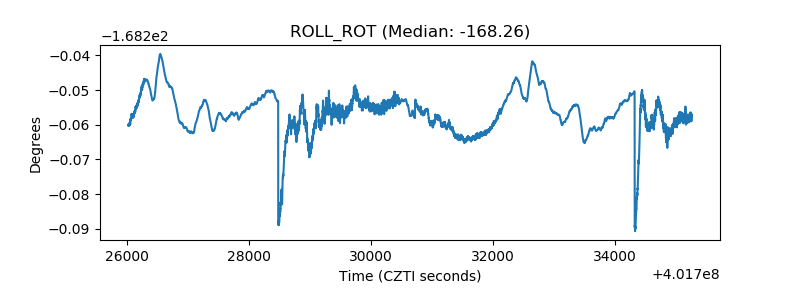 |
| _Roll_DEC | 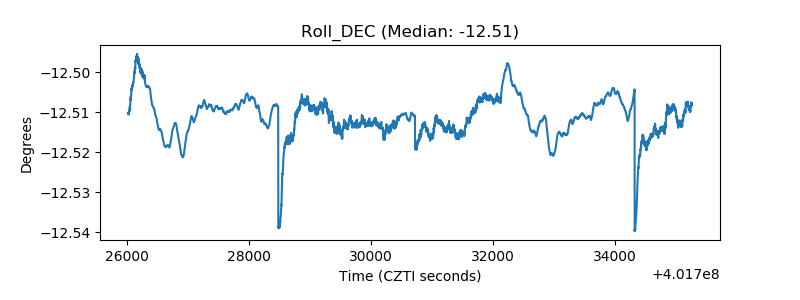 |
| _Roll_RA | 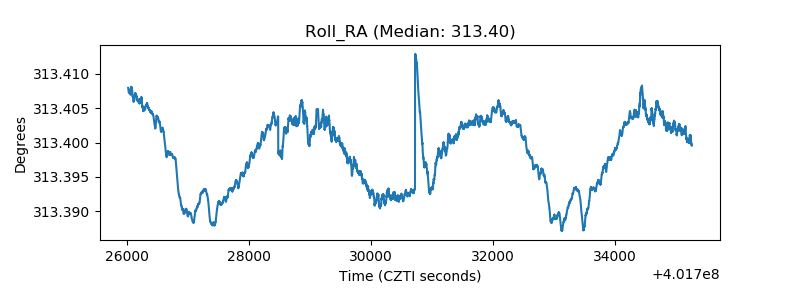 |
| Veto Counter | 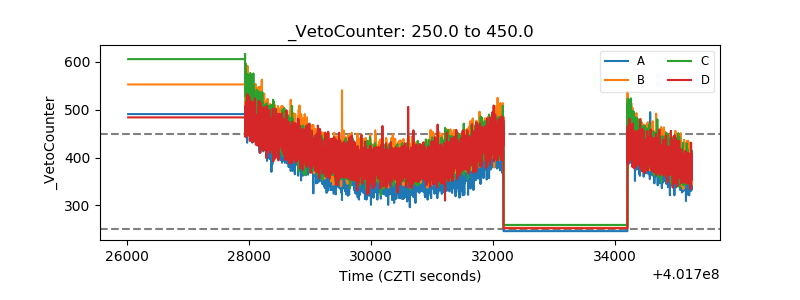 |