| Param | Original file | Final file |
|---|---|---|
| Filename | modeM0/AS1A10_103T06_9000005348_37800cztM0_level2.evt | modeM0/AS1A10_103T06_9000005348_37800cztM0_level2_quad_clean.evt |
| Size (bytes) | 467,242,560 | 68,503,680 |
| Size | 445.6 MB | 65.3 MB |
| Events in quadrant A | 3,132,000 | 427,677 |
| Events in quadrant B | 3,417,436 | 424,161 |
| Events in quadrant C | 2,966,535 | 431,253 |
| Events in quadrant D | 4,244,932 | 389,623 |
| Mode M9 | |||
|---|---|---|---|
| Quadrant | BADHDUFLAG | Total packets | Discarded packets |
| A | 0 | 28 | 0 |
| B | 0 | 28 | 0 |
| C | 0 | 28 | 0 |
| D | 0 | 29 | 0 |
| Mode M0 | |||
|---|---|---|---|
| Quadrant | BADHDUFLAG | Total packets | Discarded packets |
| A | 0 | 12872 | 3 |
| B | 0 | 13839 | 2 |
| C | 0 | 12373 | 2 |
| D | 0 | 16495 | 2 |
| Mode SS | |||
|---|---|---|---|
| Quadrant | BADHDUFLAG | Total packets | Discarded packets |
| A | 0 | 118 | 0 |
| B | 0 | 118 | 0 |
| C | 0 | 118 | 0 |
| D | 0 | 118 | 0 |
| Quadrant | Total seconds | Saturated seconds | Saturation percentage |
|---|---|---|---|
| A | 5733 | 39 | 0.680272% |
| B | 5733 | 182 | 3.174603% |
| C | 5733 | 35 | 0.610501% |
| D | 5733 | 449 | 7.831851% |
Noise dominated data is calculated using 1-second bins in cleaned event files. If a bin has >2000 counts, and if more than 50% of those come from <1% of pixels, then it is considered to be noise-dominated and hence unusable.
| Quadrant | # 1 sec bins | Bins with >0 counts | Bins with >2000 counts | High rate bins dominated by noise | Noise dominated (total time) | Noise dominated (detector-on time) | Marked lightcurve |
|---|---|---|---|---|---|---|---|
| A | 7166 | 5734 | 23 | 23 | 0.32% | 0.40% |  |
| B | 7166 | 5734 | 145 | 145 | 2.02% | 2.53% |  |
| C | 7166 | 5734 | 30 | 30 | 0.42% | 0.52% | 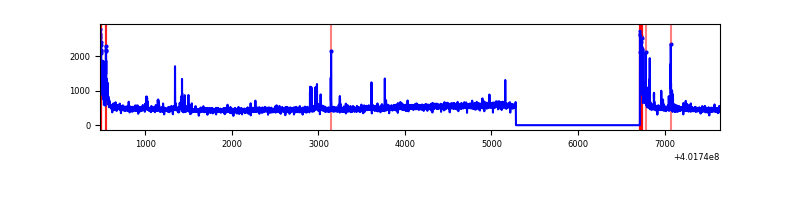 |
| D | 7166 | 5734 | 377 | 377 | 5.26% | 6.57% |  |
Top three noisy pixels from each quadrant. If the there are fewer than three noisy pixels in the level2.evt file, extra rows are filled as -1
| Pixel properties | Quadrant properties | ||||||
|---|---|---|---|---|---|---|---|
| Quadrant | DetID | PixID | Counts | Sigma | Mean | Median | Sigma |
| A | 10 | 83 | 351189 | 2669.36 | 648 | 635 | 131.3 |
| A | 15 | 222 | 137769 | 1044.23 | 648 | 635 | 131.3 |
| A | 9 | 143 | 105363 | 797.47 | 648 | 635 | 131.3 |
| B | 5 | 172 | 577130 | 4662.48 | 641 | 625 | 123.6 |
| B | 0 | 229 | 149117 | 1200.93 | 641 | 625 | 123.6 |
| B | 4 | 232 | 47578 | 379.73 | 641 | 625 | 123.6 |
| C | 15 | 214 | 259637 | 1739.87 | 632 | 637 | 148.9 |
| C | 0 | 10 | 138425 | 925.61 | 632 | 637 | 148.9 |
| C | 0 | 207 | 67109 | 446.53 | 632 | 637 | 148.9 |
| D | 13 | 249 | 1187364 | 7735.53 | 615 | 597 | 153.4 |
| D | 1 | 52 | 234770 | 1526.37 | 615 | 597 | 153.4 |
| D | 2 | 153 | 52841 | 340.53 | 615 | 597 | 153.4 |
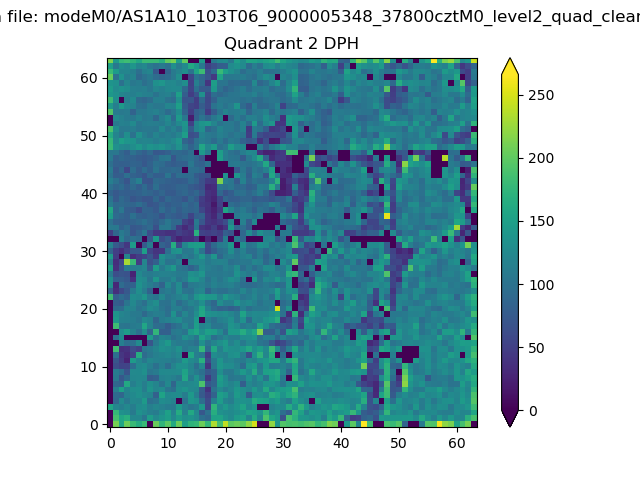
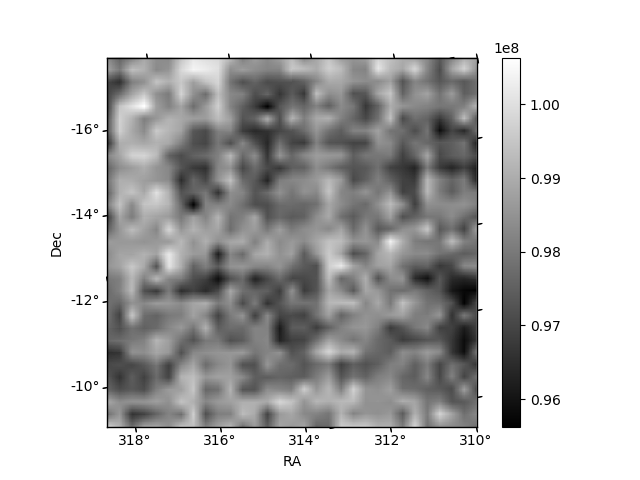
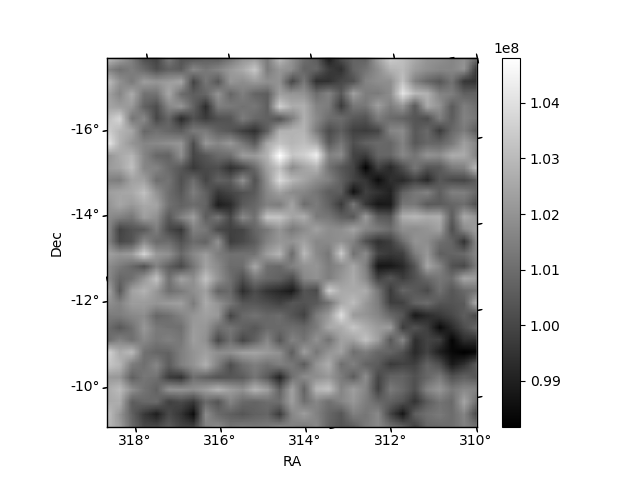
Histogram calculated using DETX and DETY for each event in the final _common_clean file
| Quadrant A | 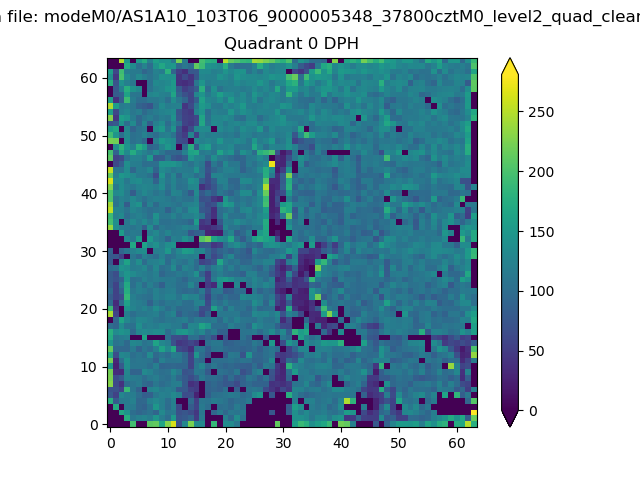 |
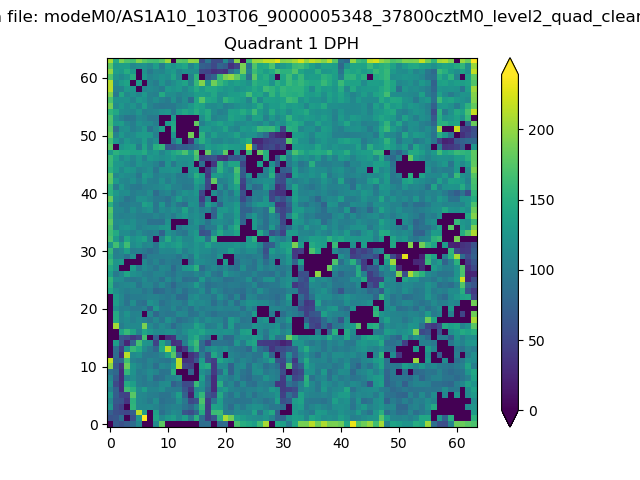 |
Quadrant B |
|---|---|---|---|
| Quadrant D | 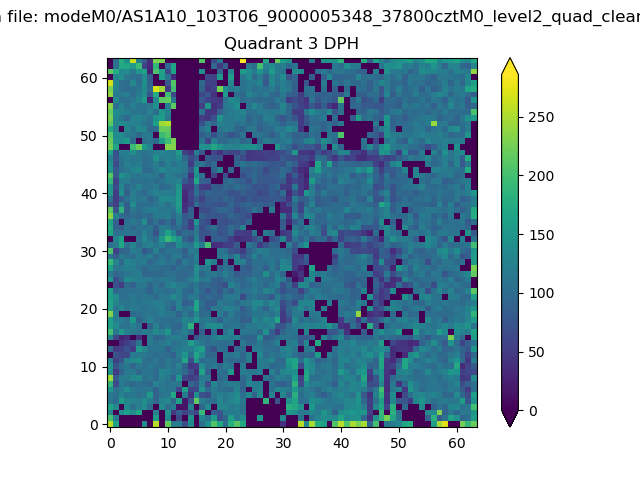 |
 |
Quadrant C |
| Plot type | Count rate plots | Images |
|---|---|---|
| Comparison with Poisson distribution Blue bars denote a histogram of data divided into 1 sec bins. Red curve is a Poisson curve with rate = median count rate of data. |
 |
 |
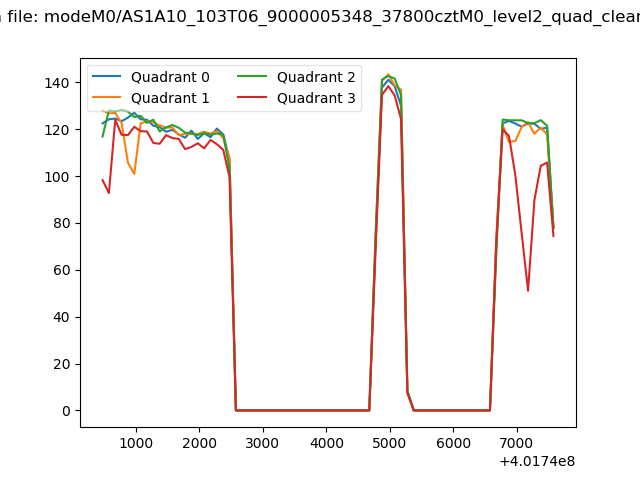
| Quadrant-wise count rates Data is divided into 100 sec bins |
 |
|
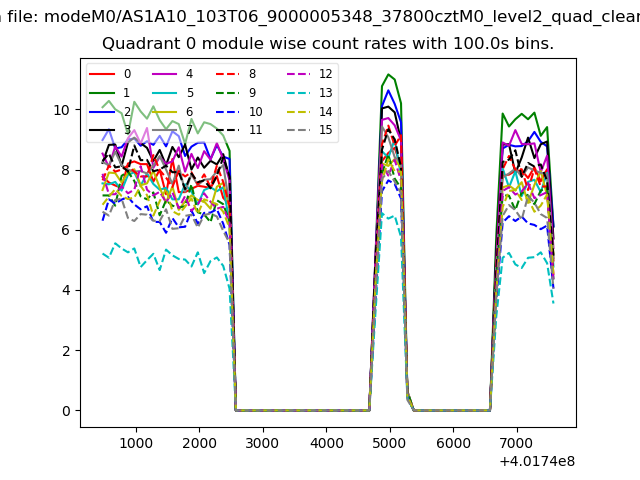
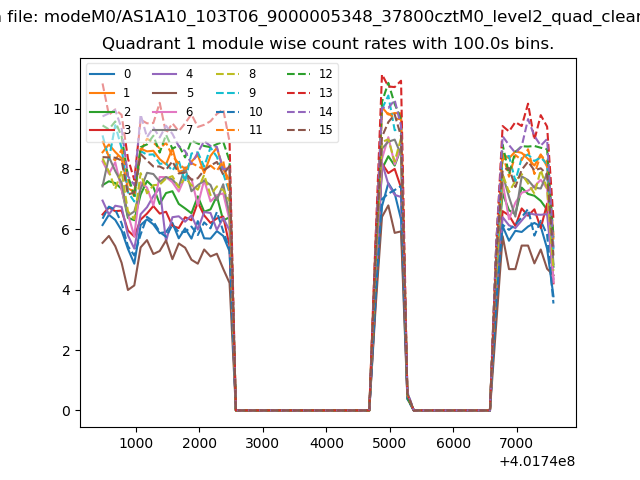
| Module-wise count rates for Quadrant A Data is divided into 100 sec bins |
 |
 |
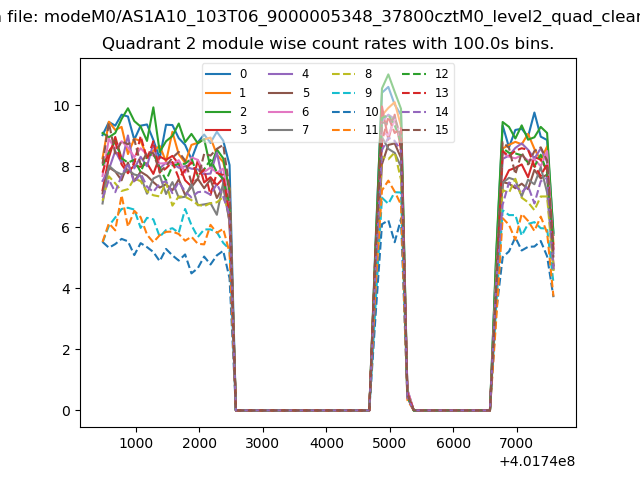
| Module-wise count rates for Quadrant B Data is divided into 100 sec bins |
 |
 |
| Module-wise count rates for Quadrant C Data is divided into 100 sec bins |
 |
 |
| Module-wise count rates for Quadrant D Data is divided into 100 sec bins |
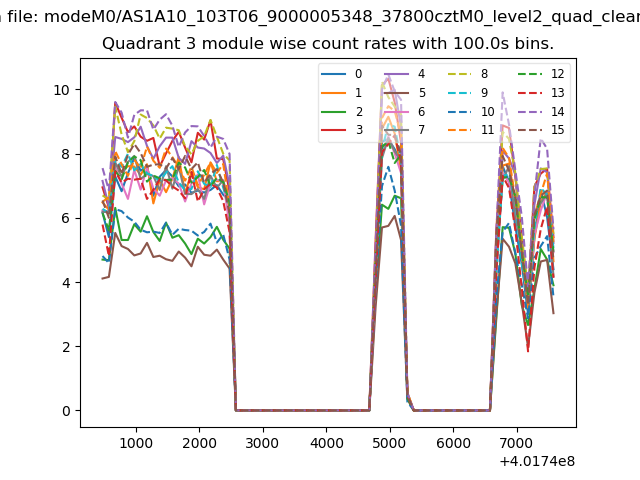 |
 |
| Parameter | Plot |
|---|---|
| CZT HV Monitor | 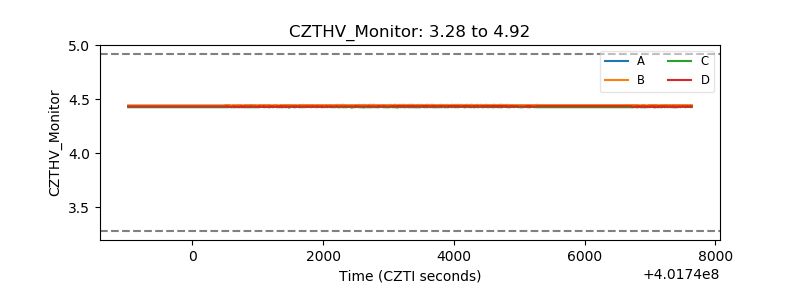 |
| D_VDD | 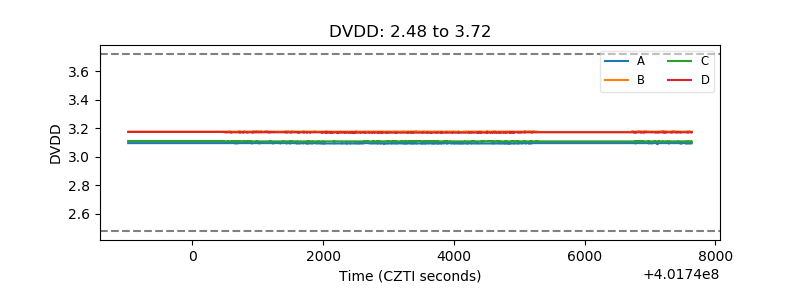 |
| Temperature 1 | 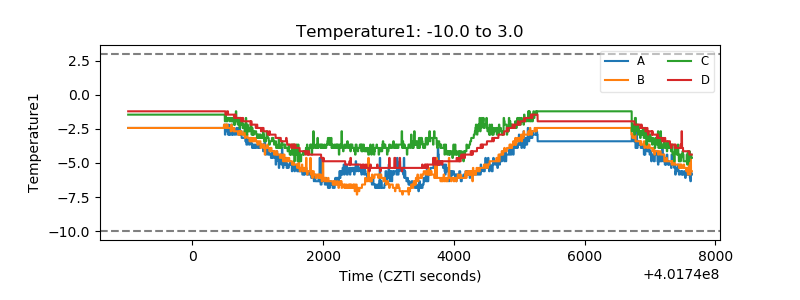 |
| Veto HV Monitor | 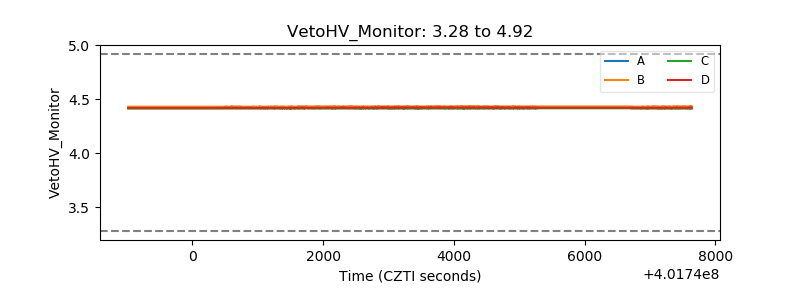 |
| Veto LLD | 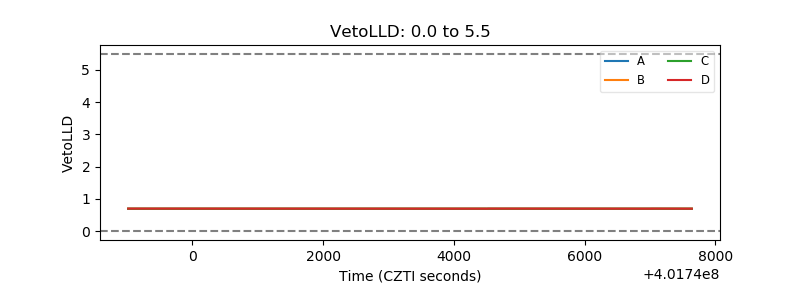 |
| Alpha Counter | 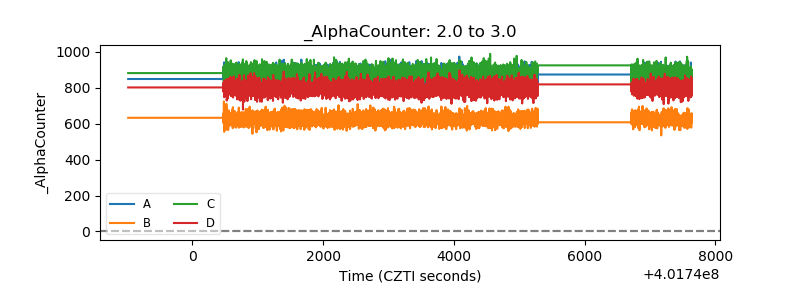 |
| _CPM_Rate | 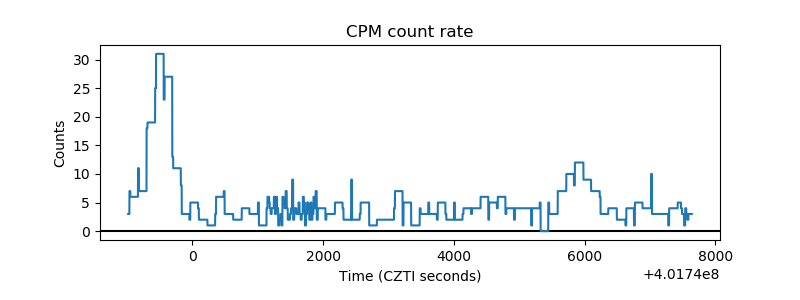 |
| CZT Counter | 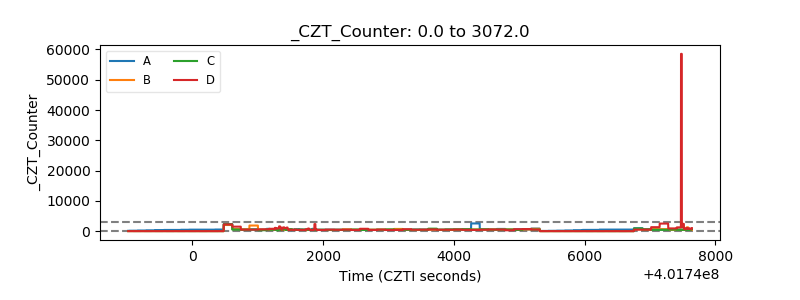 |
| +2.5 Volts monitor | 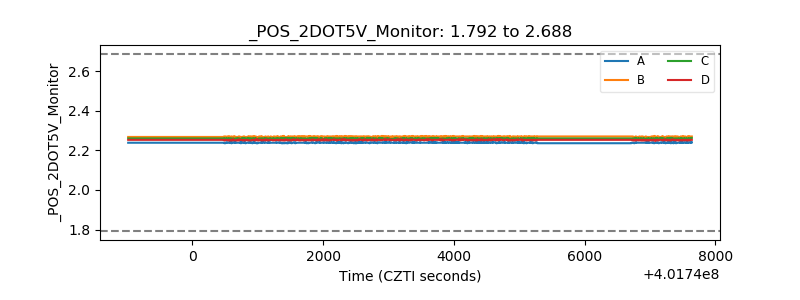 |
| +5 Volts monitor | 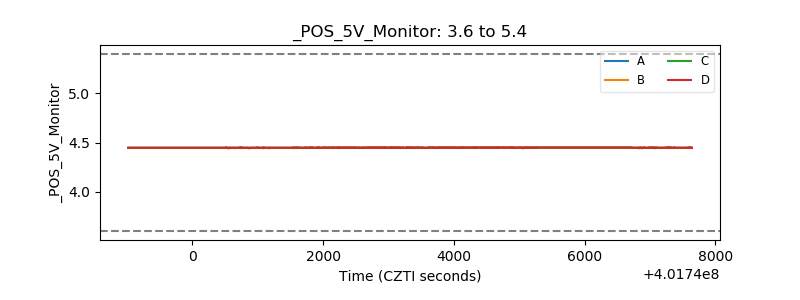 |
| _ROLL_ROT | 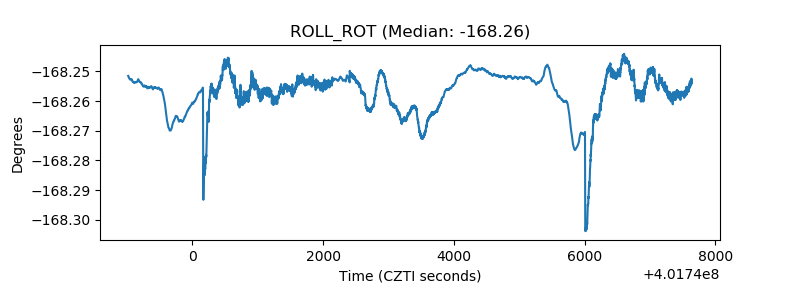 |
| _Roll_DEC | 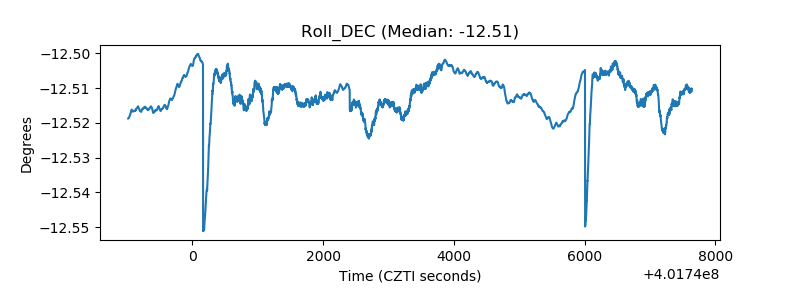 |
| _Roll_RA | 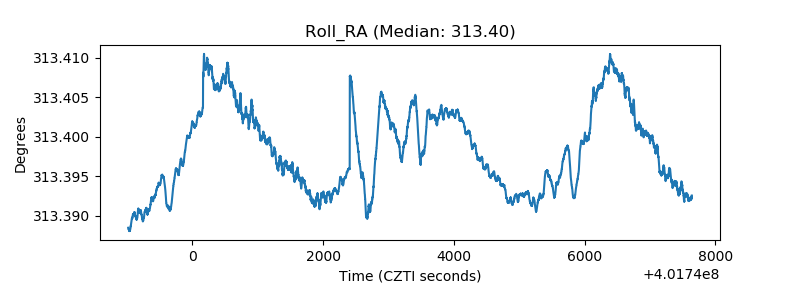 |
| Veto Counter | 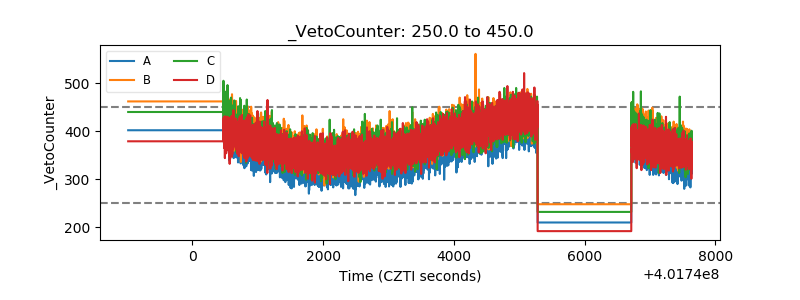 |