| Param | Original file | Final file |
|---|---|---|
| Filename | modeM0/AS1A10_103T06_9000005348_37801cztM0_level2.evt | modeM0/AS1A10_103T06_9000005348_37801cztM0_level2_quad_clean.evt |
| Size (bytes) | 471,303,360 | 73,379,520 |
| Size | 449.5 MB | 70.0 MB |
| Events in quadrant A | 3,129,948 | 459,701 |
| Events in quadrant B | 3,469,940 | 457,910 |
| Events in quadrant C | 3,032,068 | 465,765 |
| Events in quadrant D | 4,233,867 | 419,123 |
| Mode M9 | |||
|---|---|---|---|
| Quadrant | BADHDUFLAG | Total packets | Discarded packets |
| A | 0 | 23 | 0 |
| B | 0 | 23 | 0 |
| C | 0 | 23 | 0 |
| D | 0 | 24 | 0 |
| Mode M0 | |||
|---|---|---|---|
| Quadrant | BADHDUFLAG | Total packets | Discarded packets |
| A | 0 | 13082 | 3 |
| B | 0 | 14164 | 2 |
| C | 0 | 12680 | 2 |
| D | 0 | 16722 | 2 |
| Mode SS | |||
|---|---|---|---|
| Quadrant | BADHDUFLAG | Total packets | Discarded packets |
| A | 0 | 122 | 0 |
| B | 0 | 122 | 0 |
| C | 0 | 122 | 0 |
| D | 0 | 122 | 0 |
| Quadrant | Total seconds | Saturated seconds | Saturation percentage |
|---|---|---|---|
| A | 6003 | 15 | 0.249875% |
| B | 6003 | 126 | 2.098951% |
| C | 6003 | 24 | 0.399800% |
| D | 6003 | 447 | 7.446277% |
Noise dominated data is calculated using 1-second bins in cleaned event files. If a bin has >2000 counts, and if more than 50% of those come from <1% of pixels, then it is considered to be noise-dominated and hence unusable.
| Quadrant | # 1 sec bins | Bins with >0 counts | Bins with >2000 counts | High rate bins dominated by noise | Noise dominated (total time) | Noise dominated (detector-on time) | Marked lightcurve |
|---|---|---|---|---|---|---|---|
| A | 7286 | 6004 | 6 | 6 | 0.08% | 0.10% | 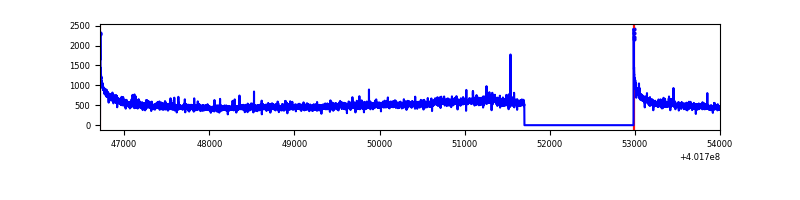 |
| B | 7286 | 6004 | 96 | 96 | 1.32% | 1.60% | 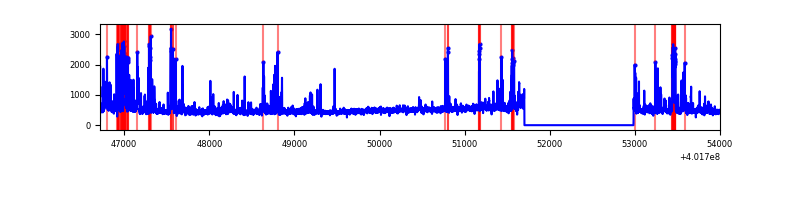 |
| C | 7286 | 6004 | 20 | 20 | 0.27% | 0.33% | 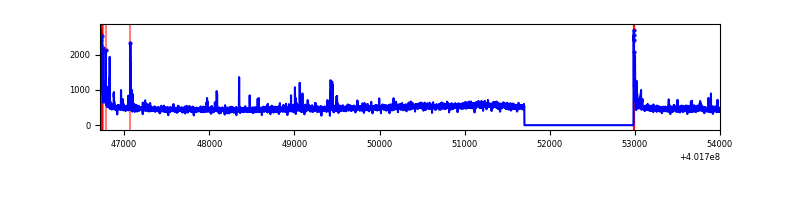 |
| D | 7286 | 6004 | 461 | 461 | 6.33% | 7.68% | 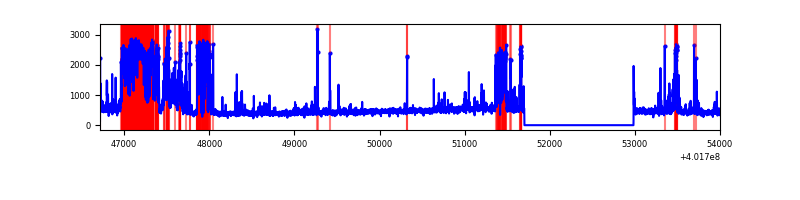 |
Top three noisy pixels from each quadrant. If the there are fewer than three noisy pixels in the level2.evt file, extra rows are filled as -1
| Pixel properties | Quadrant properties | ||||||
|---|---|---|---|---|---|---|---|
| Quadrant | DetID | PixID | Counts | Sigma | Mean | Median | Sigma |
| A | 10 | 83 | 357021 | 2585.5 | 680 | 667 | 137.8 |
| A | 15 | 222 | 92436 | 665.82 | 680 | 667 | 137.8 |
| A | 13 | 6 | 17559 | 122.56 | 680 | 667 | 137.8 |
| B | 5 | 172 | 446359 | 3407.56 | 672 | 653 | 130.8 |
| B | 0 | 229 | 153995 | 1172.35 | 672 | 653 | 130.8 |
| B | 4 | 81 | 65550 | 496.16 | 672 | 653 | 130.8 |
| C | 15 | 214 | 270393 | 1731.69 | 662 | 666 | 155.8 |
| C | 0 | 10 | 98185 | 626.09 | 662 | 666 | 155.8 |
| C | 0 | 207 | 46389 | 293.55 | 662 | 666 | 155.8 |
| D | 13 | 249 | 1426966 | 9008.26 | 643 | 625 | 158.3 |
| D | 2 | 153 | 55422 | 346.08 | 643 | 625 | 158.3 |
| D | 2 | 249 | 43409 | 270.21 | 643 | 625 | 158.3 |
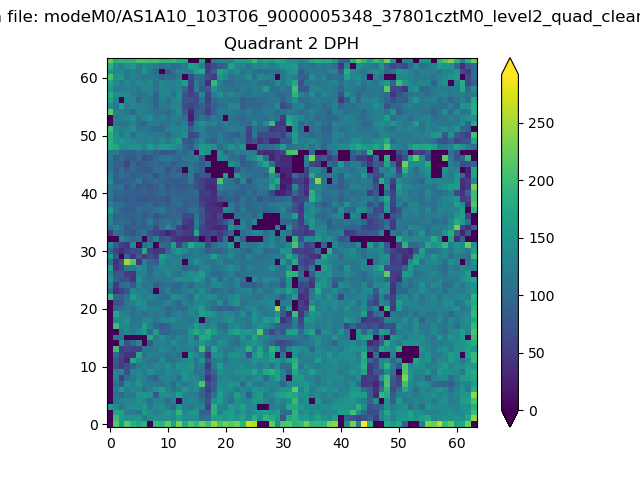
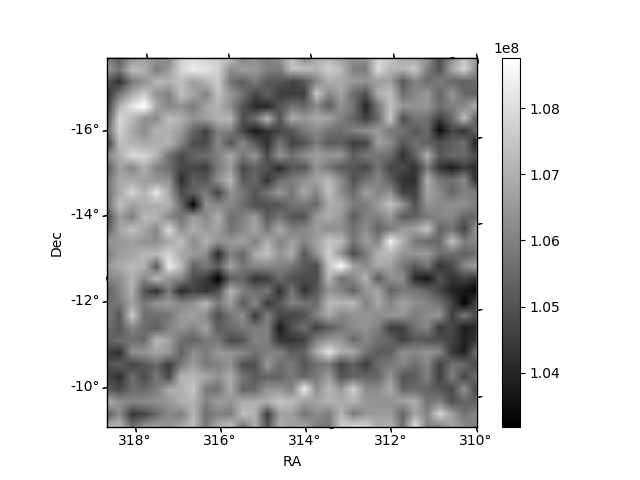
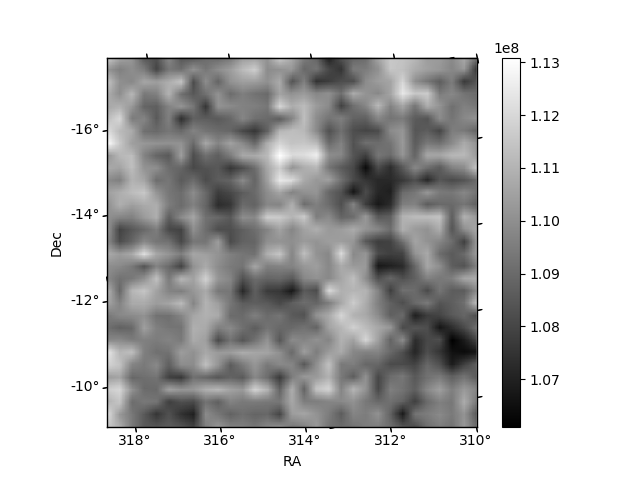
Histogram calculated using DETX and DETY for each event in the final _common_clean file
| Quadrant A | 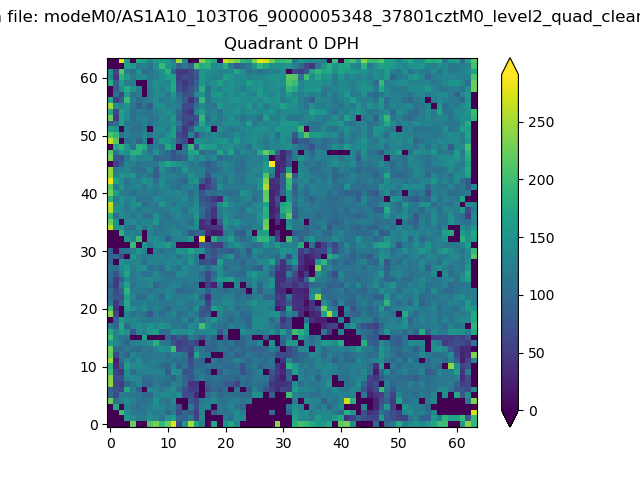 |
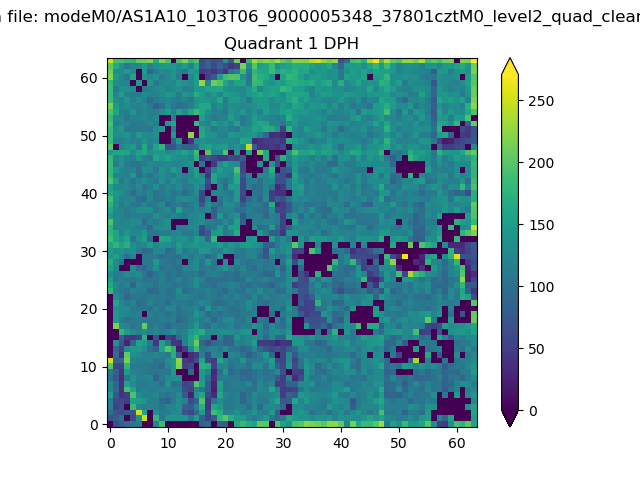 |
Quadrant B |
|---|---|---|---|
| Quadrant D | 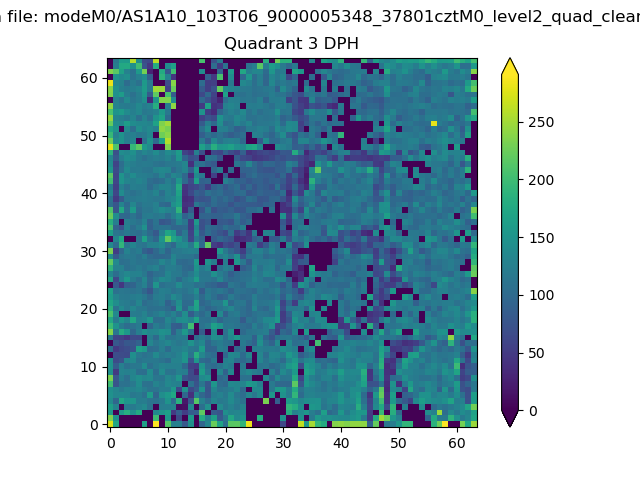 |
 |
Quadrant C |
| Plot type | Count rate plots | Images |
|---|---|---|
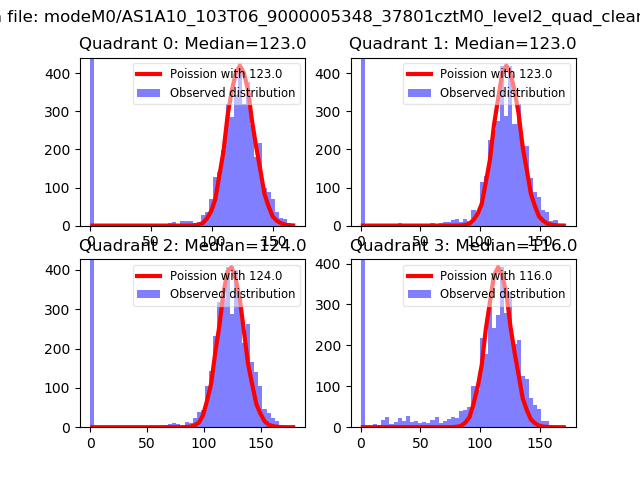
| Comparison with Poisson distribution Blue bars denote a histogram of data divided into 1 sec bins. Red curve is a Poisson curve with rate = median count rate of data. |
 |
 |
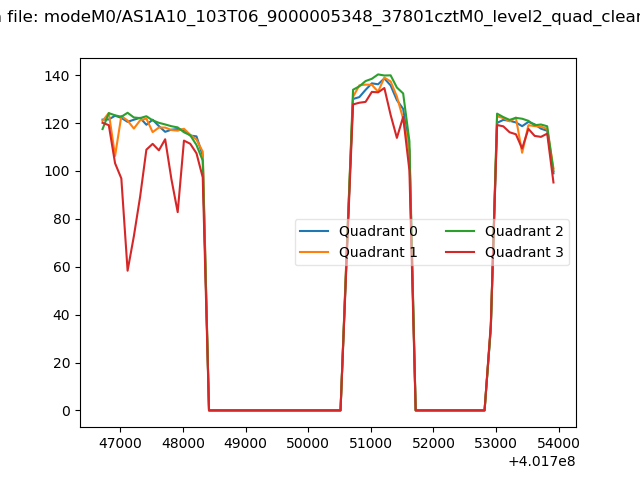
| Quadrant-wise count rates Data is divided into 100 sec bins |
 |
|
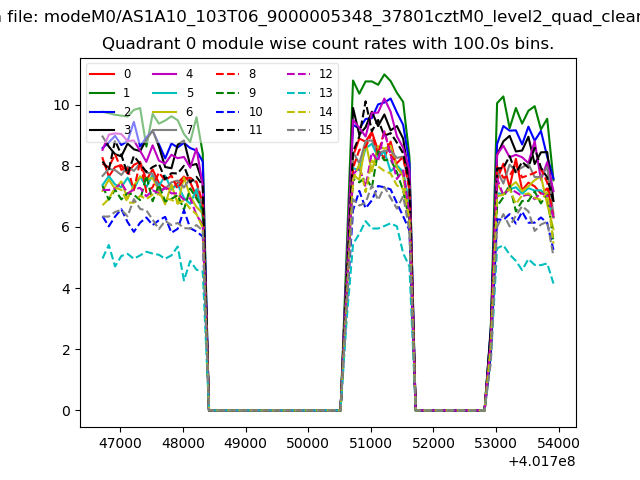
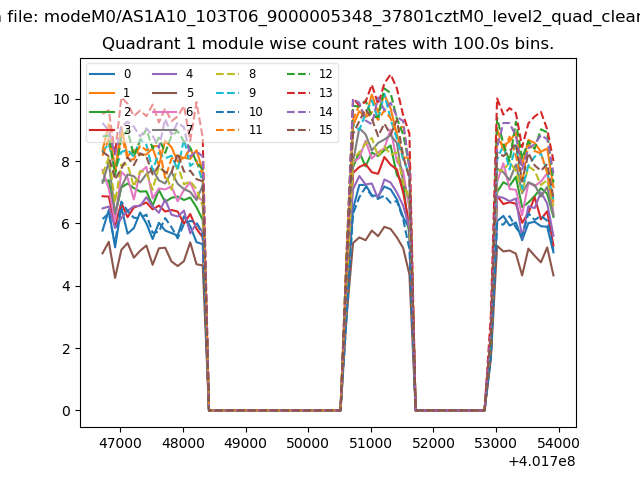
| Module-wise count rates for Quadrant A Data is divided into 100 sec bins |
 |
 |
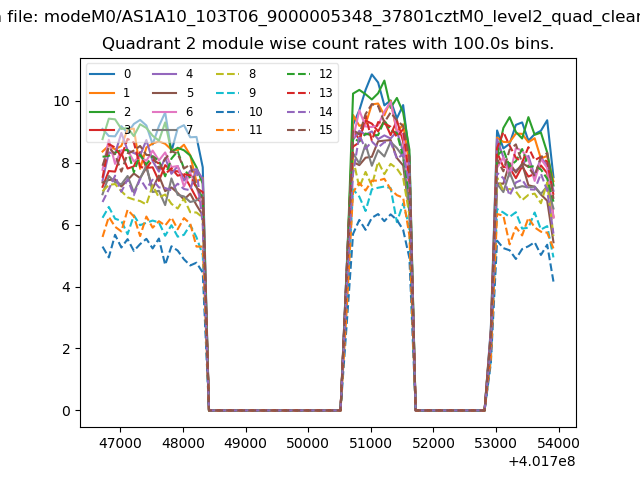
| Module-wise count rates for Quadrant B Data is divided into 100 sec bins |
 |
 |
| Module-wise count rates for Quadrant C Data is divided into 100 sec bins |
 |
 |
| Module-wise count rates for Quadrant D Data is divided into 100 sec bins |
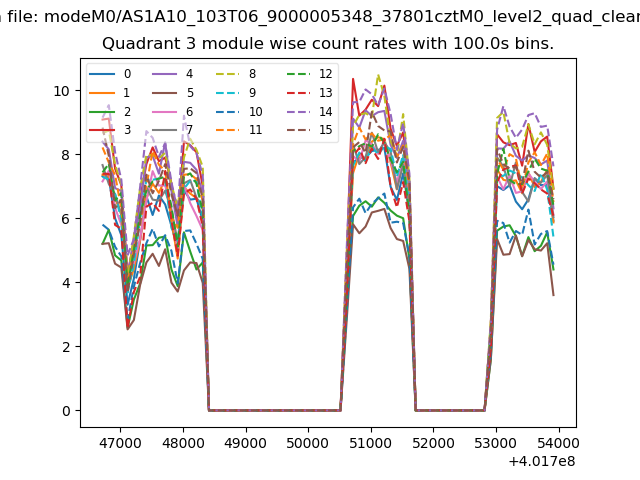 |
 |
| Parameter | Plot |
|---|---|
| CZT HV Monitor | 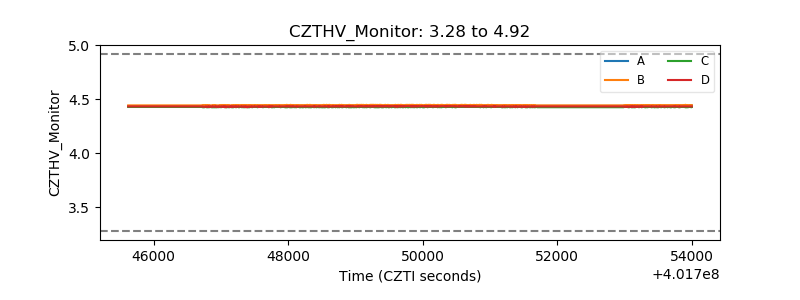 |
| D_VDD | 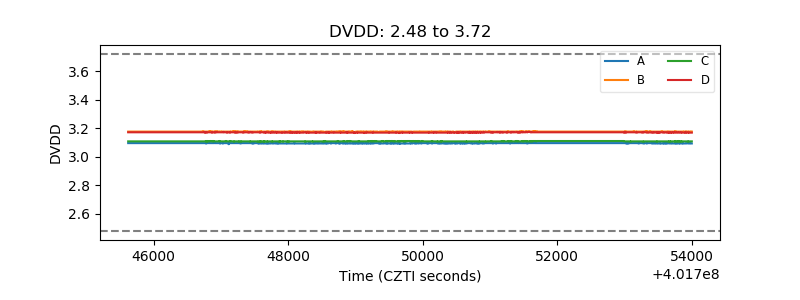 |
| Temperature 1 | 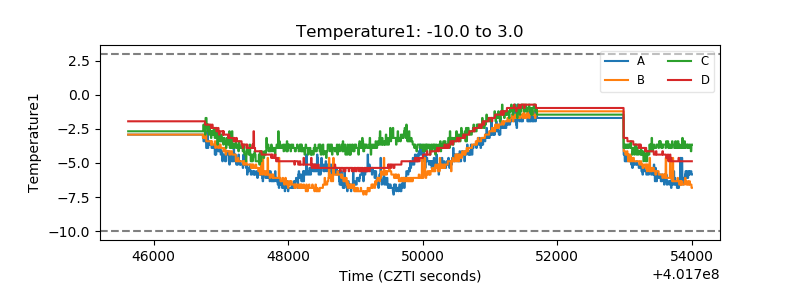 |
| Veto HV Monitor | 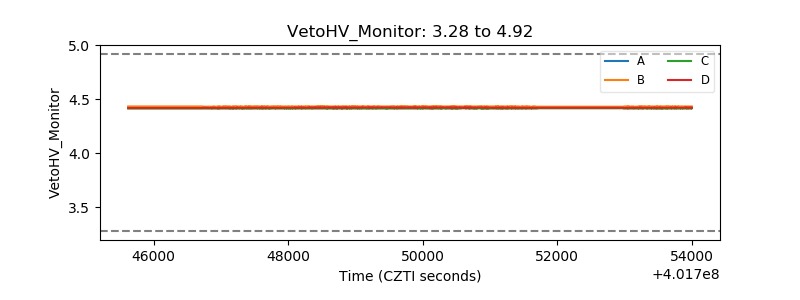 |
| Veto LLD | 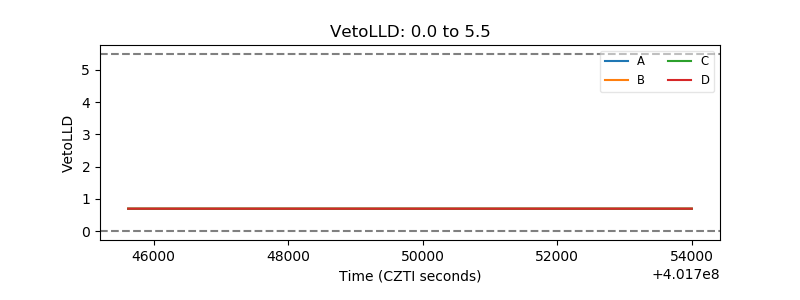 |
| Alpha Counter | 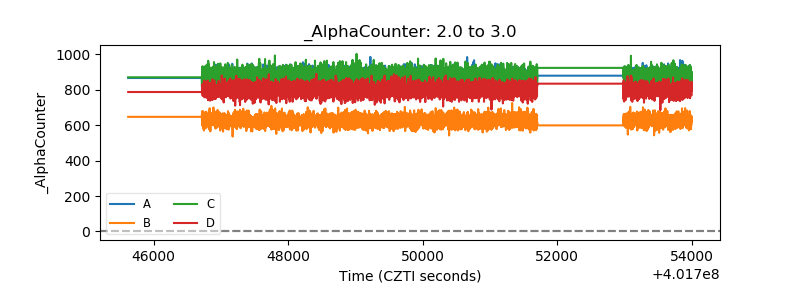 |
| _CPM_Rate | 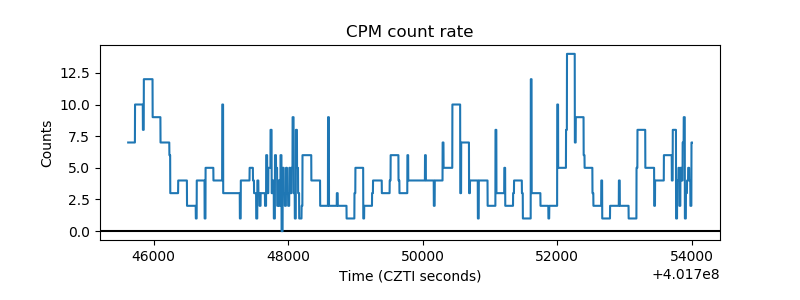 |
| CZT Counter | 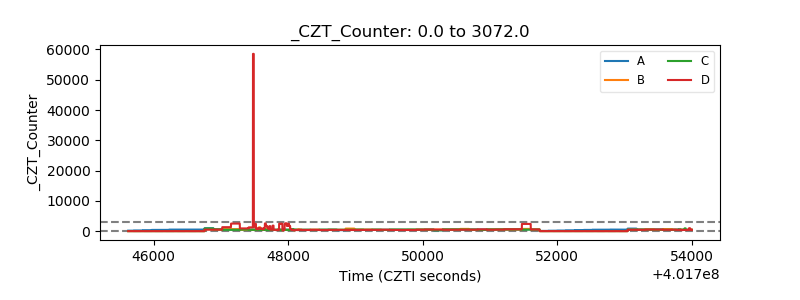 |
| +2.5 Volts monitor | 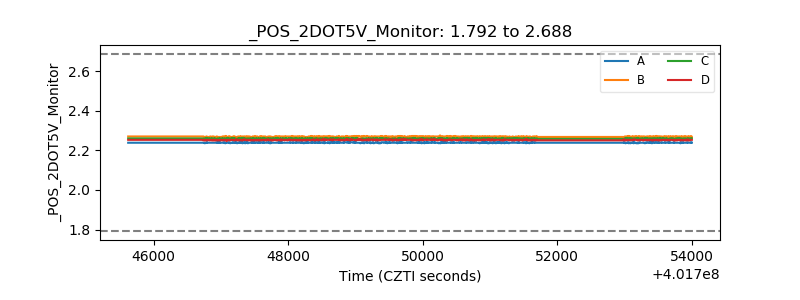 |
| +5 Volts monitor | 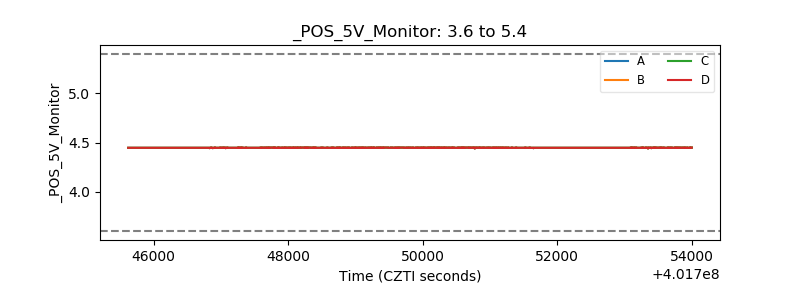 |
| _ROLL_ROT | 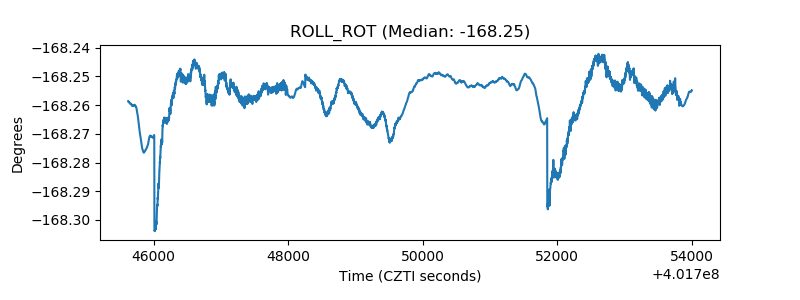 |
| _Roll_DEC | 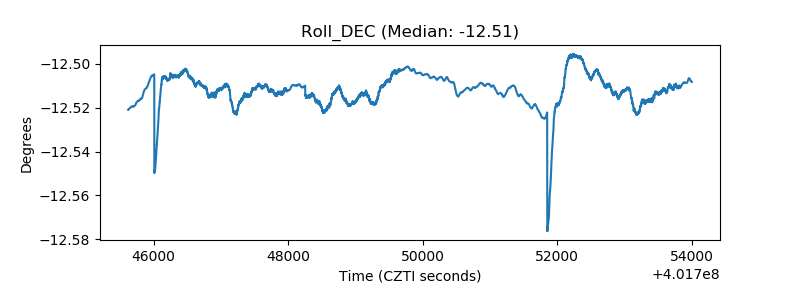 |
| _Roll_RA | 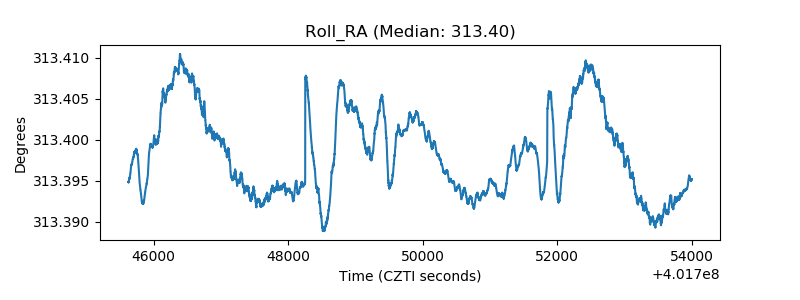 |
| Veto Counter | 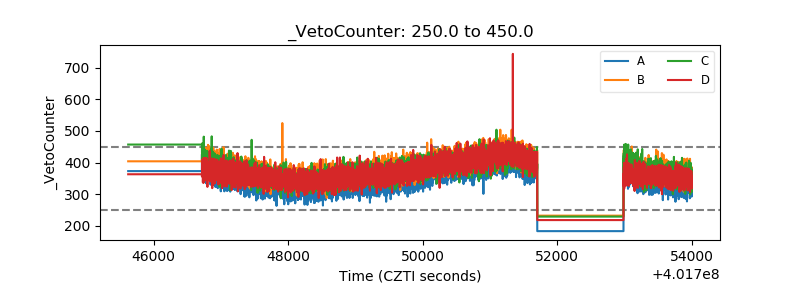 |