| Param | Original file | Final file |
|---|---|---|
| Filename | modeM0/AS1A10_103T06_9000005348_37804cztM0_level2.evt | modeM0/AS1A10_103T06_9000005348_37804cztM0_level2_quad_clean.evt |
| Size (bytes) | 1,851,209,280 | 258,557,760 |
| Size | 1.7 GB | 246.6 MB |
| Events in quadrant A | 12,630,841 | 1,559,720 |
| Events in quadrant B | 13,630,735 | 1,556,146 |
| Events in quadrant C | 12,233,345 | 1,581,486 |
| Events in quadrant D | 15,926,078 | 1,457,466 |
| Mode M9 | |||
|---|---|---|---|
| Quadrant | BADHDUFLAG | Total packets | Discarded packets |
| A | 0 | 72 | 0 |
| B | 0 | 72 | 0 |
| C | 0 | 72 | 0 |
| D | 0 | 73 | 0 |
| Mode M0 | |||
|---|---|---|---|
| Quadrant | BADHDUFLAG | Total packets | Discarded packets |
| A | 0 | 52464 | 7 |
| B | 0 | 56512 | 6 |
| C | 0 | 51126 | 6 |
| D | 0 | 64083 | 6 |
| Mode SS | |||
|---|---|---|---|
| Quadrant | BADHDUFLAG | Total packets | Discarded packets |
| A | 0 | 498 | 0 |
| B | 0 | 498 | 0 |
| C | 0 | 498 | 0 |
| D | 0 | 498 | 0 |
| Quadrant | Total seconds | Saturated seconds | Saturation percentage |
|---|---|---|---|
| A | 24349 | 71 | 0.291593% |
| B | 24349 | 534 | 2.193109% |
| C | 24349 | 97 | 0.398374% |
| D | 24350 | 1216 | 4.993840% |
Noise dominated data is calculated using 1-second bins in cleaned event files. If a bin has >2000 counts, and if more than 50% of those come from <1% of pixels, then it is considered to be noise-dominated and hence unusable.
| Quadrant | # 1 sec bins | Bins with >0 counts | Bins with >2000 counts | High rate bins dominated by noise | Noise dominated (total time) | Noise dominated (detector-on time) | Marked lightcurve |
|---|---|---|---|---|---|---|---|
| A | 32395 | 24354 | 39 | 39 | 0.12% | 0.16% | 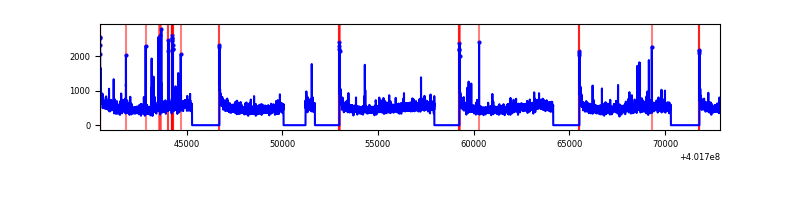 |
| B | 32395 | 24354 | 386 | 386 | 1.19% | 1.58% | 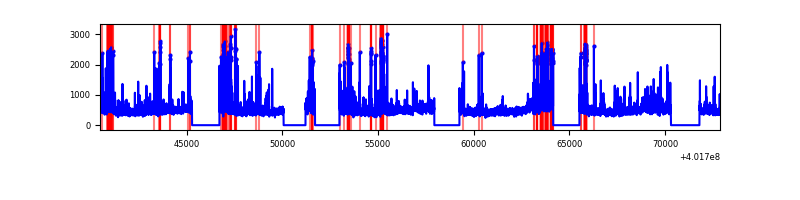 |
| C | 32395 | 24355 | 78 | 78 | 0.24% | 0.32% | 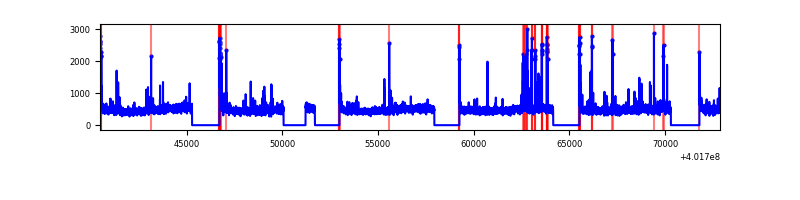 |
| D | 32395 | 24356 | 1138 | 1138 | 3.51% | 4.67% | 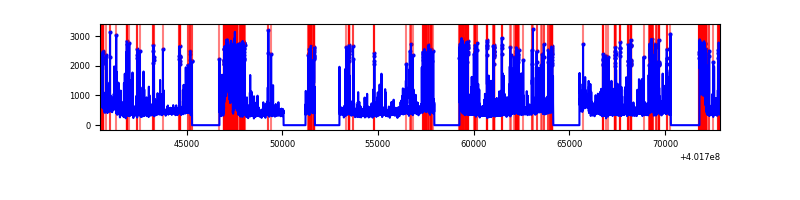 |
Top three noisy pixels from each quadrant. If the there are fewer than three noisy pixels in the level2.evt file, extra rows are filled as -1
| Pixel properties | Quadrant properties | ||||||
|---|---|---|---|---|---|---|---|
| Quadrant | DetID | PixID | Counts | Sigma | Mean | Median | Sigma |
| A | 10 | 83 | 1282537 | 2323.54 | 2760 | 2704 | 550.8 |
| A | 15 | 222 | 401280 | 723.61 | 2760 | 2704 | 550.8 |
| A | 9 | 143 | 164941 | 294.54 | 2760 | 2704 | 550.8 |
| B | 5 | 172 | 1336160 | 2563.32 | 2731 | 2661 | 520.2 |
| B | 0 | 229 | 635112 | 1215.73 | 2731 | 2661 | 520.2 |
| B | 0 | 189 | 274925 | 523.36 | 2731 | 2661 | 520.2 |
| C | 15 | 214 | 1087451 | 1731.71 | 2692 | 2711 | 626.4 |
| C | 0 | 10 | 263548 | 416.41 | 2692 | 2711 | 626.4 |
| C | 0 | 207 | 253234 | 399.94 | 2692 | 2711 | 626.4 |
| D | 13 | 249 | 2511578 | 3860.72 | 2646 | 2567 | 649.9 |
| D | 12 | 227 | 716400 | 1098.4 | 2646 | 2567 | 649.9 |
| D | 1 | 52 | 415901 | 636.01 | 2646 | 2567 | 649.9 |
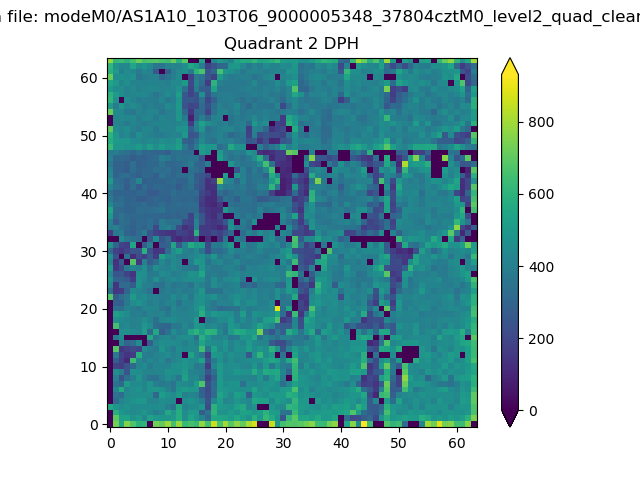
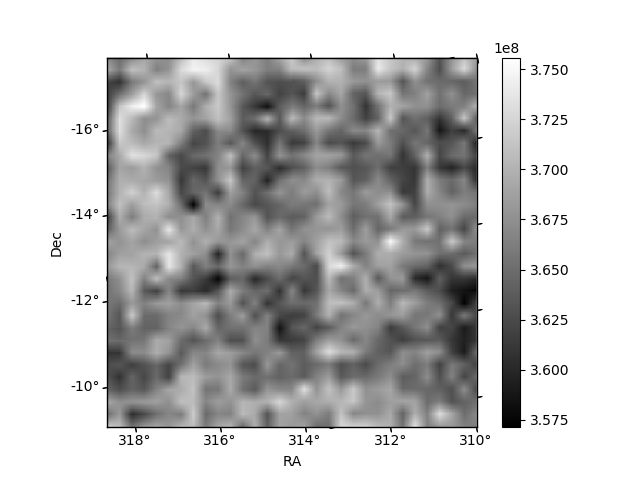
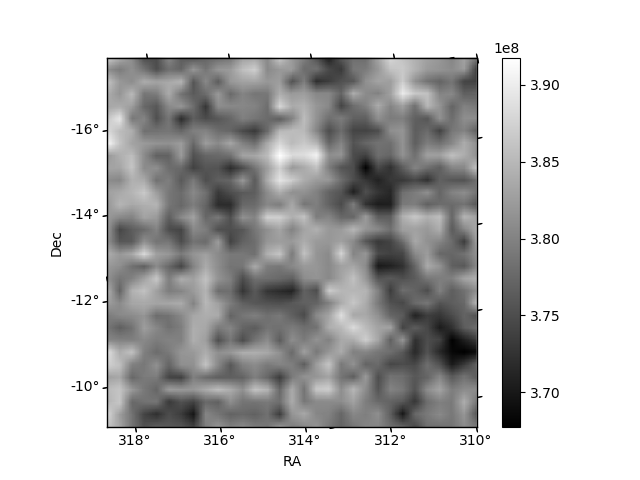
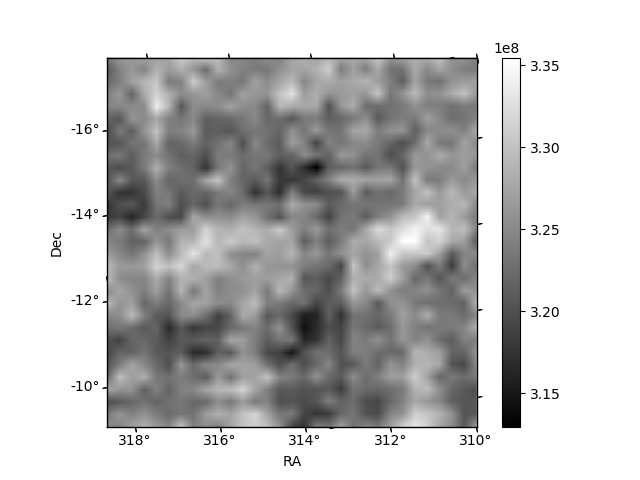
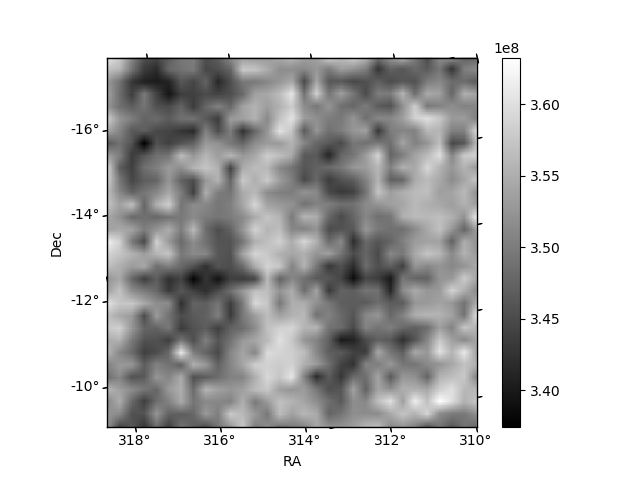
Histogram calculated using DETX and DETY for each event in the final _common_clean file
| Quadrant A | 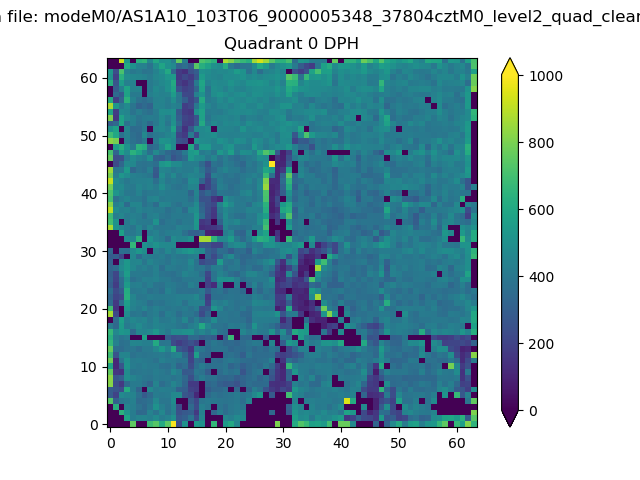 |
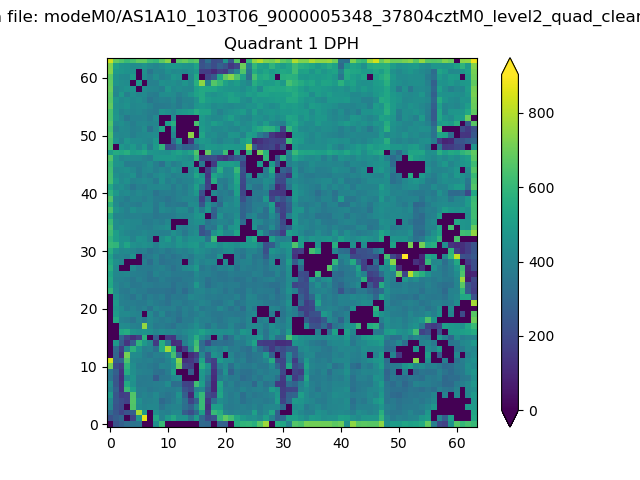 |
Quadrant B |
|---|---|---|---|
| Quadrant D | 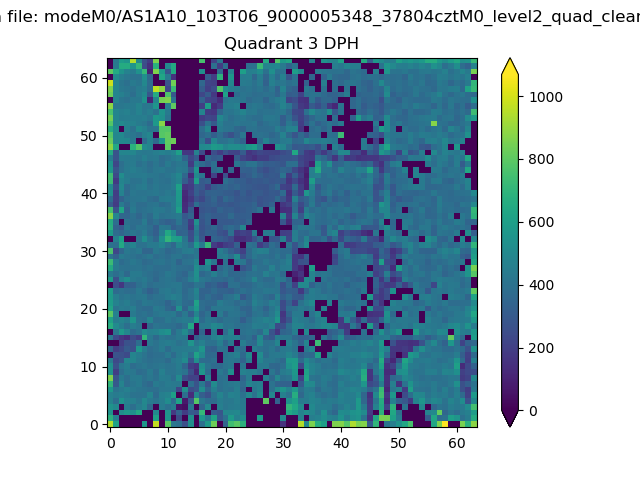 |
 |
Quadrant C |
| Plot type | Count rate plots | Images |
|---|---|---|
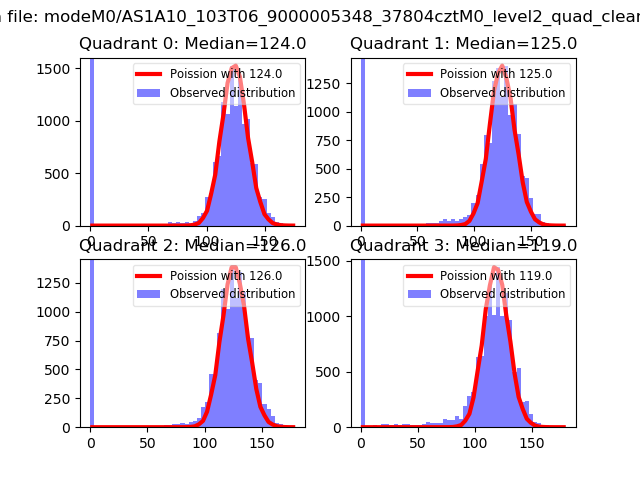
| Comparison with Poisson distribution Blue bars denote a histogram of data divided into 1 sec bins. Red curve is a Poisson curve with rate = median count rate of data. |
 |
 |
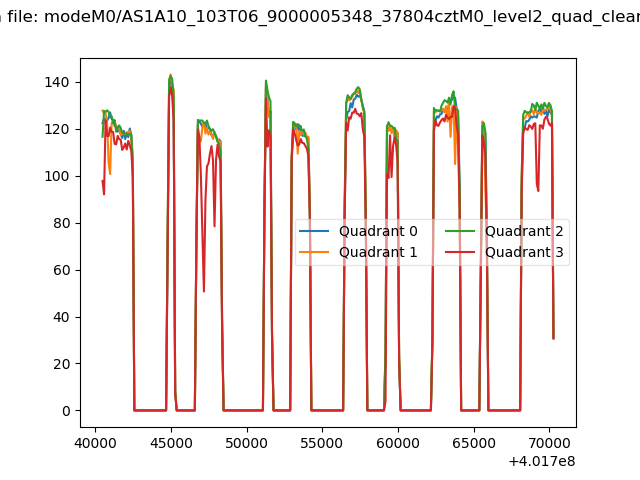
| Quadrant-wise count rates Data is divided into 100 sec bins |
 |
|
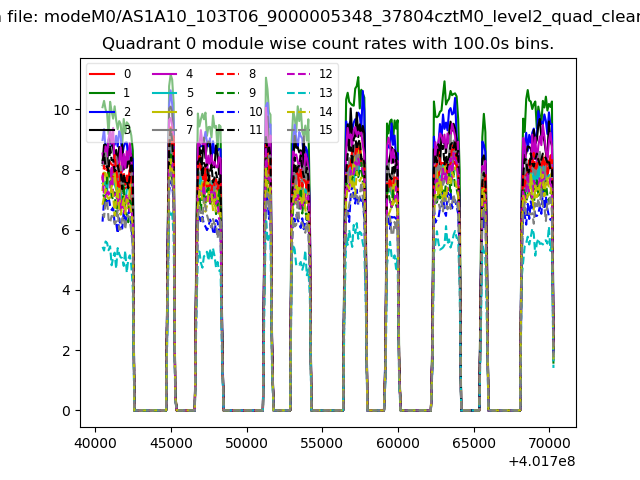
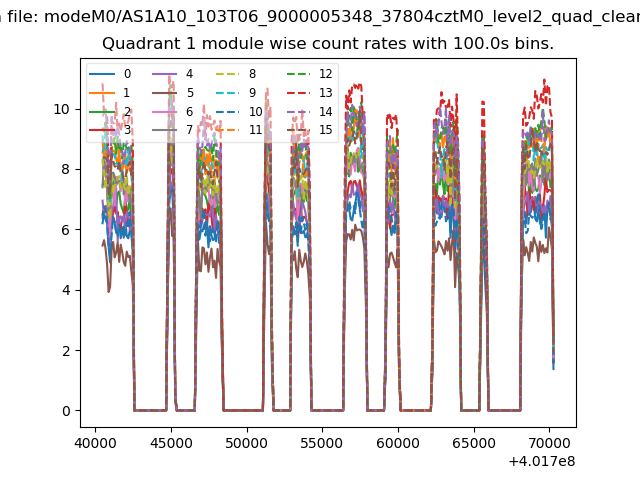
| Module-wise count rates for Quadrant A Data is divided into 100 sec bins |
 |
 |
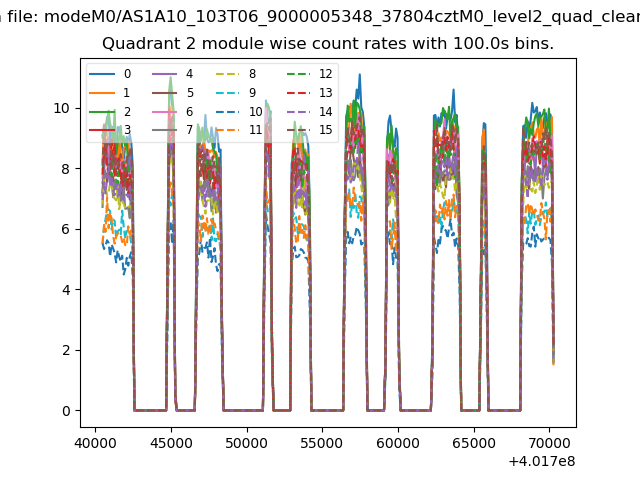
| Module-wise count rates for Quadrant B Data is divided into 100 sec bins |
 |
 |
| Module-wise count rates for Quadrant C Data is divided into 100 sec bins |
 |
 |
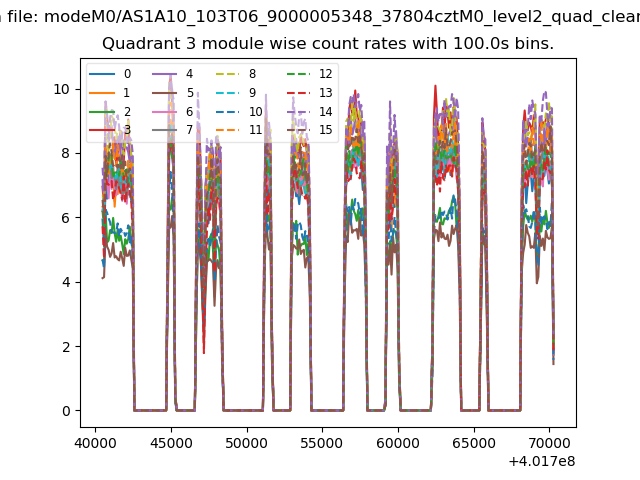
| Module-wise count rates for Quadrant D Data is divided into 100 sec bins |
 |
 |
| Parameter | Plot |
|---|---|
| CZT HV Monitor | 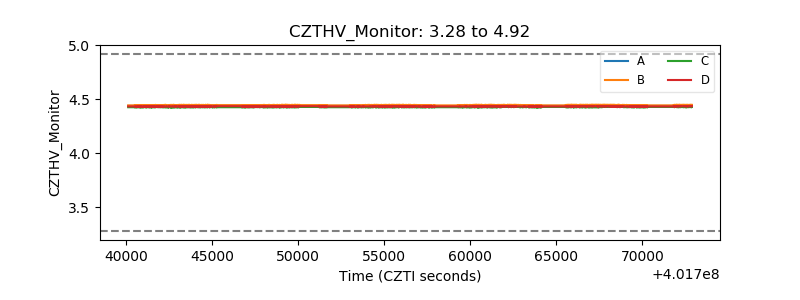 |
| D_VDD | 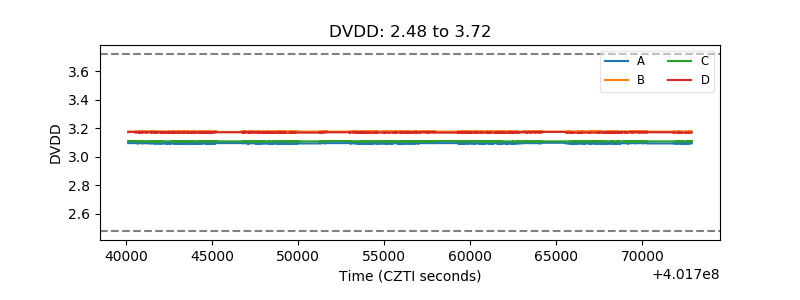 |
| Temperature 1 | 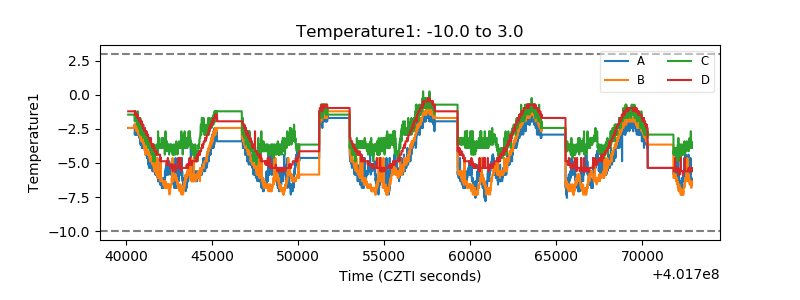 |
| Veto HV Monitor | 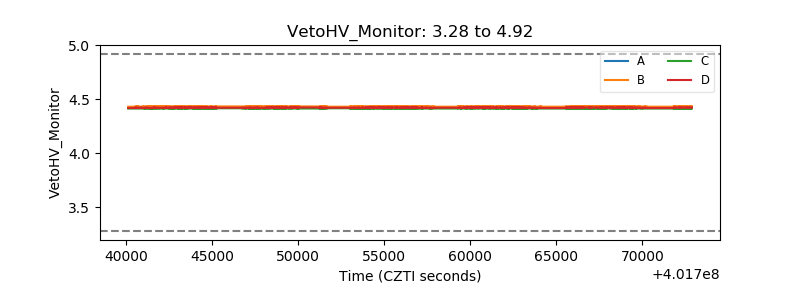 |
| Veto LLD | 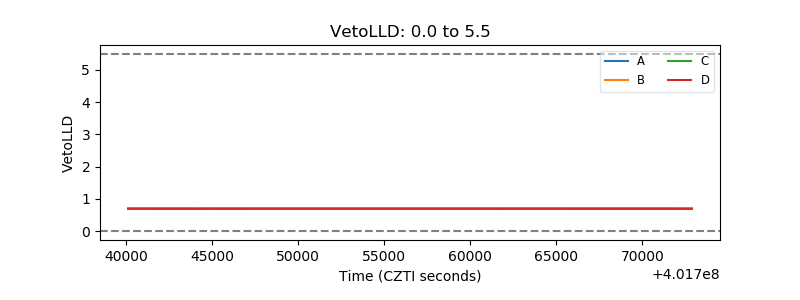 |
| Alpha Counter | 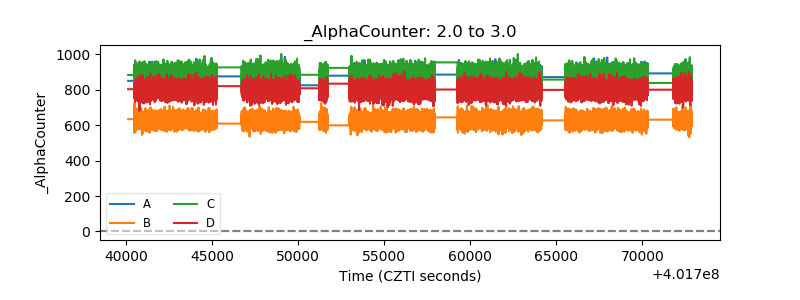 |
| _CPM_Rate | 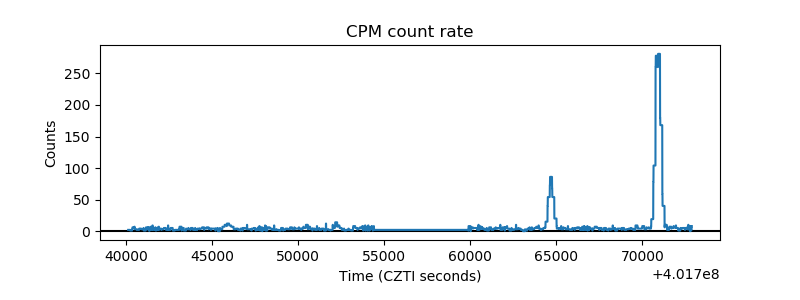 |
| CZT Counter | 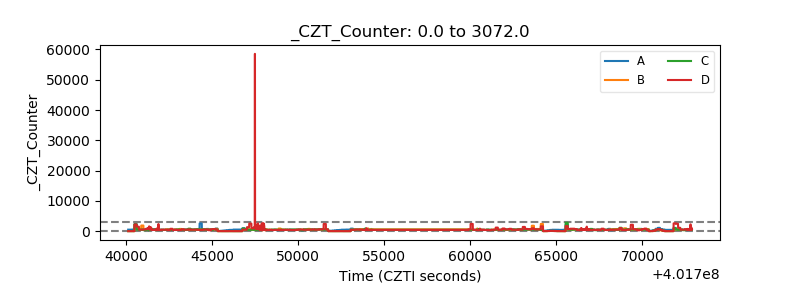 |
| +2.5 Volts monitor |  |
| +5 Volts monitor | 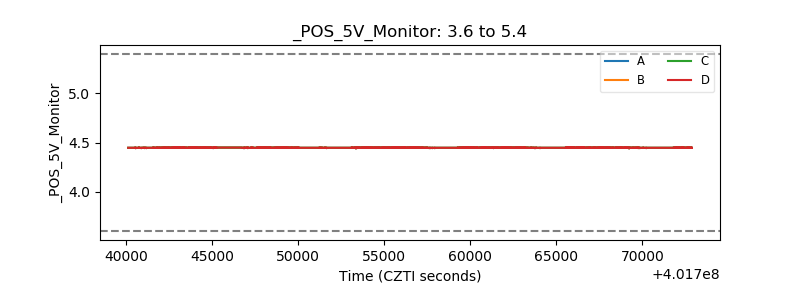 |
| _ROLL_ROT | 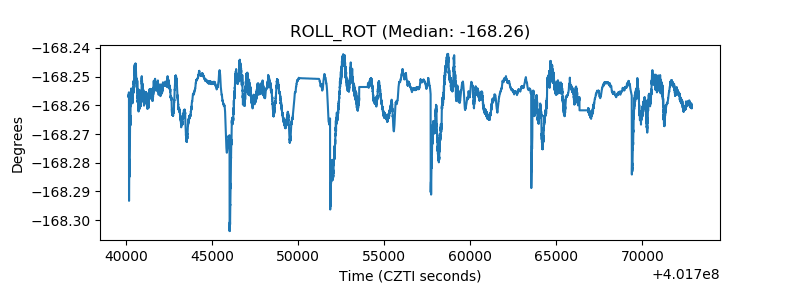 |
| _Roll_DEC | 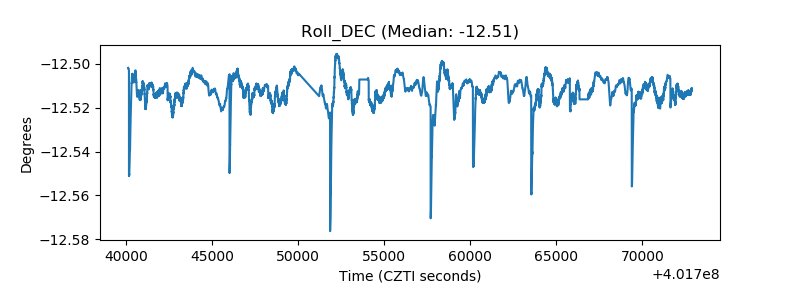 |
| _Roll_RA | 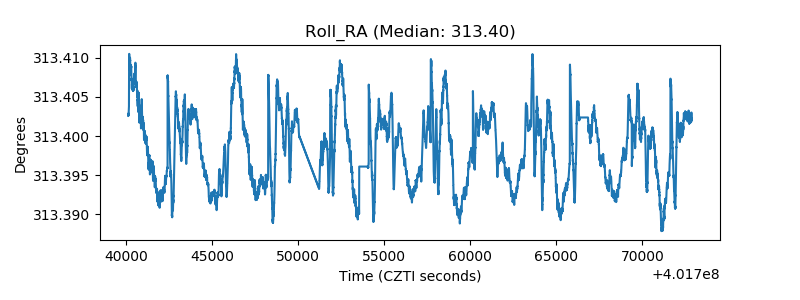 |
| Veto Counter | 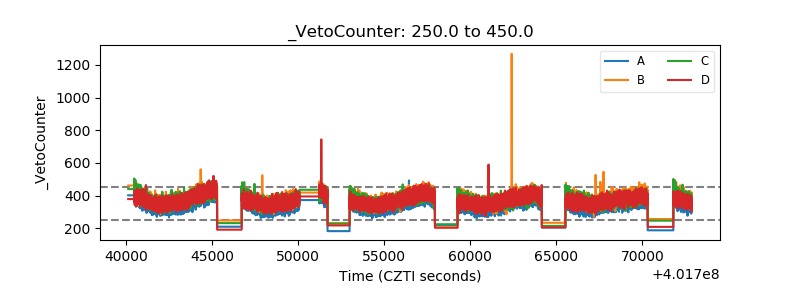 |