| Param | Original file | Final file |
|---|---|---|
| Filename | modeM0/AS1A10_103T06_9000005348_37805cztM0_level2.evt | modeM0/AS1A10_103T06_9000005348_37805cztM0_level2_quad_clean.evt |
| Size (bytes) | 445,754,880 | 50,760,000 |
| Size | 425.1 MB | 48.4 MB |
| Events in quadrant A | 2,850,108 | 298,769 |
| Events in quadrant B | 3,691,964 | 272,804 |
| Events in quadrant C | 2,771,958 | 305,921 |
| Events in quadrant D | 3,814,068 | 276,061 |
| Mode M9 | |||
|---|---|---|---|
| Quadrant | BADHDUFLAG | Total packets | Discarded packets |
| A | 0 | 26 | 0 |
| B | 0 | 26 | 0 |
| C | 0 | 26 | 0 |
| D | 0 | 27 | 0 |
| Mode M0 | |||
|---|---|---|---|
| Quadrant | BADHDUFLAG | Total packets | Discarded packets |
| A | 0 | 11650 | 3 |
| B | 0 | 14551 | 2 |
| C | 0 | 11455 | 2 |
| D | 0 | 15082 | 2 |
| Mode SS | |||
|---|---|---|---|
| Quadrant | BADHDUFLAG | Total packets | Discarded packets |
| A | 0 | 112 | 0 |
| B | 0 | 112 | 0 |
| C | 0 | 112 | 0 |
| D | 0 | 112 | 0 |
| Quadrant | Total seconds | Saturated seconds | Saturation percentage |
|---|---|---|---|
| A | 5466 | 13 | 0.237834% |
| B | 5466 | 394 | 7.208196% |
| C | 5466 | 16 | 0.292719% |
| D | 5466 | 442 | 8.086352% |
Noise dominated data is calculated using 1-second bins in cleaned event files. If a bin has >2000 counts, and if more than 50% of those come from <1% of pixels, then it is considered to be noise-dominated and hence unusable.
| Quadrant | # 1 sec bins | Bins with >0 counts | Bins with >2000 counts | High rate bins dominated by noise | Noise dominated (total time) | Noise dominated (detector-on time) | Marked lightcurve |
|---|---|---|---|---|---|---|---|
| A | 7080 | 5467 | 5 | 5 | 0.07% | 0.09% | 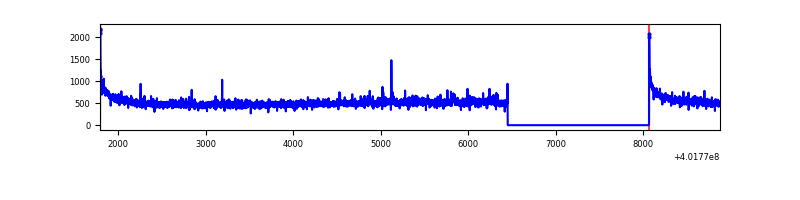 |
| B | 7080 | 5467 | 360 | 360 | 5.08% | 6.58% | 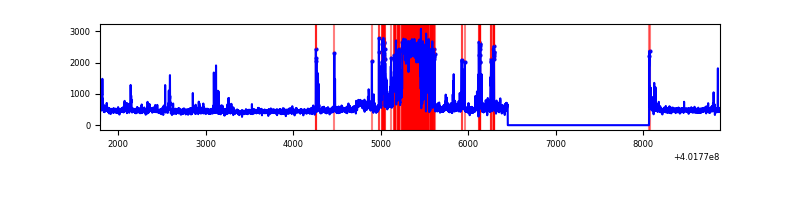 |
| C | 7080 | 5467 | 8 | 8 | 0.11% | 0.15% | 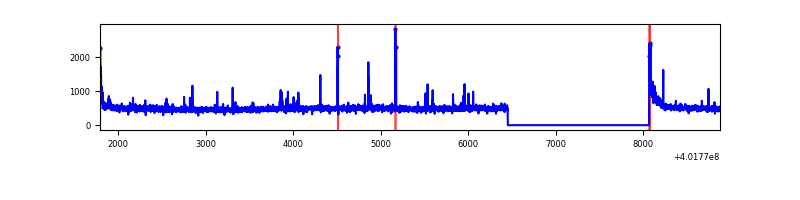 |
| D | 7080 | 5467 | 442 | 442 | 6.24% | 8.08% | 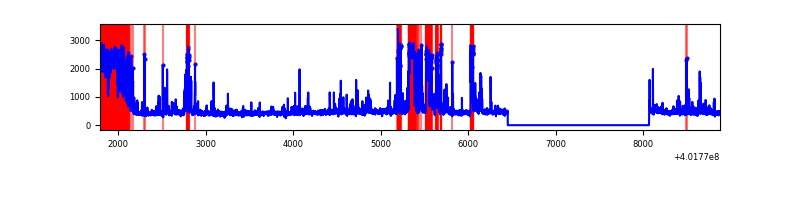 |
Top three noisy pixels from each quadrant. If the there are fewer than three noisy pixels in the level2.evt file, extra rows are filled as -1
| Pixel properties | Quadrant properties | ||||||
|---|---|---|---|---|---|---|---|
| Quadrant | DetID | PixID | Counts | Sigma | Mean | Median | Sigma |
| A | 10 | 83 | 339302 | 2674.3 | 626 | 613 | 126.6 |
| A | 15 | 222 | 56120 | 438.29 | 626 | 613 | 126.6 |
| A | 12 | 189 | 14509 | 109.72 | 626 | 613 | 126.6 |
| B | 0 | 229 | 1018573 | 8793.73 | 600 | 585 | 115.8 |
| B | 5 | 172 | 99222 | 852.06 | 600 | 585 | 115.8 |
| B | 0 | 189 | 61394 | 525.29 | 600 | 585 | 115.8 |
| C | 15 | 214 | 249152 | 1749.44 | 610 | 615 | 142.1 |
| C | 0 | 10 | 90462 | 632.43 | 610 | 615 | 142.1 |
| C | 0 | 207 | 30312 | 209.04 | 610 | 615 | 142.1 |
| D | 12 | 227 | 719739 | 4949.42 | 589 | 571 | 145.3 |
| D | 13 | 249 | 446173 | 3066.7 | 589 | 571 | 145.3 |
| D | 10 | 199 | 115353 | 789.95 | 589 | 571 | 145.3 |
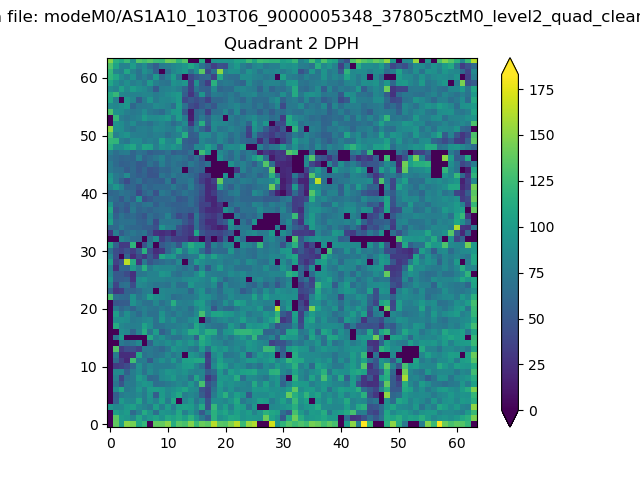
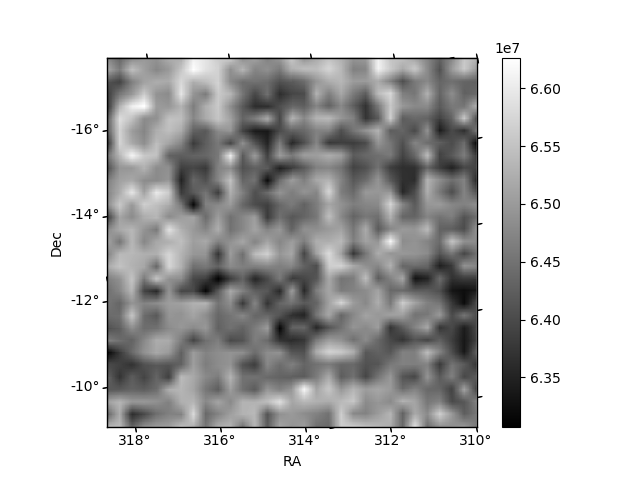
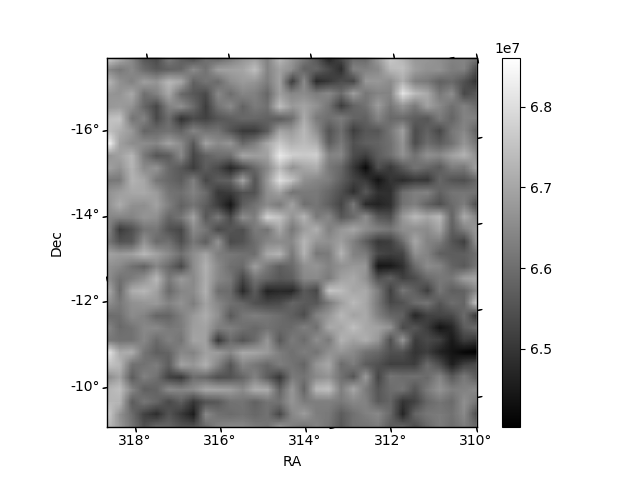
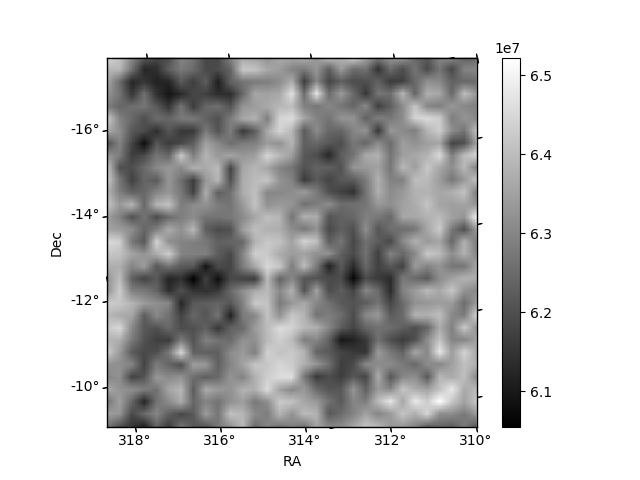
Histogram calculated using DETX and DETY for each event in the final _common_clean file
| Quadrant A |  |
 |
Quadrant B |
|---|---|---|---|
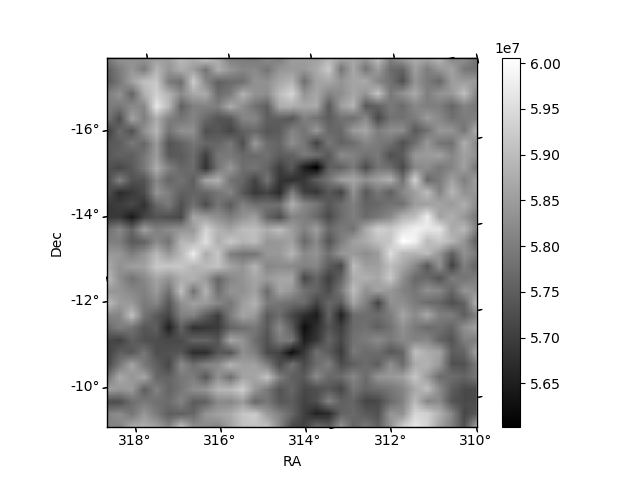
| Quadrant D | 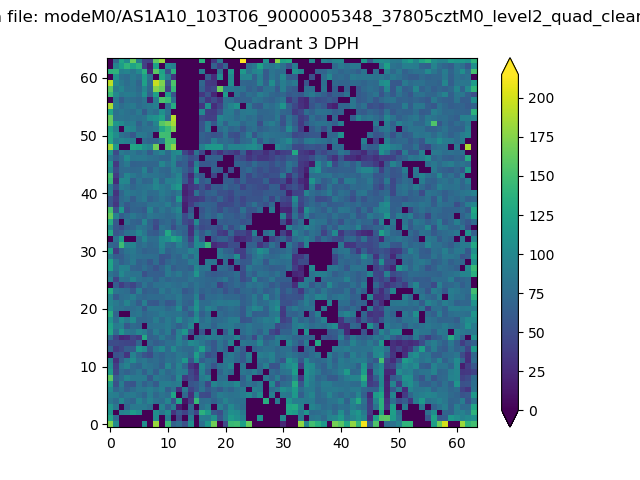 |
 |
Quadrant C |
| Plot type | Count rate plots | Images |
|---|---|---|
| Comparison with Poisson distribution Blue bars denote a histogram of data divided into 1 sec bins. Red curve is a Poisson curve with rate = median count rate of data. |
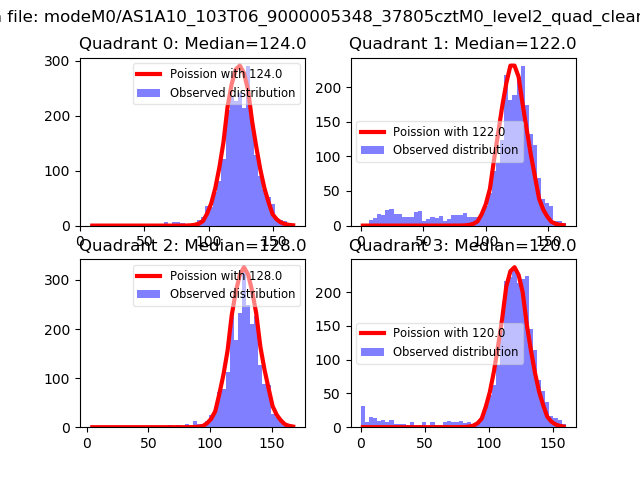 |
 |
| Quadrant-wise count rates Data is divided into 100 sec bins |
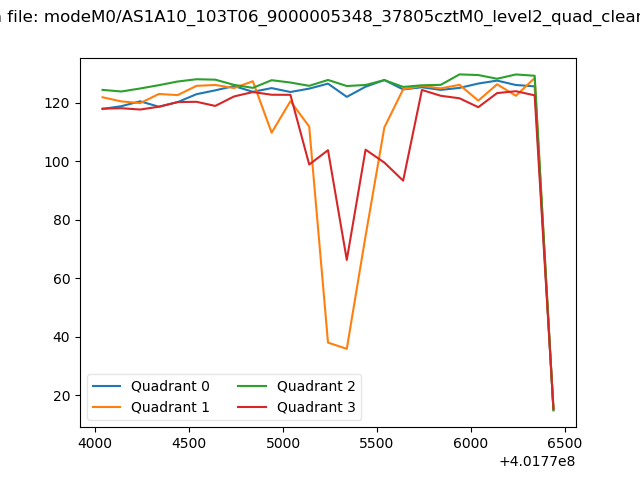 |
|
| Module-wise count rates for Quadrant A Data is divided into 100 sec bins |
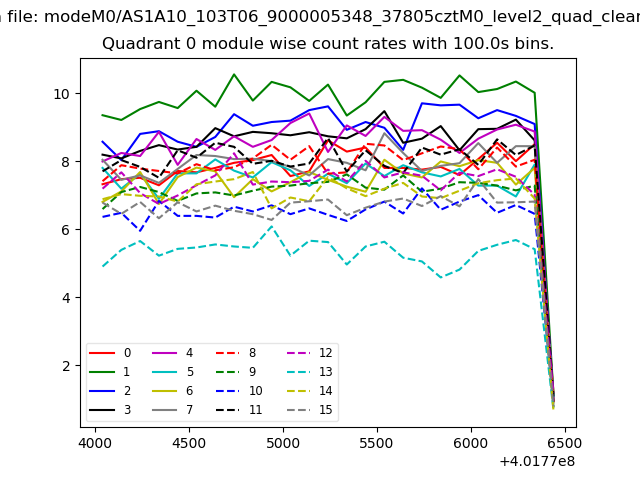 |
 |
| Module-wise count rates for Quadrant B Data is divided into 100 sec bins |
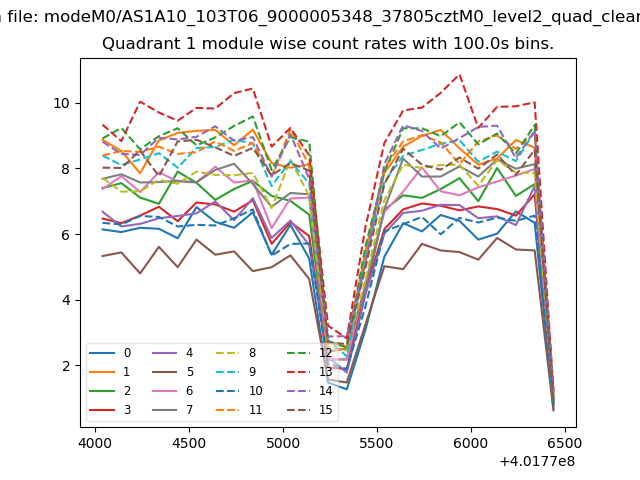 |
 |
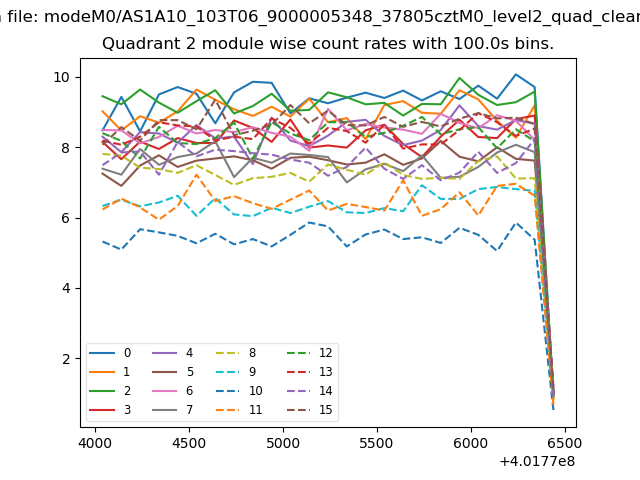
| Module-wise count rates for Quadrant C Data is divided into 100 sec bins |
 |
 |
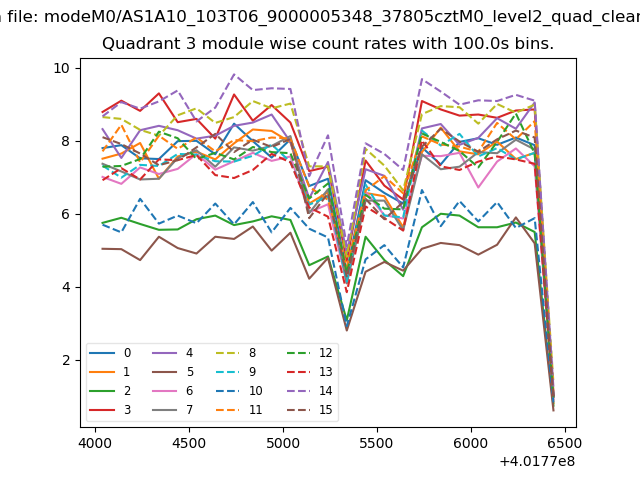
| Module-wise count rates for Quadrant D Data is divided into 100 sec bins |
 |
 |
| Parameter | Plot |
|---|---|
| CZT HV Monitor | 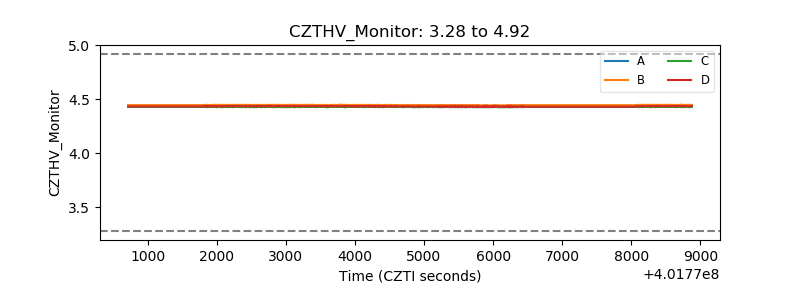 |
| D_VDD | 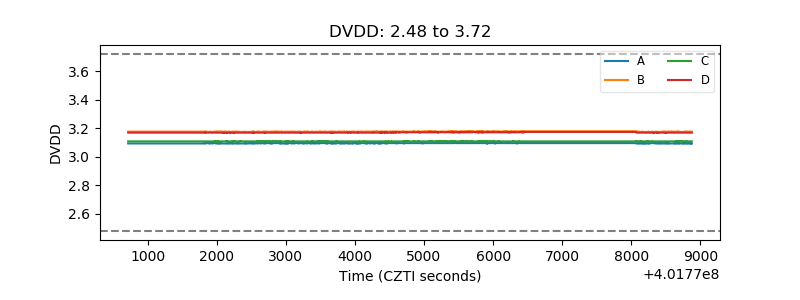 |
| Temperature 1 | 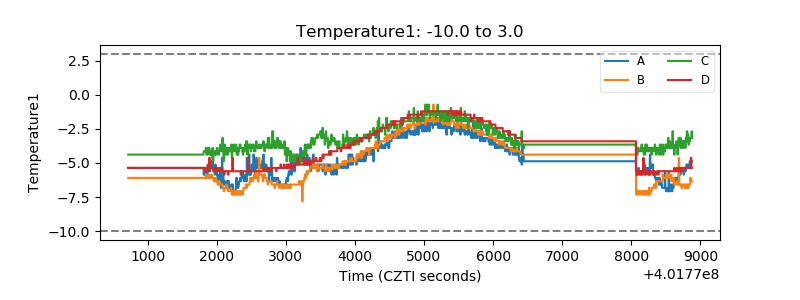 |
| Veto HV Monitor | 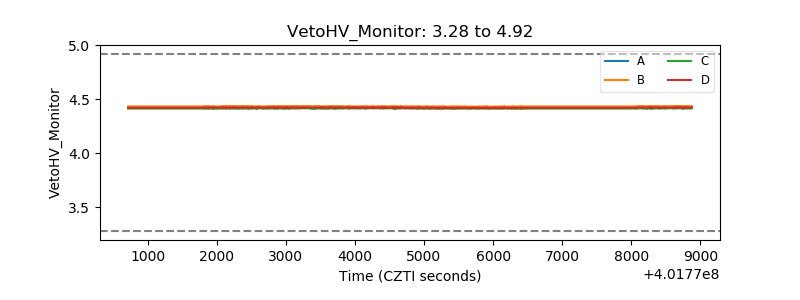 |
| Veto LLD | 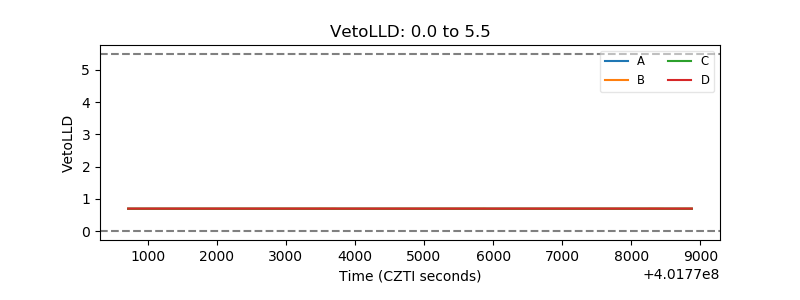 |
| Alpha Counter | 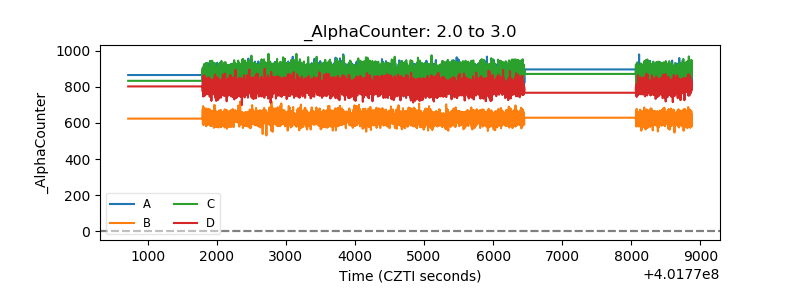 |
| _CPM_Rate | 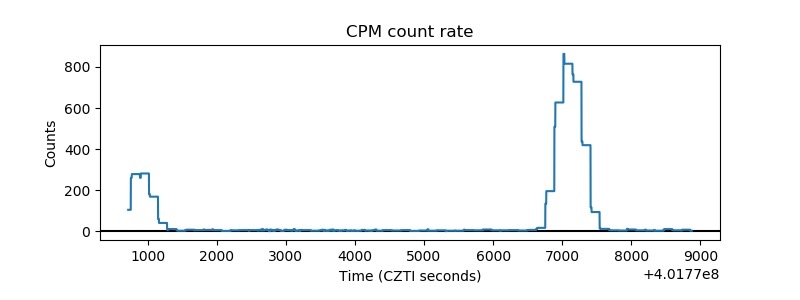 |
| CZT Counter | 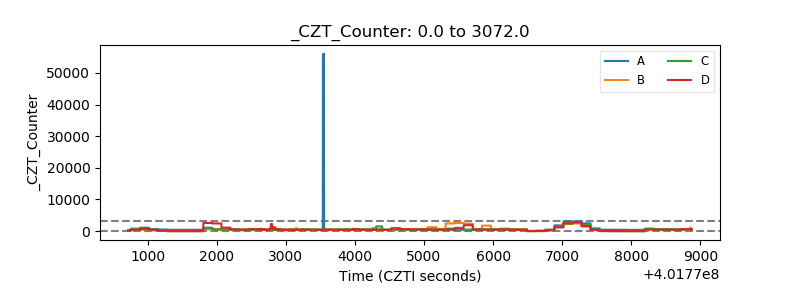 |
| +2.5 Volts monitor | 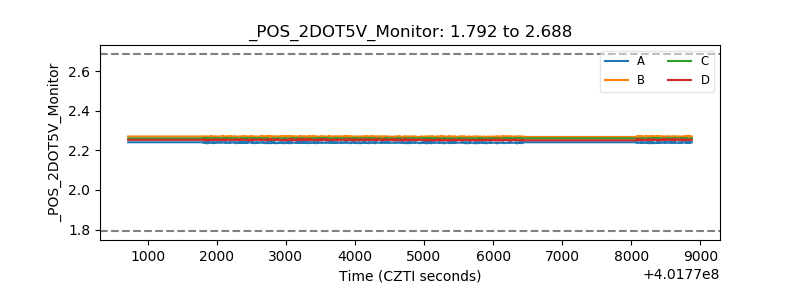 |
| +5 Volts monitor | 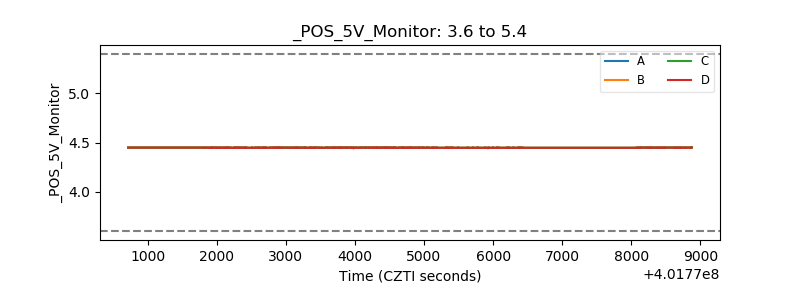 |
| _ROLL_ROT | 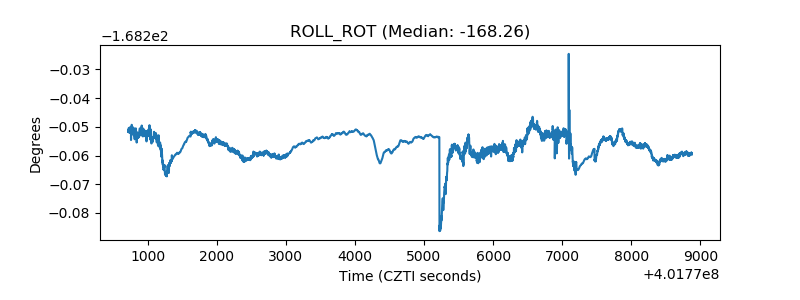 |
| _Roll_DEC | 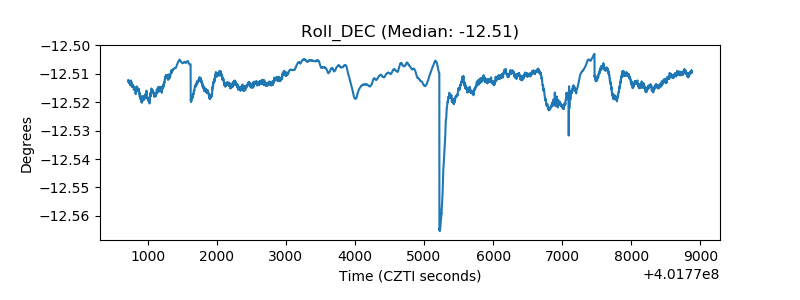 |
| _Roll_RA | 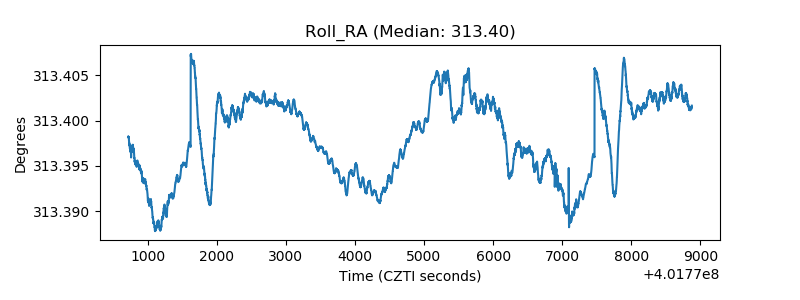 |
| Veto Counter | 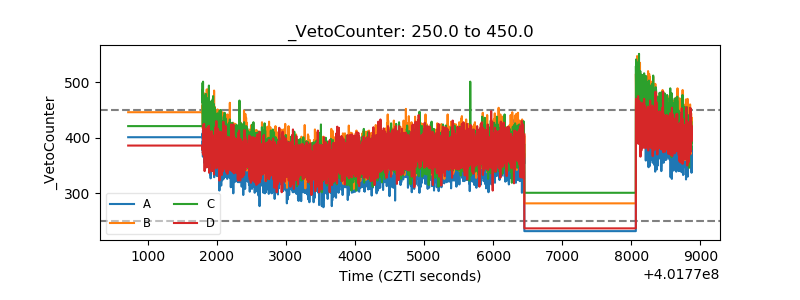 |