| Param | Original file | Final file |
|---|---|---|
| Filename | modeM0/AS1A10_103T06_9000005348_37808cztM0_level2.evt | modeM0/AS1A10_103T06_9000005348_37808cztM0_level2_quad_clean.evt |
| Size (bytes) | 433,359,360 | 63,815,040 |
| Size | 413.3 MB | 60.9 MB |
| Events in quadrant A | 2,947,754 | 391,195 |
| Events in quadrant B | 4,212,688 | 390,560 |
| Events in quadrant C | 2,827,745 | 400,998 |
| Events in quadrant D | 2,781,233 | 383,105 |
| Mode M9 | |||
|---|---|---|---|
| Quadrant | BADHDUFLAG | Total packets | Discarded packets |
| A | 0 | 33 | 0 |
| B | 0 | 33 | 0 |
| C | 0 | 33 | 0 |
| D | 0 | 34 | 0 |
| Mode M0 | |||
|---|---|---|---|
| Quadrant | BADHDUFLAG | Total packets | Discarded packets |
| A | 0 | 11862 | 3 |
| B | 0 | 16059 | 2 |
| C | 0 | 11439 | 2 |
| D | 0 | 11522 | 2 |
| Mode SS | |||
|---|---|---|---|
| Quadrant | BADHDUFLAG | Total packets | Discarded packets |
| A | 0 | 108 | 0 |
| B | 0 | 108 | 0 |
| C | 0 | 108 | 0 |
| D | 0 | 108 | 0 |
| Quadrant | Total seconds | Saturated seconds | Saturation percentage |
|---|---|---|---|
| A | 5223 | 18 | 0.344630% |
| B | 5223 | 189 | 3.618610% |
| C | 5223 | 20 | 0.382922% |
| D | 5223 | 27 | 0.516944% |
Noise dominated data is calculated using 1-second bins in cleaned event files. If a bin has >2000 counts, and if more than 50% of those come from <1% of pixels, then it is considered to be noise-dominated and hence unusable.
| Quadrant | # 1 sec bins | Bins with >0 counts | Bins with >2000 counts | High rate bins dominated by noise | Noise dominated (total time) | Noise dominated (detector-on time) | Marked lightcurve |
|---|---|---|---|---|---|---|---|
| A | 7106 | 5224 | 8 | 8 | 0.11% | 0.15% | 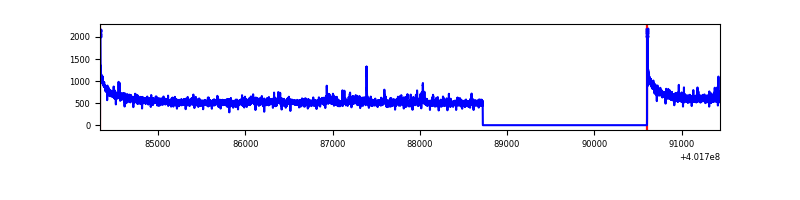 |
| B | 7106 | 5224 | 139 | 139 | 1.96% | 2.66% | 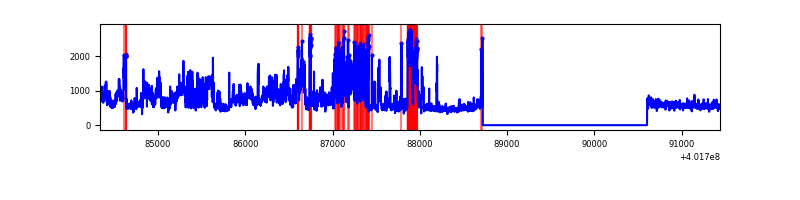 |
| C | 7106 | 5224 | 12 | 12 | 0.17% | 0.23% | 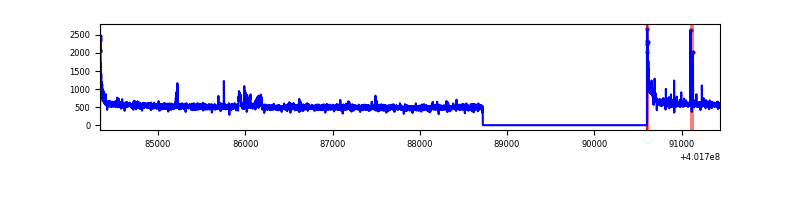 |
| D | 7106 | 5224 | 23 | 23 | 0.32% | 0.44% | 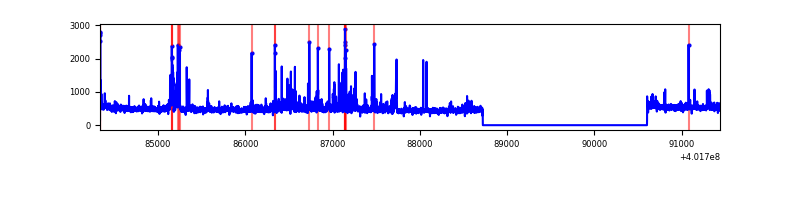 |
Top three noisy pixels from each quadrant. If the there are fewer than three noisy pixels in the level2.evt file, extra rows are filled as -1
| Pixel properties | Quadrant properties | ||||||
|---|---|---|---|---|---|---|---|
| Quadrant | DetID | PixID | Counts | Sigma | Mean | Median | Sigma |
| A | 10 | 83 | 324860 | 2495.43 | 648 | 638 | 129.9 |
| A | 15 | 222 | 57286 | 436.0 | 648 | 638 | 129.9 |
| A | 13 | 248 | 29342 | 220.93 | 648 | 638 | 129.9 |
| B | 10 | 246 | 1409635 | 11573.61 | 641 | 626 | 121.7 |
| B | 0 | 189 | 99102 | 808.88 | 641 | 626 | 121.7 |
| B | 5 | 172 | 56244 | 456.85 | 641 | 626 | 121.7 |
| C | 15 | 214 | 241312 | 1662.71 | 627 | 632 | 144.8 |
| C | 0 | 10 | 72754 | 498.25 | 627 | 632 | 144.8 |
| C | 0 | 207 | 41034 | 279.11 | 627 | 632 | 144.8 |
| D | 10 | 199 | 143867 | 929.29 | 630 | 615 | 154.2 |
| D | 5 | 70 | 78879 | 507.7 | 630 | 615 | 154.2 |
| D | 2 | 249 | 35676 | 227.44 | 630 | 615 | 154.2 |
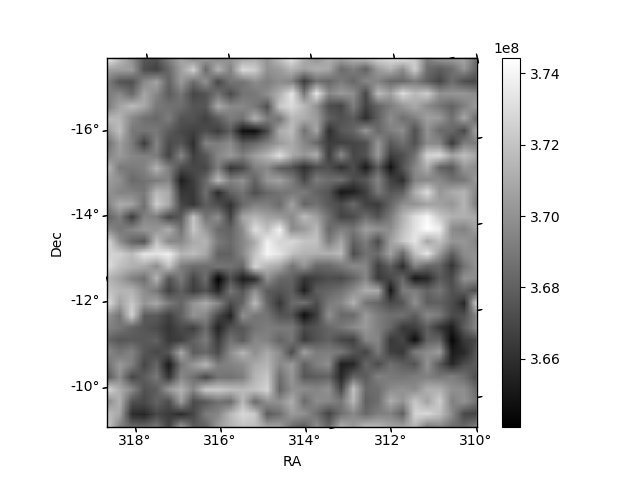
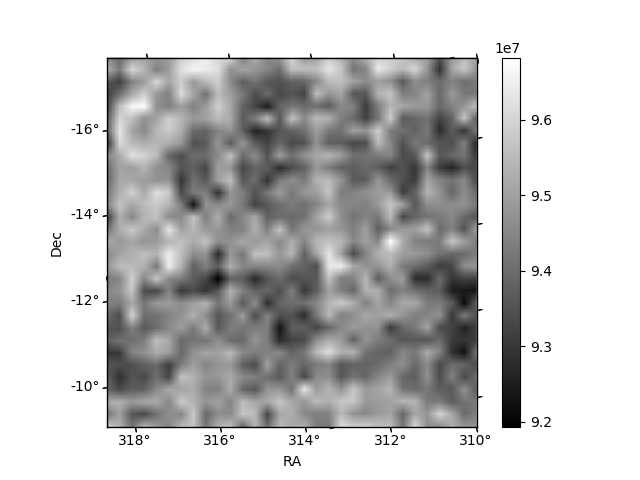
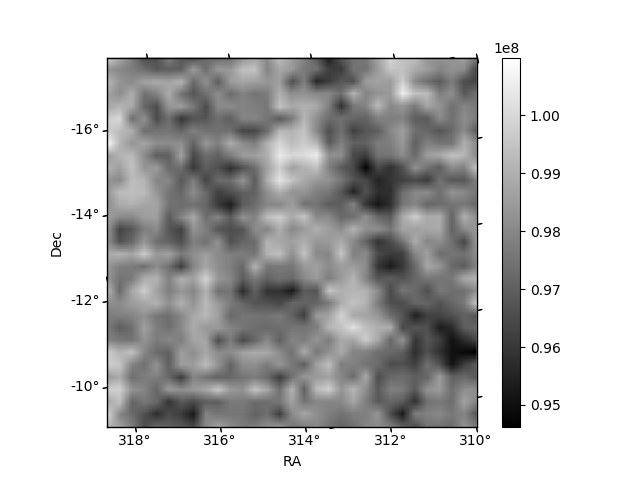
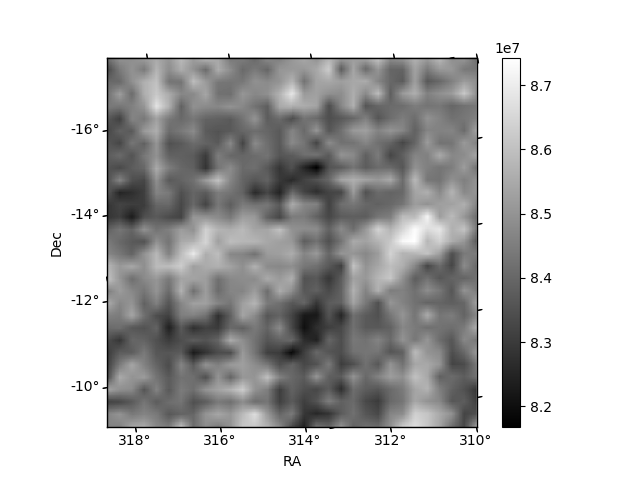
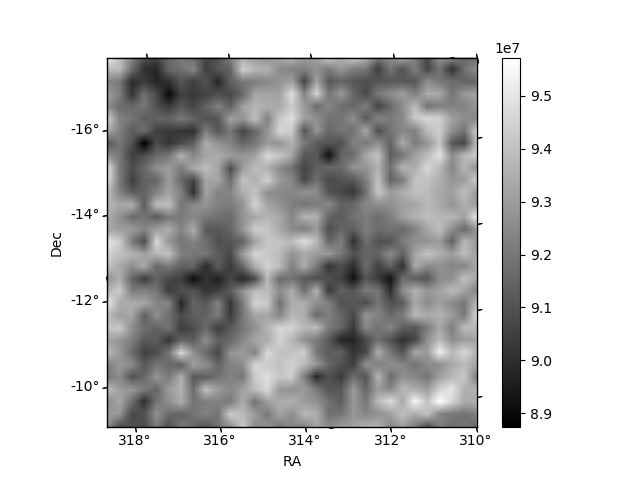
Histogram calculated using DETX and DETY for each event in the final _common_clean file
| Quadrant A | 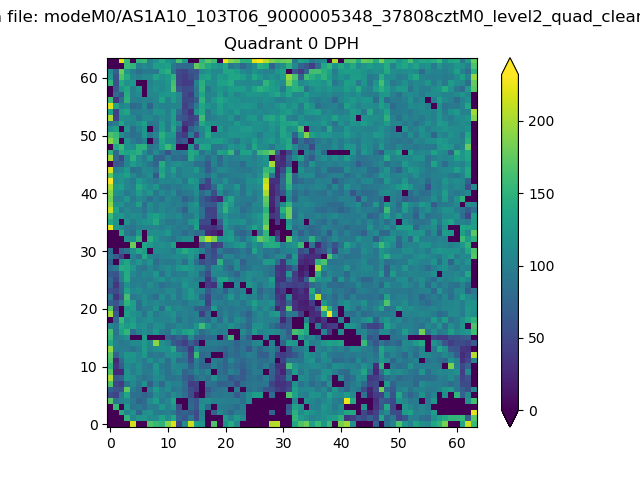 |
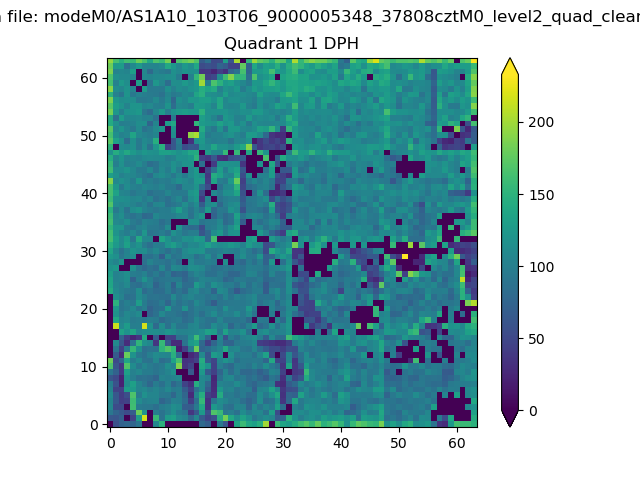 |
Quadrant B |
|---|---|---|---|
| Quadrant D | 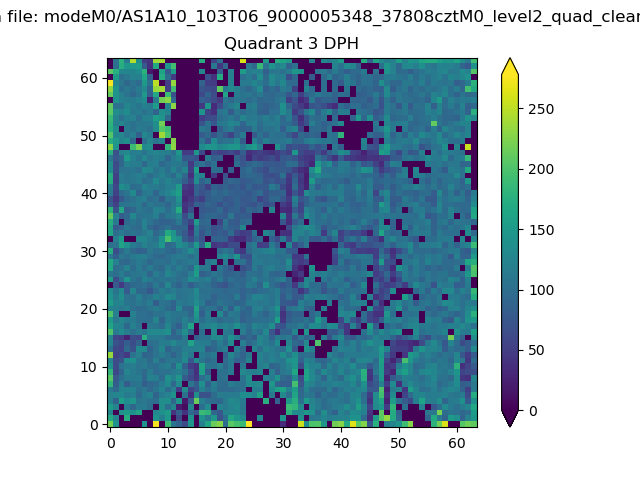 |
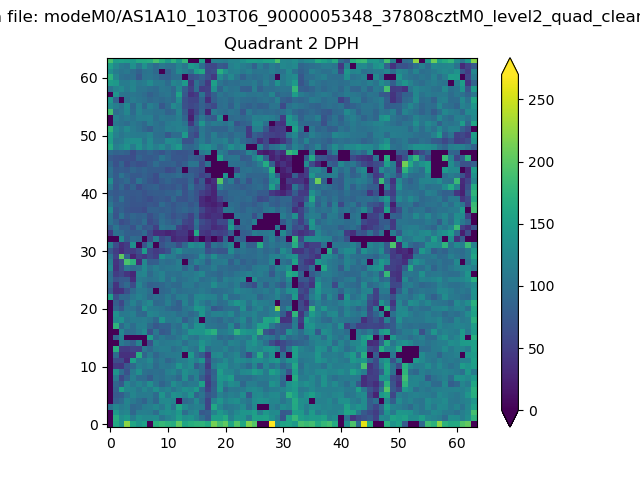 |
Quadrant C |
| Plot type | Count rate plots | Images |
|---|---|---|
| Comparison with Poisson distribution Blue bars denote a histogram of data divided into 1 sec bins. Red curve is a Poisson curve with rate = median count rate of data. |
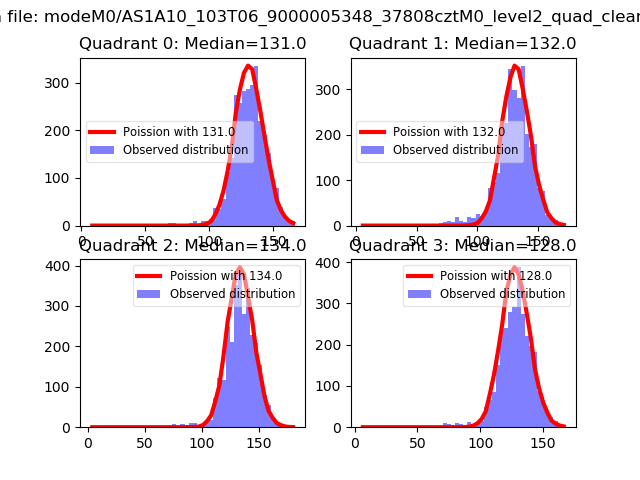 |
 |
| Quadrant-wise count rates Data is divided into 100 sec bins |
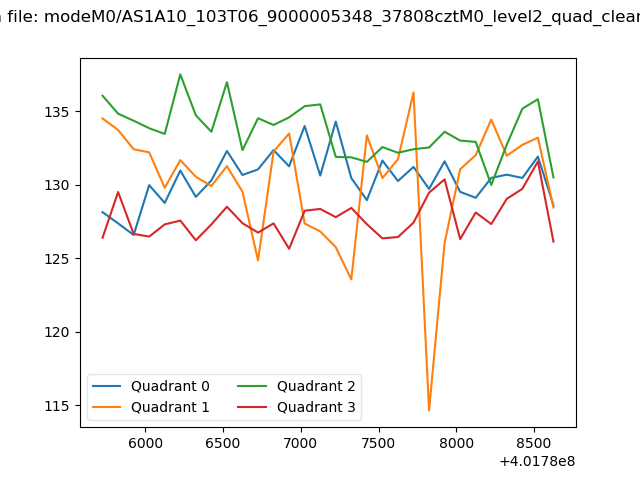 |
|
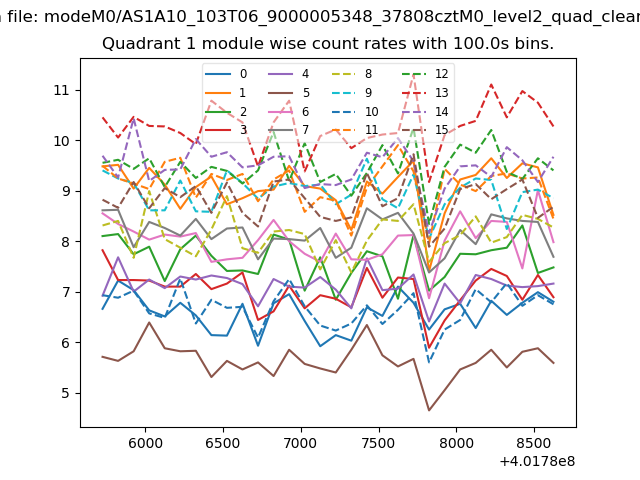
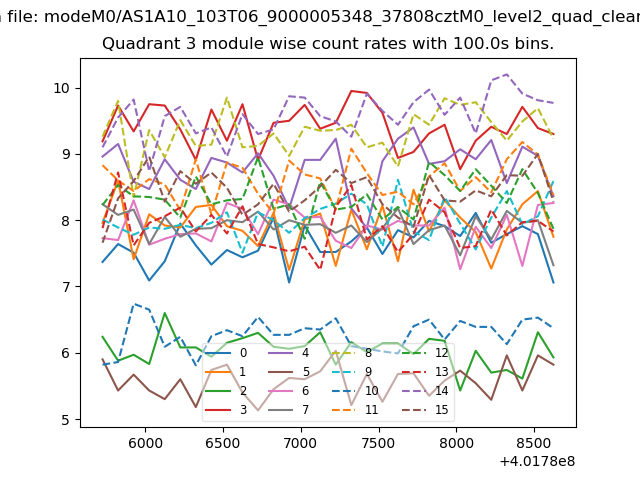
| Module-wise count rates for Quadrant A Data is divided into 100 sec bins |
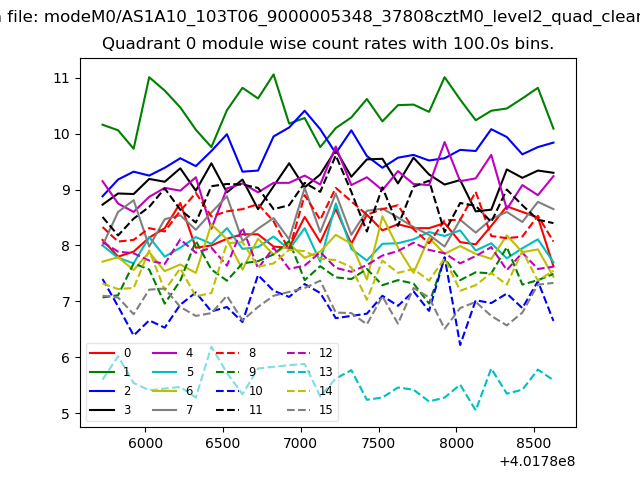 |
 |
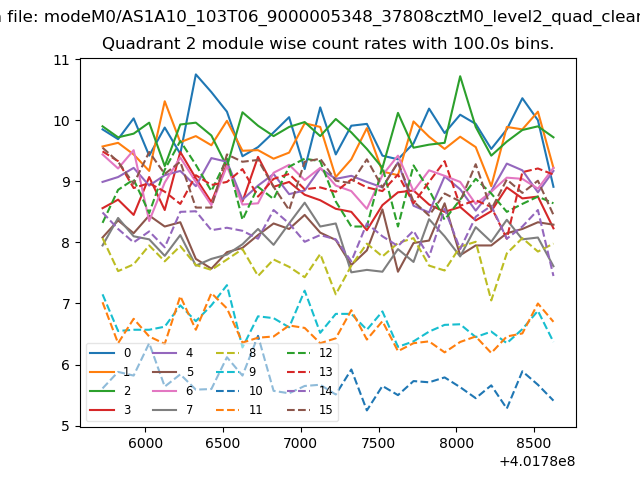
| Module-wise count rates for Quadrant B Data is divided into 100 sec bins |
 |
 |
| Module-wise count rates for Quadrant C Data is divided into 100 sec bins |
 |
 |
| Module-wise count rates for Quadrant D Data is divided into 100 sec bins |
 |
 |
| Parameter | Plot |
|---|---|
| CZT HV Monitor | 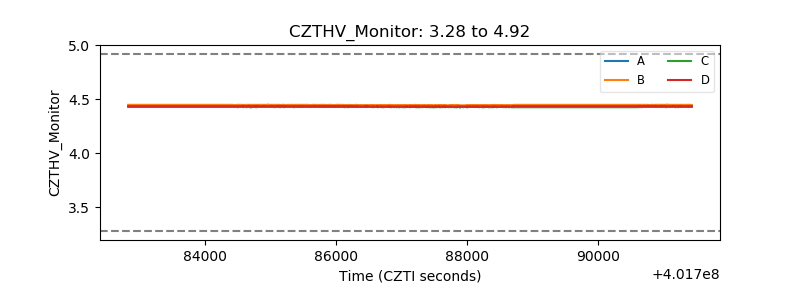 |
| D_VDD | 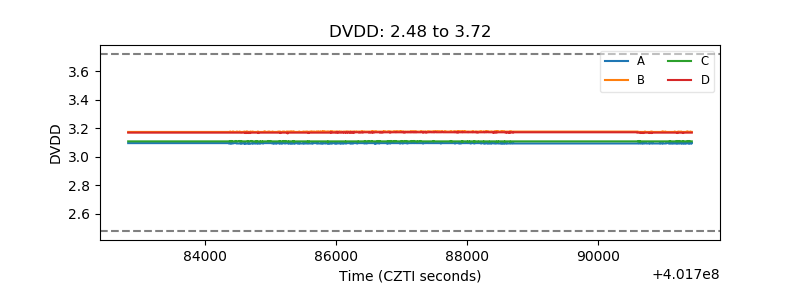 |
| Temperature 1 | 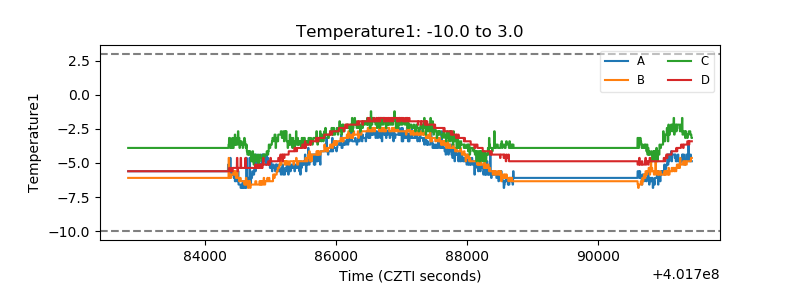 |
| Veto HV Monitor | 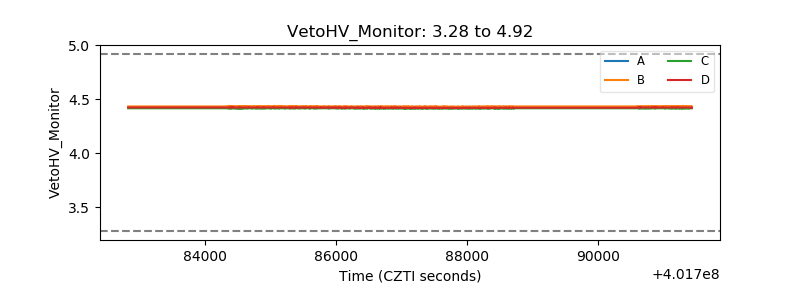 |
| Veto LLD | 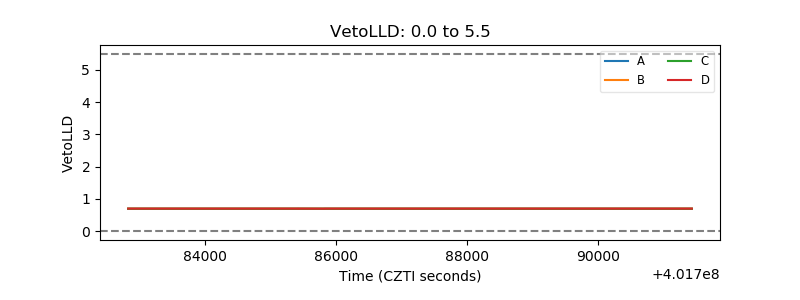 |
| Alpha Counter | 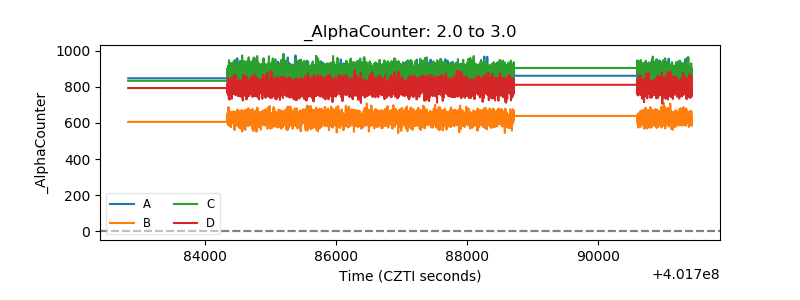 |
| _CPM_Rate | 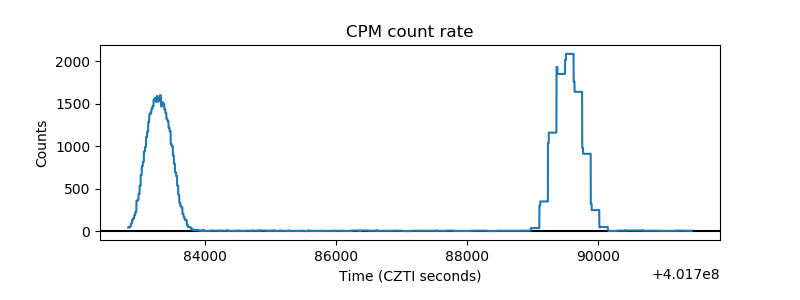 |
| CZT Counter | 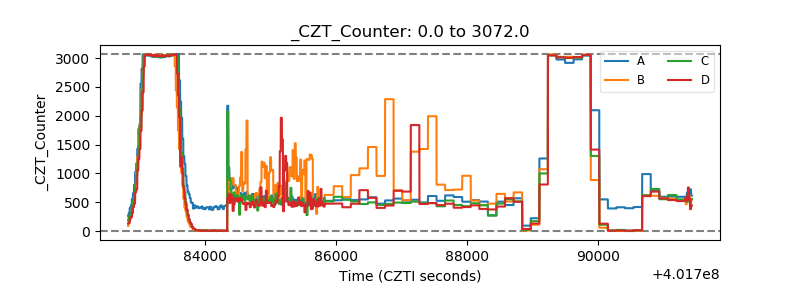 |
| +2.5 Volts monitor | 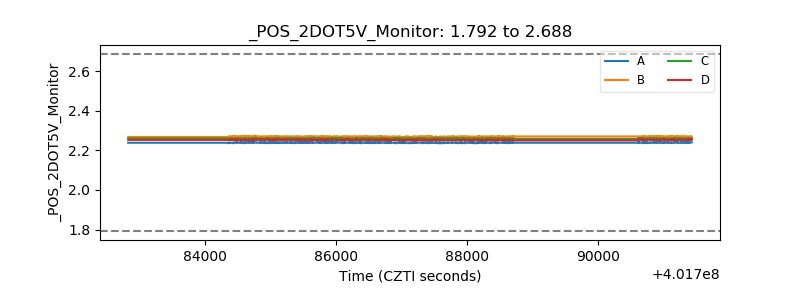 |
| +5 Volts monitor | 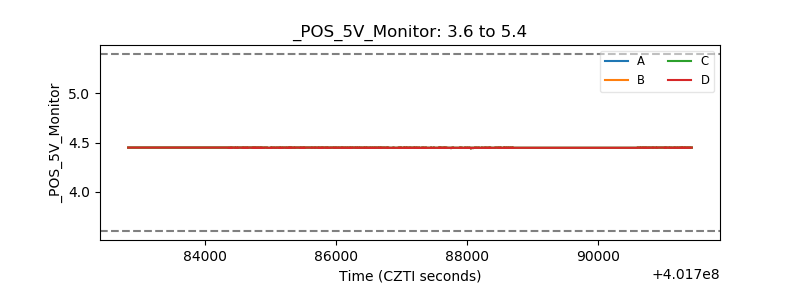 |
| _ROLL_ROT | 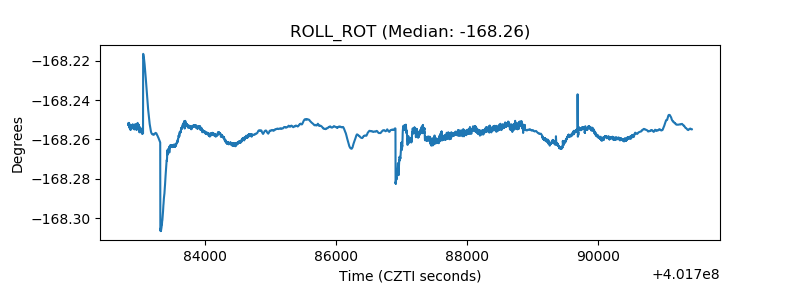 |
| _Roll_DEC | 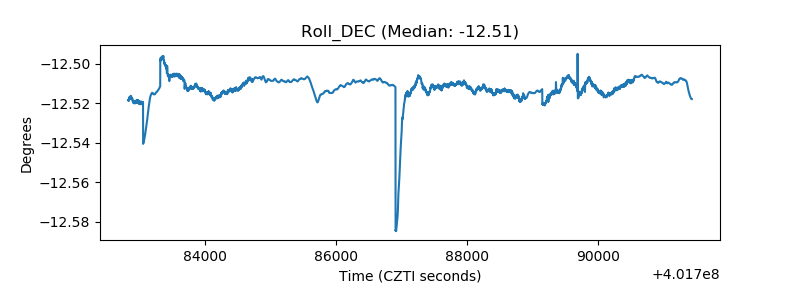 |
| _Roll_RA | 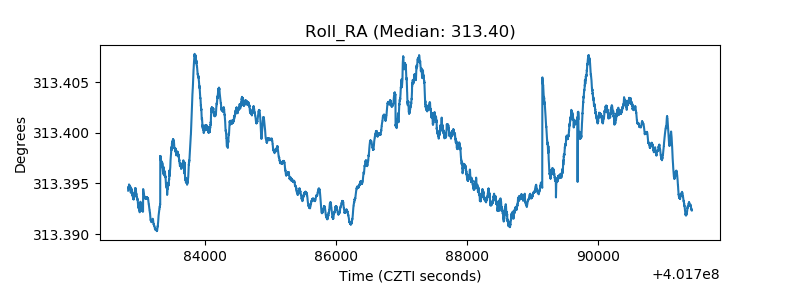 |
| Veto Counter | 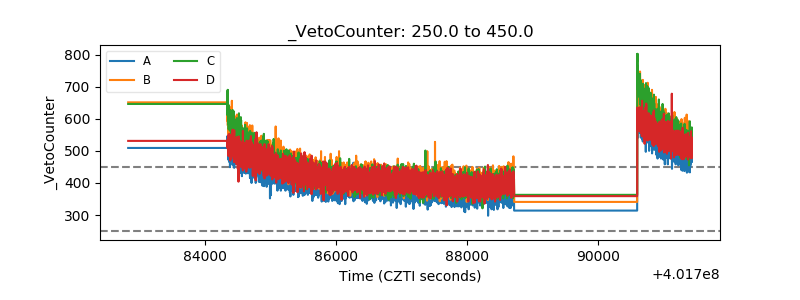 |