| Param | Original file | Final file |
|---|---|---|
| Filename | modeM0/AS1A10_103T06_9000005348_37810cztM0_level2.evt | modeM0/AS1A10_103T06_9000005348_37810cztM0_level2_quad_clean.evt |
| Size (bytes) | 495,328,320 | 99,025,920 |
| Size | 472.4 MB | 94.4 MB |
| Events in quadrant A | 3,163,403 | 671,016 |
| Events in quadrant B | 3,302,057 | 681,678 |
| Events in quadrant C | 2,940,077 | 676,035 |
| Events in quadrant D | 5,240,094 | 602,655 |
| Mode M9 | |||
|---|---|---|---|
| Quadrant | BADHDUFLAG | Total packets | Discarded packets |
| A | 0 | 41 | 0 |
| B | 0 | 41 | 0 |
| C | 0 | 41 | 0 |
| D | 0 | 41 | 0 |
| Mode M0 | |||
|---|---|---|---|
| Quadrant | BADHDUFLAG | Total packets | Discarded packets |
| A | 0 | 12637 | 3 |
| B | 0 | 13112 | 2 |
| C | 0 | 11899 | 2 |
| D | 0 | 19199 | 2 |
| Mode SS | |||
|---|---|---|---|
| Quadrant | BADHDUFLAG | Total packets | Discarded packets |
| A | 0 | 110 | 0 |
| B | 0 | 110 | 0 |
| C | 0 | 110 | 0 |
| D | 0 | 110 | 0 |
| Quadrant | Total seconds | Saturated seconds | Saturation percentage |
|---|---|---|---|
| A | 5243 | 26 | 0.495899% |
| B | 5243 | 96 | 1.831013% |
| C | 5243 | 17 | 0.324242% |
| D | 5243 | 612 | 11.672706% |
Noise dominated data is calculated using 1-second bins in cleaned event files. If a bin has >2000 counts, and if more than 50% of those come from <1% of pixels, then it is considered to be noise-dominated and hence unusable.
| Quadrant | # 1 sec bins | Bins with >0 counts | Bins with >2000 counts | High rate bins dominated by noise | Noise dominated (total time) | Noise dominated (detector-on time) | Marked lightcurve |
|---|---|---|---|---|---|---|---|
| A | 9339 | 5245 | 11 | 11 | 0.12% | 0.21% | 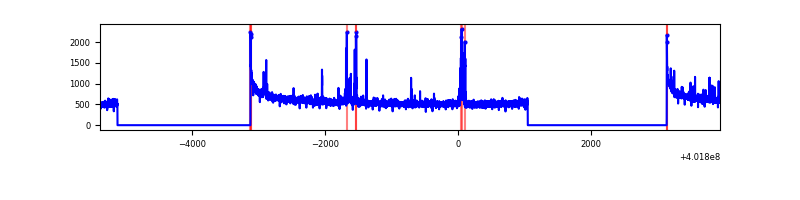 |
| B | 9339 | 5245 | 91 | 91 | 0.97% | 1.73% | 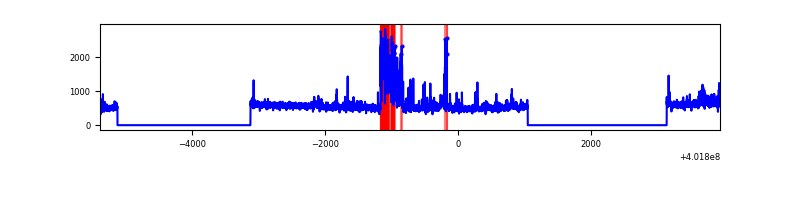 |
| C | 9339 | 5245 | 11 | 11 | 0.12% | 0.21% | 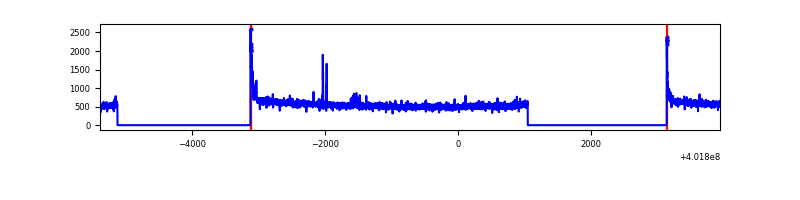 |
| D | 9339 | 5245 | 671 | 671 | 7.18% | 12.79% | 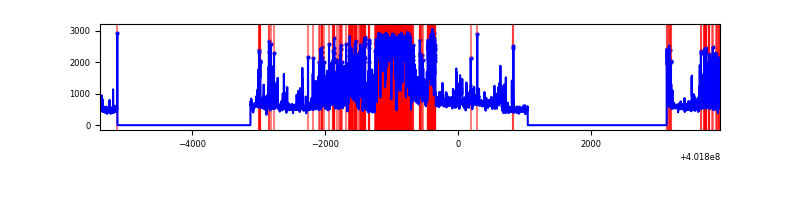 |
Top three noisy pixels from each quadrant. If the there are fewer than three noisy pixels in the level2.evt file, extra rows are filled as -1
| Pixel properties | Quadrant properties | ||||||
|---|---|---|---|---|---|---|---|
| Quadrant | DetID | PixID | Counts | Sigma | Mean | Median | Sigma |
| A | 10 | 83 | 337525 | 2445.23 | 690 | 679 | 137.8 |
| A | 9 | 143 | 68406 | 491.64 | 690 | 679 | 137.8 |
| A | 13 | 248 | 54721 | 392.3 | 690 | 679 | 137.8 |
| B | 5 | 172 | 322639 | 2500.97 | 680 | 666 | 128.7 |
| B | 4 | 232 | 79269 | 610.56 | 680 | 666 | 128.7 |
| B | 0 | 189 | 78504 | 604.62 | 680 | 666 | 128.7 |
| C | 15 | 214 | 241432 | 1575.19 | 662 | 668 | 152.8 |
| C | 0 | 10 | 76465 | 495.9 | 662 | 668 | 152.8 |
| C | 0 | 207 | 23778 | 151.2 | 662 | 668 | 152.8 |
| D | 5 | 222 | 2228414 | 14312.55 | 644 | 630 | 155.7 |
| D | 2 | 249 | 187782 | 1202.37 | 644 | 630 | 155.7 |
| D | 10 | 199 | 114078 | 728.85 | 644 | 630 | 155.7 |
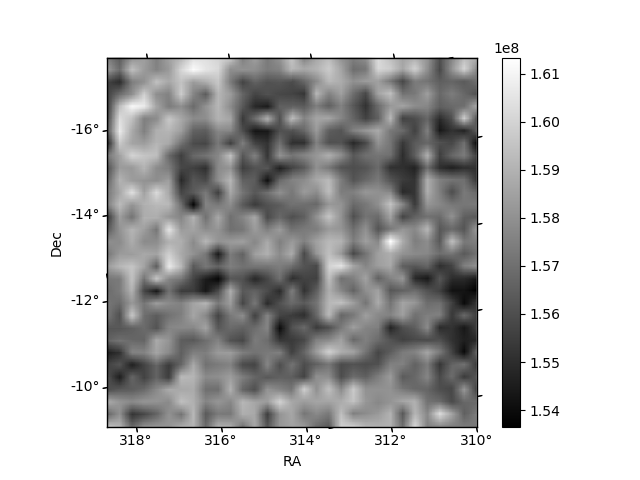
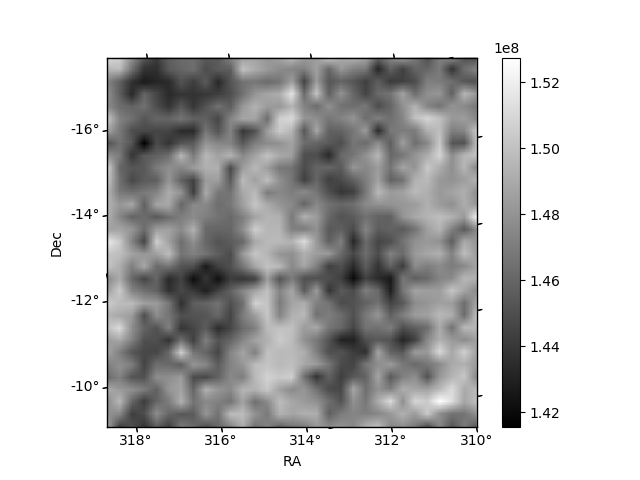
Histogram calculated using DETX and DETY for each event in the final _common_clean file
| Quadrant A | 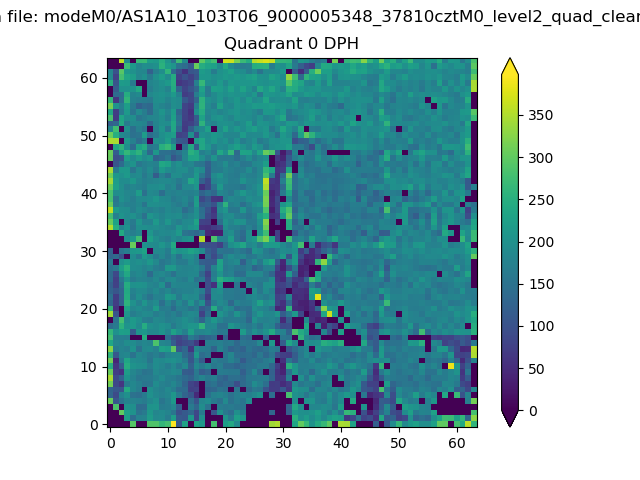 |
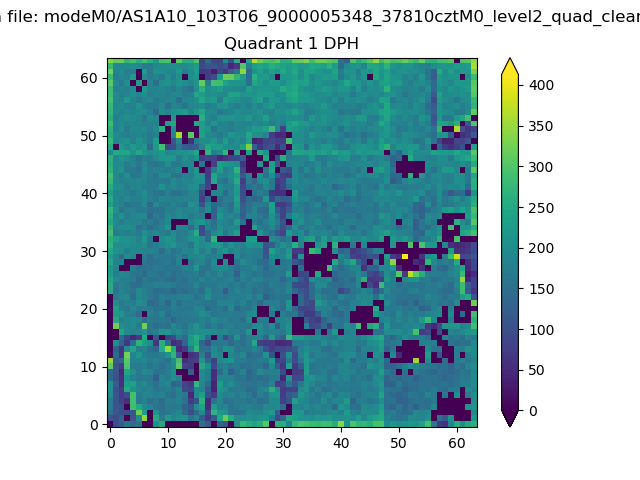 |
Quadrant B |
|---|---|---|---|
| Quadrant D |  |
 |
Quadrant C |
| Plot type | Count rate plots | Images |
|---|---|---|
| Comparison with Poisson distribution Blue bars denote a histogram of data divided into 1 sec bins. Red curve is a Poisson curve with rate = median count rate of data. |
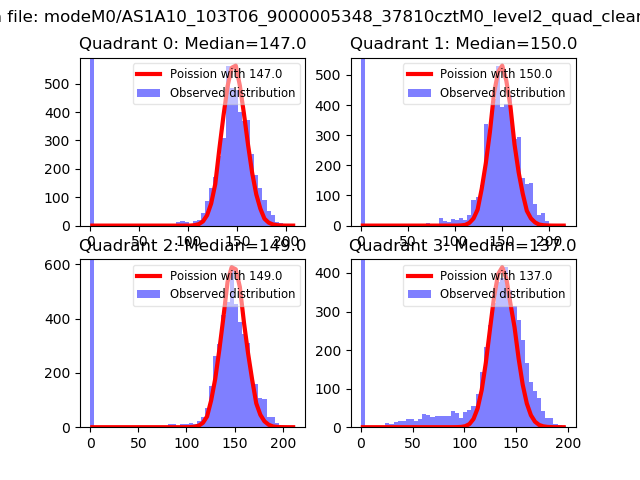 |
 |
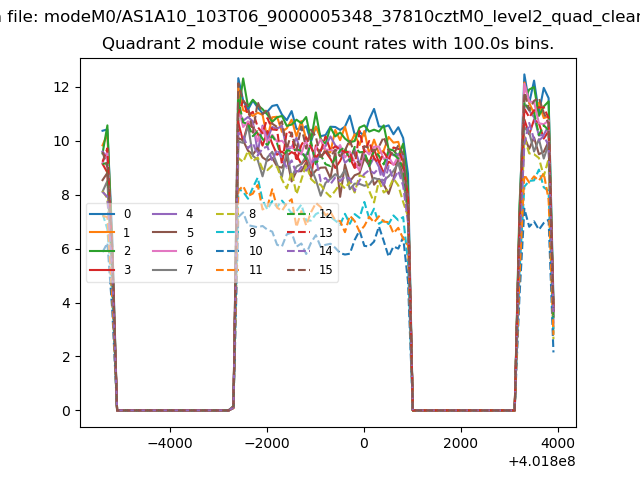
| Quadrant-wise count rates Data is divided into 100 sec bins |
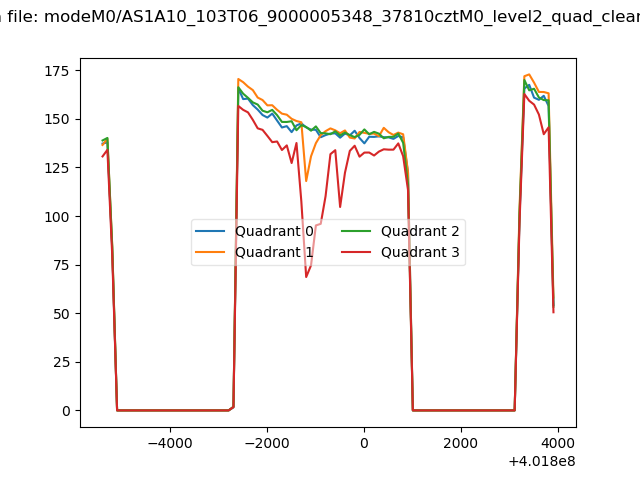 |
|
| Module-wise count rates for Quadrant A Data is divided into 100 sec bins |
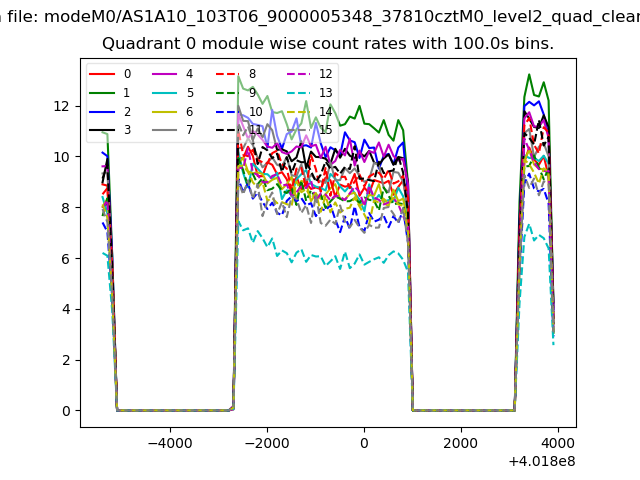 |
 |
| Module-wise count rates for Quadrant B Data is divided into 100 sec bins |
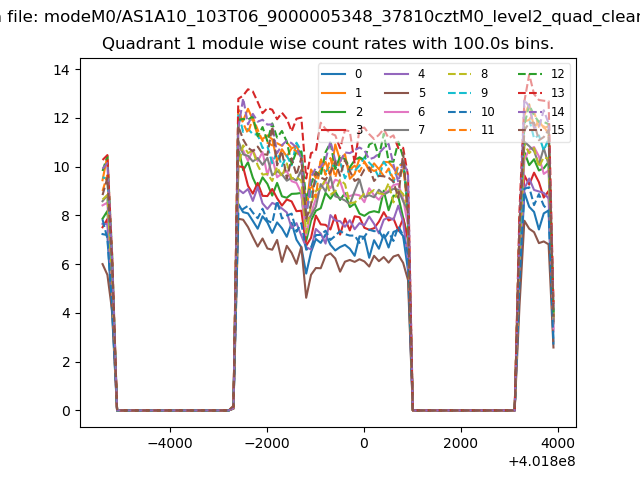 |
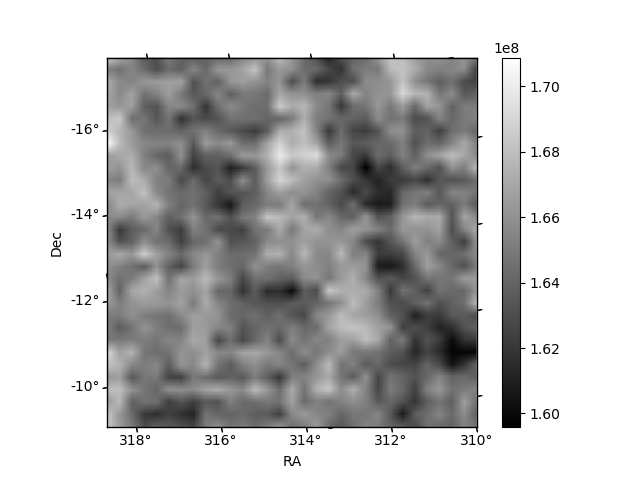 |
| Module-wise count rates for Quadrant C Data is divided into 100 sec bins |
 |
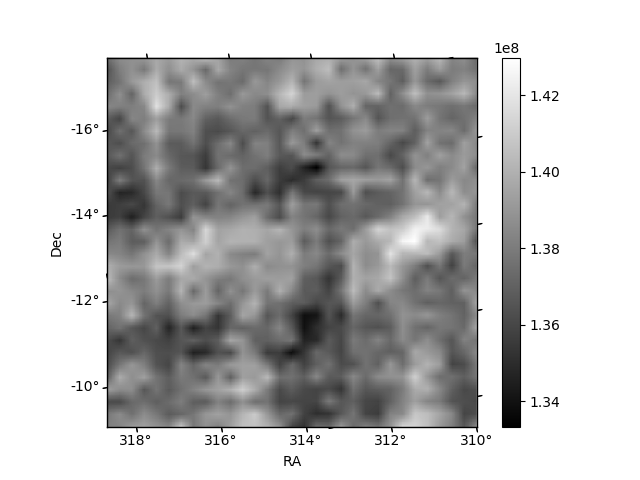 |
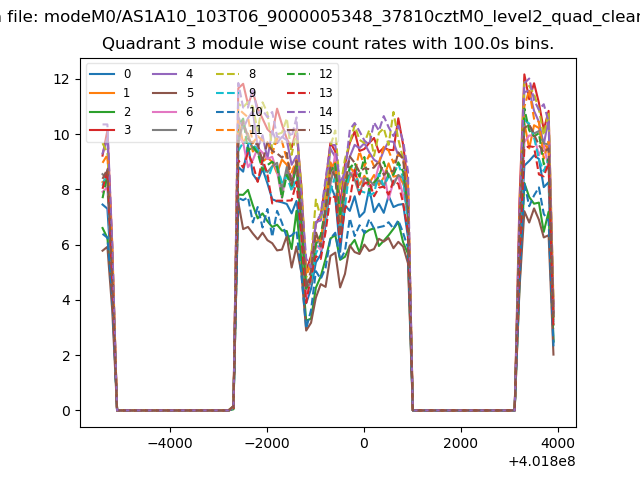
| Module-wise count rates for Quadrant D Data is divided into 100 sec bins |
 |
 |
| Parameter | Plot |
|---|---|
| CZT HV Monitor | 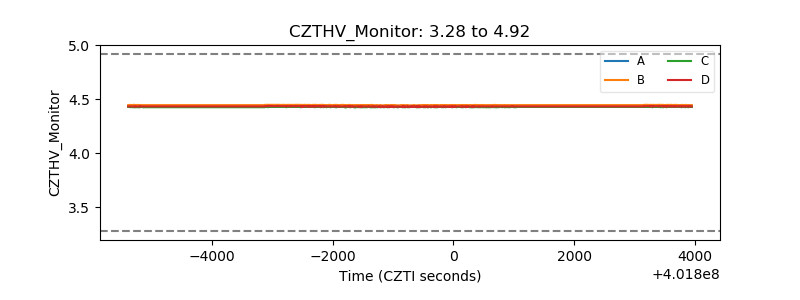 |
| D_VDD | 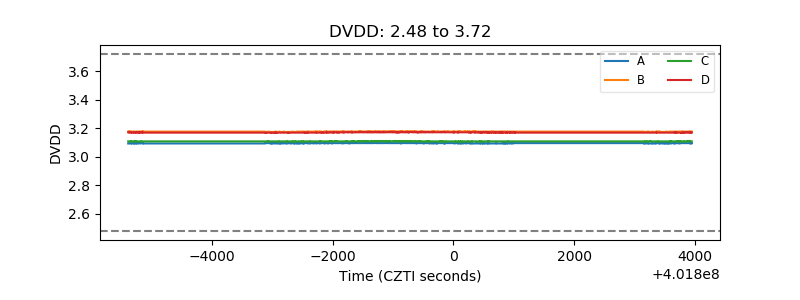 |
| Temperature 1 | 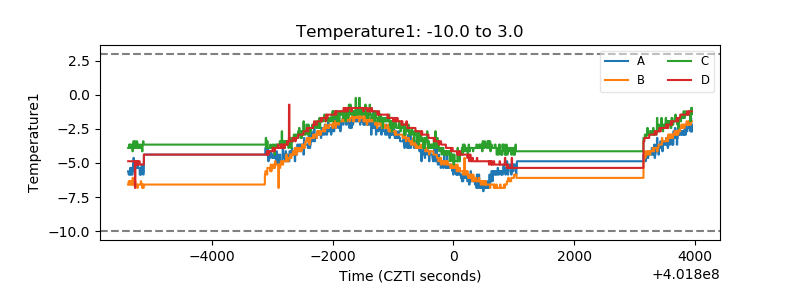 |
| Veto HV Monitor | 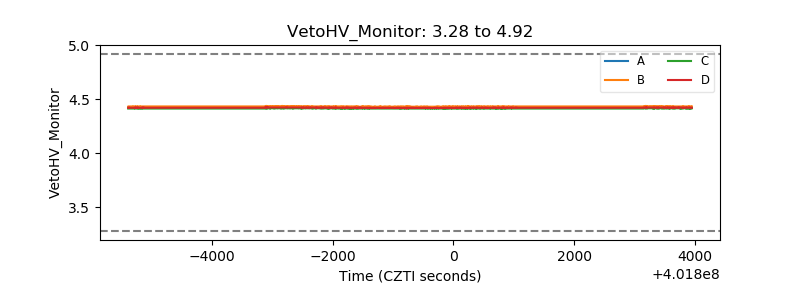 |
| Veto LLD | 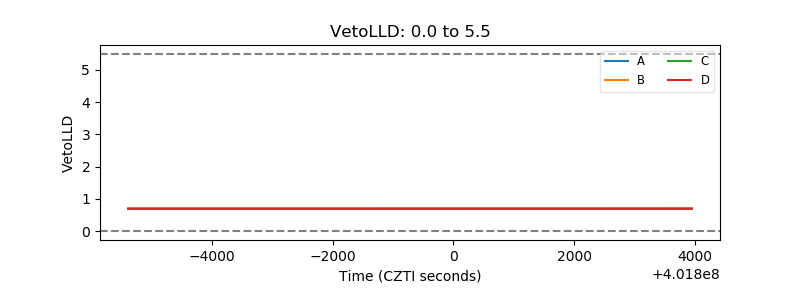 |
| Alpha Counter | 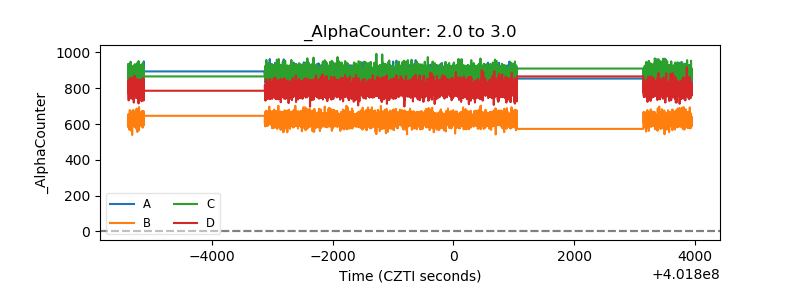 |
| _CPM_Rate | 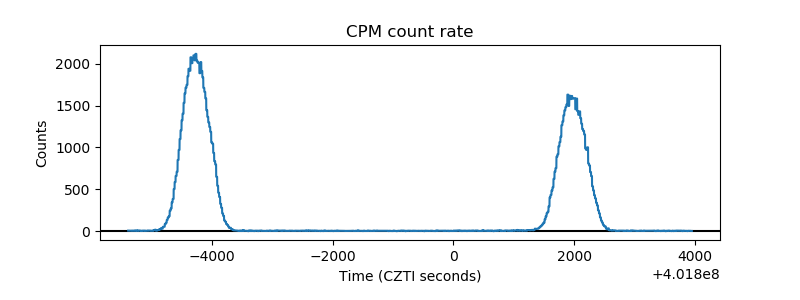 |
| CZT Counter | 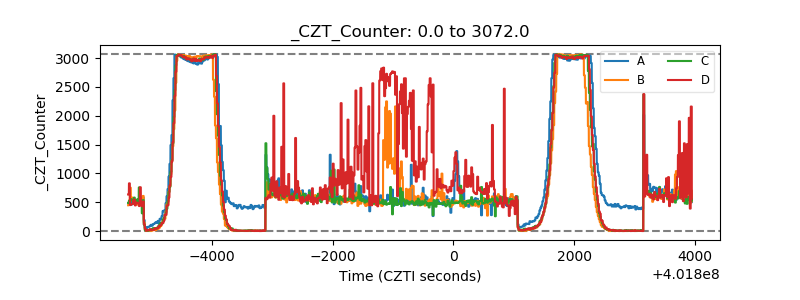 |
| +2.5 Volts monitor | 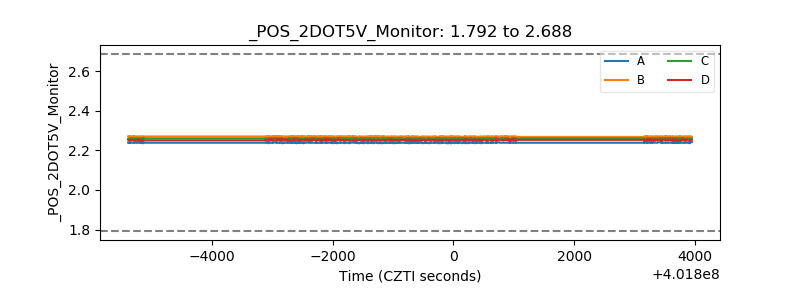 |
| +5 Volts monitor | 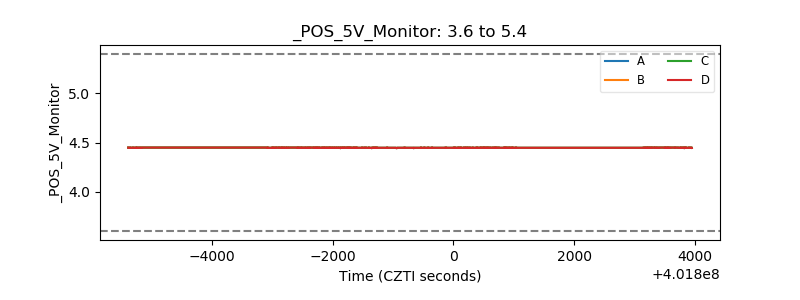 |
| _ROLL_ROT | 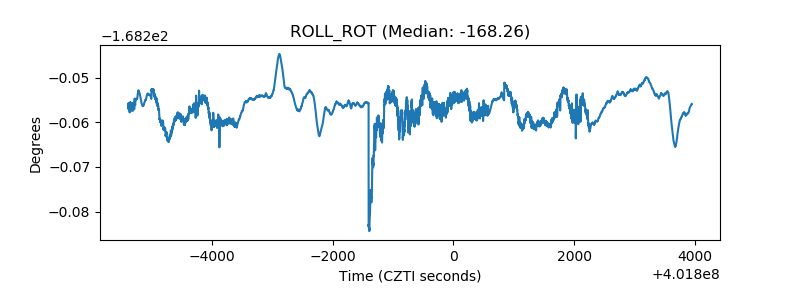 |
| _Roll_DEC | 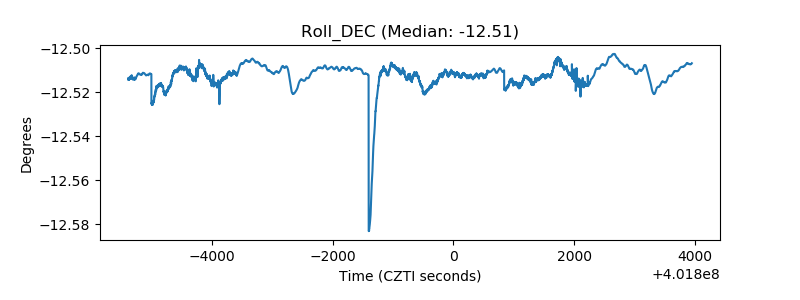 |
| _Roll_RA | 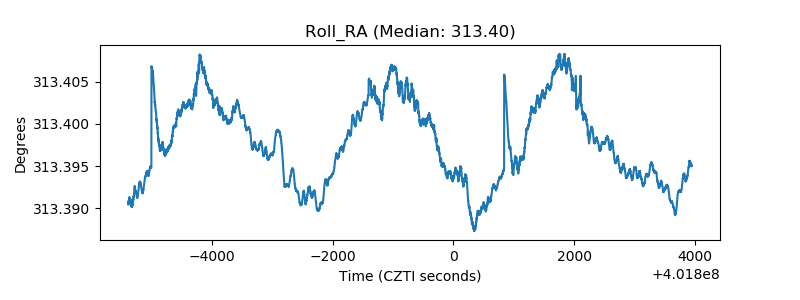 |
| Veto Counter | 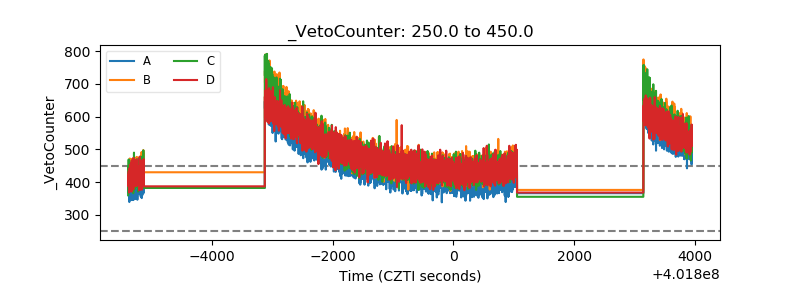 |